MMM - VSDA: Delivering Superior Dividend Growth But Average Return
2023-08-11 15:59:47 ET
Summary
- VictoryShares Dividend Accelerator ETF identifies companies with a higher probability of future dividend growth.
- The VSDA ETF is heavily invested in industrials and consumer staples sectors.
- VSDA has delivered a strong dividend growth rate since 2018, but its total return is average among its peers.
This article series aims at evaluating ETFs (exchange-traded funds) regarding past performance and portfolio metrics. Reviews with updated data are posted when necessary.
VSDA strategy and portfolio
VictoryShares Dividend Accelerator ETF ( VSDA ) started investing operations on 04/18/2017. It tracks the Nasdaq Victory Dividend Accelerator Index. VSDA has a portfolio of 75 stocks, a dividend yield of 2.28% and a net expense ratio of 0.35%. Distributions are paid monthly.
As described by Victory Capital ,
“ The Index screens companies in the Parent Index using a number of proprietary fundamental factors that have been identified by a quantitative multi-factor selection process to identify dividend paying companies with a higher probability of future dividend growth. Within this smaller set of companies, the Index weights the constituent securities using a methodology designed to maximize dividend growth, measured at a portfolio level, within established portfolio constraints (such as maximum weightings of index constituents and sectors). The Index is reconstituted every April and rebalanced quarterly.”
VSDA is exclusively invested in U.S. companies, 60.6% in large companies, 36% in mid-caps and 3.4% in small caps.
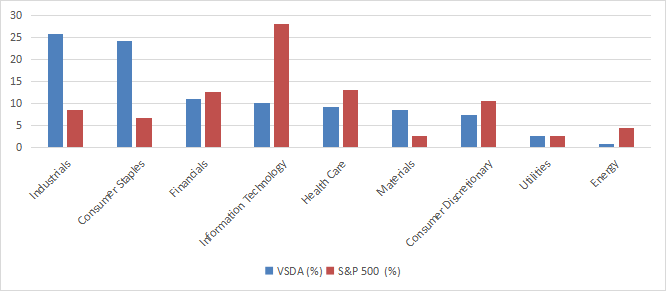
The two heaviest sectors represent half of asset value: industrials (25.8%) and consumer staples (24.2%). Other sectors are below 11%. Compared to the S&P 500 index (SP500, SPY), VSDA massively overweights the top 2 sectors, along with materials. It underweights mostly technology, energy, and ignores real estate and communication.
The top 10 holdings, listed below with fundamental ratios, represent 25.3% of asset value. The heaviest one weighs 3.55%, so risks related to individual companies are moderate.
| Ticker |
| Name |
| Weight% |
| EPS growth %TTM |
| P/E TTM |
| P/E fwd |
| Yield% |
| 3M Co. |
| 3.55 |
| -139.69 |
| N/A |
| 11.69 |
| 5.77 |
| Flowers Foods, Inc. |
| 3.42 |
| -3.01 |
| 24.74 |
| 20.73 |
| 3.71 |
| Apple Inc. |
| 2.58 |
| -1.68 |
| 29.91 |
| 29.41 |
| 0.54 |
| Jack Henry & Associates, Inc. |
| 2.53 |
| -1.93 |
| 35.96 |
| 35.34 |
| 1.21 |
| Union Pacific Corp. |
| 2.38 |
| 2.05 |
| 21.02 |
| 22.01 |
| 2.26 |
| Consolidated Edison, Inc. |
| 2.34 |
| 52.35 |
| 13.00 |
| 18.49 |
| 3.58 |
| Agilent Technologies, Inc. |
| 2.21 |
| 9.16 |
| 28.13 |
| 22.82 |
| 0.71 |
| NetApp, Inc. |
| 2.16 |
| 41.34 |
| 13.27 |
| 13.49 |
| 2.60 |
| Landstar System, Inc. |
| 2.09 |
| -21.55 |
| 21.15 |
| 25.99 |
| 1.67 |
| Colgate-Palmolive Co. |
| 2.08 |
| -22.20 |
| 42.53 |
| 24.10 |
| 2.52 |
Performance
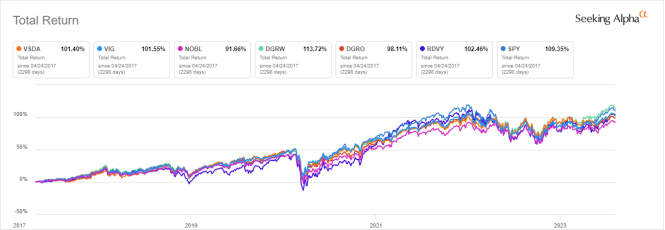
The next chart compares total returns since inception of VSDA, the S&P 500 index ( SPY ) and five dividend growth ETFs:
- Vanguard Dividend Appreciation Index Fund ( VIG ),
- ProShares S&P 500 Dividend Aristocrats ETF ( NOBL ),
- WisdomTree U.S. Quality Dividend Growth Fund ( DGRW ),
- iShares Core Dividend Growth ETF ( DGRO ),
- First Trust Rising Dividend Achievers ETF ( RDVY ).
VSDA performance puts it in the middle of the pack.
VSDA vs competitors and benchmark, total return since inception (Seeking Alpha)
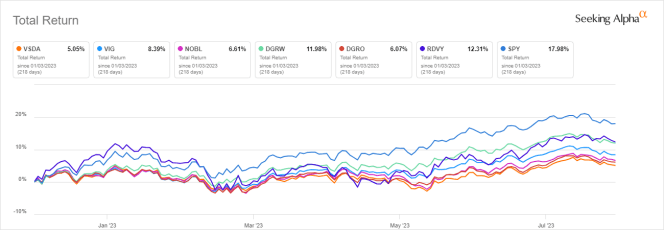
In 2023 to date, VSDA has been lagging its peers and the benchmark:
VSDA vs competitors and benchmark, YTD total return (Seeking Alpha)
The sum of annual distributions has increased from $0.47 to $0.82 per share between 2018 and 2022. It is a growth of 74.5%, beating by far the cumulative inflation in the same period: about 18%, based on CPI. The annualized dividend growth rate is 14.9%, which is excellent. As a reference, Vanguard Dividend Appreciation Index Fund ((VIG)) shows an annualized dividend growth rate of 9.9% in the same time.
VSDA distribution history (Seeking Alpha)
Comparing VSDA with a reference strategy based on dividend and quality
In previous articles, I have shown how three factors may help cut the risk in a dividend portfolio: Return on Assets , Piotroski F-score , and Altman Z-score .
The next table compares VSDA since 5/1/2018 with a subset of the S&P 500: stocks with a dividend yield above the average of their respective indexes, an above-average ROA, a good Altman Z-score, a good Piotroski F-score and a sustainable payout ratio. It is rebalanced once a year to make it comparable with a passive index.
| Total Return |
| Annual.Return |
| Drawdown |
| Sharpe ratio |
| Volatility |
| VSDA |
| 83.27% |
| 12.16% |
| -32.11% |
| 0.67 |
| 17.22% |
| Dividend quality subset |
| 83.88% |
| 12.23% |
| -37.55% |
| 0.6 |
| 19.79% |
Past performance is not a guarantee of future returns. Data Source: Portfolio123.
VSDA is almost on par with the dividend and quality subset in return and slightly ahead of it in risk-adjusted performance (Sharpe ratio). It is an excellent point for the fund: in most of my dividend ETF reviews, the subset is ahead. My core portfolio holds 14 stocks selected in this subset (more info at the end of this post).
Valuation and Quality
VSDA is cheaper than the S&P 500 regarding valuation metrics, as reported in the next table. However, the price-to-book ratios are similar.
| VSDA |
| SPY |
| P/E TTM |
| 19.76 |
| 23.32 |
| Price/Book |
| 4.04 |
| 4.1 |
| Price/Sales |
| 1.67 |
| 2.62 |
| Price/Cash Flow |
| 15.09 |
| 16.37 |
Data: Fidelity.
In my ETF reviews, risky stocks are companies with at least 2 red flags among: bad Piotroski score, negative ROA, unsustainable payout ratio, bad or dubious Altman Z-score, excluding financials and real estate where these metrics are unreliable. VSDA portfolio has only five risky stocks regarding these criteria. They represent an aggregate weight of 7.7%, which is a good point.
According to my calculation of aggregate quality metrics, VSDA is a bit superior to the S&P 500 (see next table).
| VSDA |
| SPY |
| Atman Z-score |
| 4.61 |
| 3.53 |
| Piotroski F-score |
| 5.76 |
| 5.64 |
| ROA % TTM |
| 8.84 |
| 7.24 |
Takeaway
VictoryShares Dividend Accelerator ETF identifies companies with a higher probability of future dividend growth. Half of asset value is in two sectors: industrials and consumer staples. The fund looks better than the S&P 500 regarding valuation and quality metrics. However, it is slightly behind it in total return since inception.
VictoryShares Dividend Accelerator ETF has reached its main goal by delivering a superior dividend growth rate since 2018, but its total return is average among peers. VSDA has the maximum five-star rating at Morningstar. Liquidity is quite low, which may be a problem for short-term trades, but not for long-term positions.
For further details see:
VSDA: Delivering Superior Dividend Growth, But Average Return