VSDA - VSDA ETF: Yes And No
2023-10-24 21:42:28 ET
Summary
- VictoryShares Dividend Accelerator ETF uses a regression-based screening mechanism to select dividend growth stocks.
- We compare VSDA to the largest alternative in the US dividend growth ETF space.
- Although we are not entirely moved by this product's qualities, we highlight a few reasons why it may do well at this juncture.
Regression-Based Screening Mechanism
Investors who are interested in the dividend-growth breed of ETF products have around 20 different products to choose from. Today, we’ll explore the qualities of the VictoryShares Dividend Accelerator ETF ( VSDA ) which doesn’t quite follow the conventional screening methodology that most other ETFs follow.
VSDA’s primary remit is to pick out 75 quality dividend growers (REITs are not included), and what's key is that it looks for stocks that not only have a history of increasing dividends but also those that are highly likely to maintain forward dividend growth. Most ETFs in this space only focus on the first facet and pay scant regard to the likely sustainability.
VSDA goes about ascertaining the probability of a forward YoY DPS (Dividend Per share) increase, by running a logistic regression model with 10 years of data, encompassing 14 independent variables, namely-
Dividend yield, b) ROE, c) ROIC, d) PBT to debt, e) 5-year DPS growth consistency, f) P/E, g) Gross profit margins, h) 5-year net income stability, i) 5-year sales stability, j) 5-year trend in ROE, k) cash to market cap ratio, l) 3-year monthly price volatility, m) market capitalization, n) number of the successive years of dividend growth
We are not necessarily convinced that a combination of all these variables can serve as a consummate predictor of future dividend increases. They may be useful proxies in ascertaining other qualities of a stock, but we feel that some of these variables, such as the market cap and monthly price volatility are rather superfluous in gauging dividend sustainability.
VSDA vs VIG
Regardless of what we think, has this statistical-based methodology made a world of difference in the investment community? To better understand that we’ve compared VSDA to the most popular dividend growth ETF in this space- Vanguard Dividend Appreciation Index Fund ETF Shares ( VIG ).
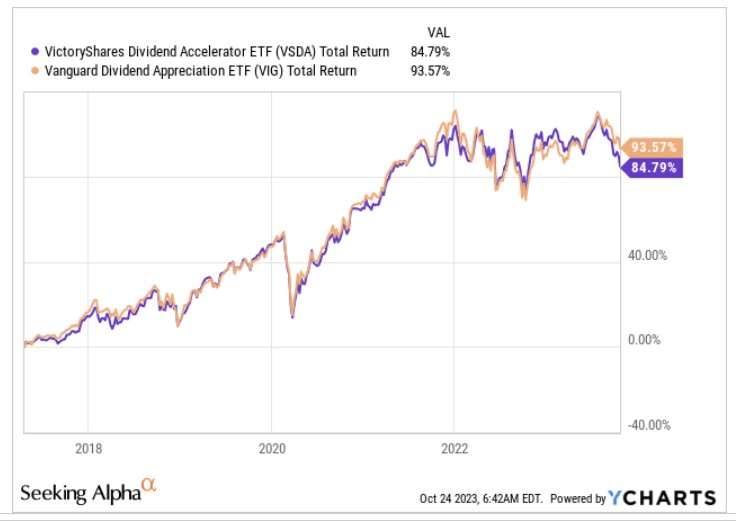
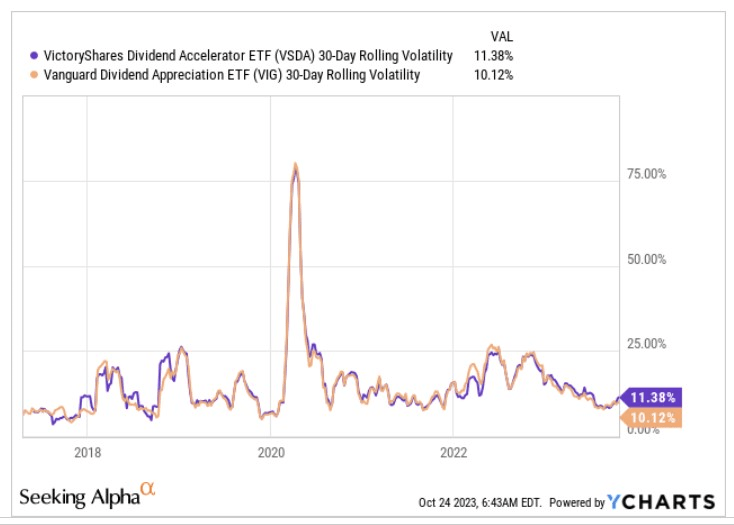
Well, firstly note that since VSDA’s inception in 2017, it has underperformed its more popular peer by roughly 900bps. Given some of the volatility variables that VSDA incorporates in the regression model, one would think that VSDA may even have a lower risk profile than VIG, but that isn’t quite the case, with VIG’s rolling volatility profile coming in around 120bps lower.
VIG’s lower volatility profile may perhaps be a function of the type of stocks it dabbles with. 83% of its portfolio consists of large-cap stocks, with only 2% exposure to small and micro-caps. On the other hand, less than half of VSDA’s portfolio comes from large-caps, whilst its small- and mid-cap share is a lot higher at 14%.
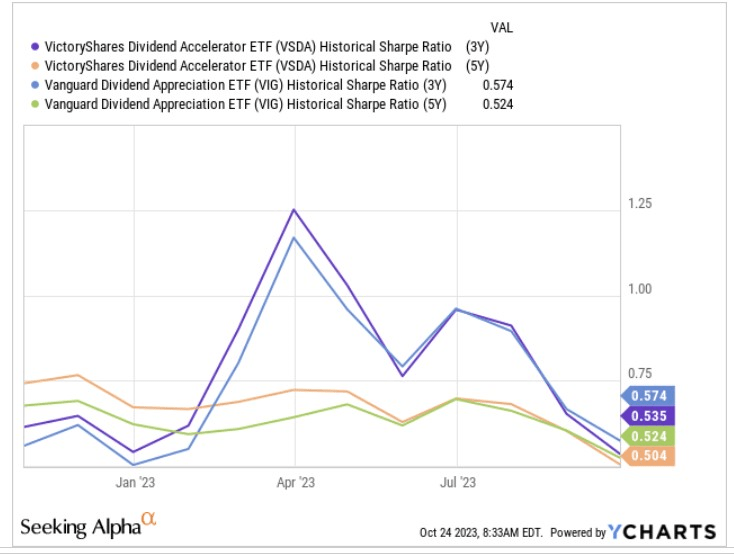
Also note that for the relative total risks that these two ETFs take, VIG does a much better job in attempting to drive some excess returns (over the risk-free rate). This is captured by its superior Sharpe ratio readings, be it on a 3-year basis or a 5-year basis
Even if one were to gauge the two structures, VSDA doesn’t come across as too compelling. Firstly, its expense ratio is almost 6x that of VIG, and secondly, it’s not particularly tax efficient, as well over half its portfolio gets turned over every year. Conversely, VIG’s annual turnover ratio is rather low at just 12%.
Where VSDA comes out on top is the income angle, particularly the degree of dividend growth that it has facilitated over time. Over the last 5 years, its dividends have grown at double-digit rates of 13% CAGR (+300bps differential vs VIG), and over the last 3 years, the level of growth has been even more impressive at 19% (over 600bps of variance vs VIG). Both ETFs currently offer better yields than their historical averages, but VSDA’s current yield is even better than VIG’s figure.
Seeking Alpha, Morningstar
Closing Thoughts- Is VSDA A Good Buy Now?
As implied in the previous section, besides the solid dividend growth credentials, there doesn’t appear to be any other great edge in pursuing VSDA over a tried-and-tested stalwart such as VIG.
Nonetheless, if you still want to push on with this product, it’s fair to say there are a few encouraging sub-plots worth highlighting.
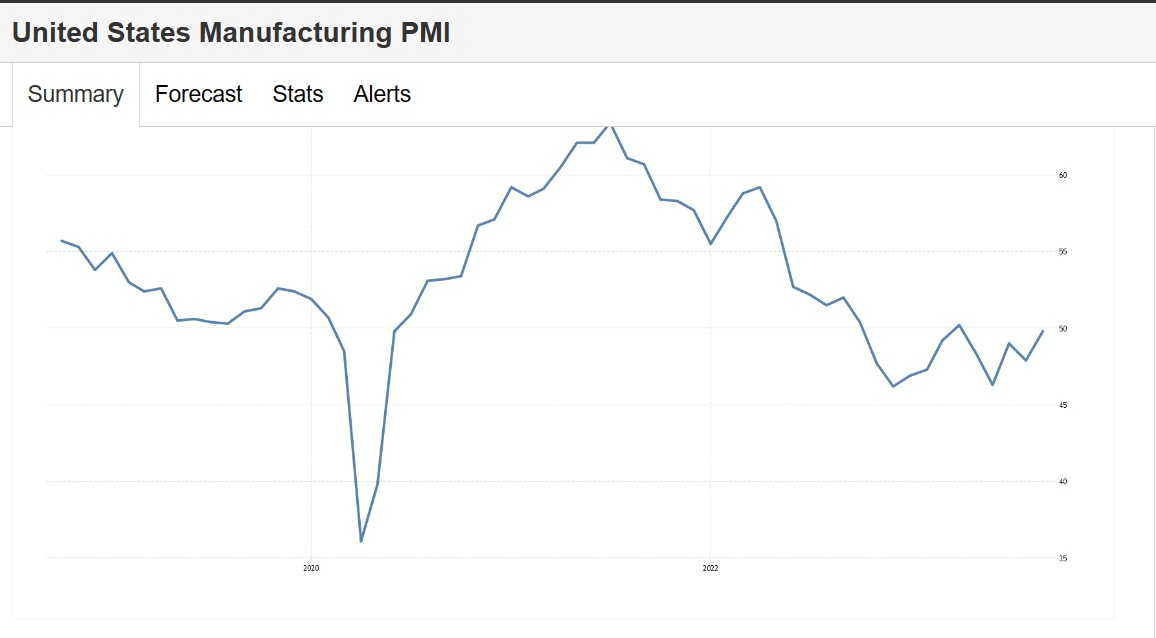
Firstly, note that VSDA is dominated by stocks from the industrials sector which currently account for over a quarter of the total holdings. This sector may not necessarily have been in great shape, but we think it could be well-placed for a rebound.
The forward-looking manufacturing PMI metrics both from ISM and the S&P Global, can serve as useful gauges to understand underlying conditions here, and it appears that things could be convalescing at a decent pace.
The S&P Global Report may still point to contraction for the 5th straight month, but with a figure of 49.8, it is not far away from hitting expansion levels. Business confidence which is a proxy for demand also rose to its highest point in 17 months.
Meanwhile, the ISM report represented its highest figure since November 2022, whilst also showing that the previously high input price pressures were coming off nicely. This development could possibly point to better operating margins in the quarters ahead.
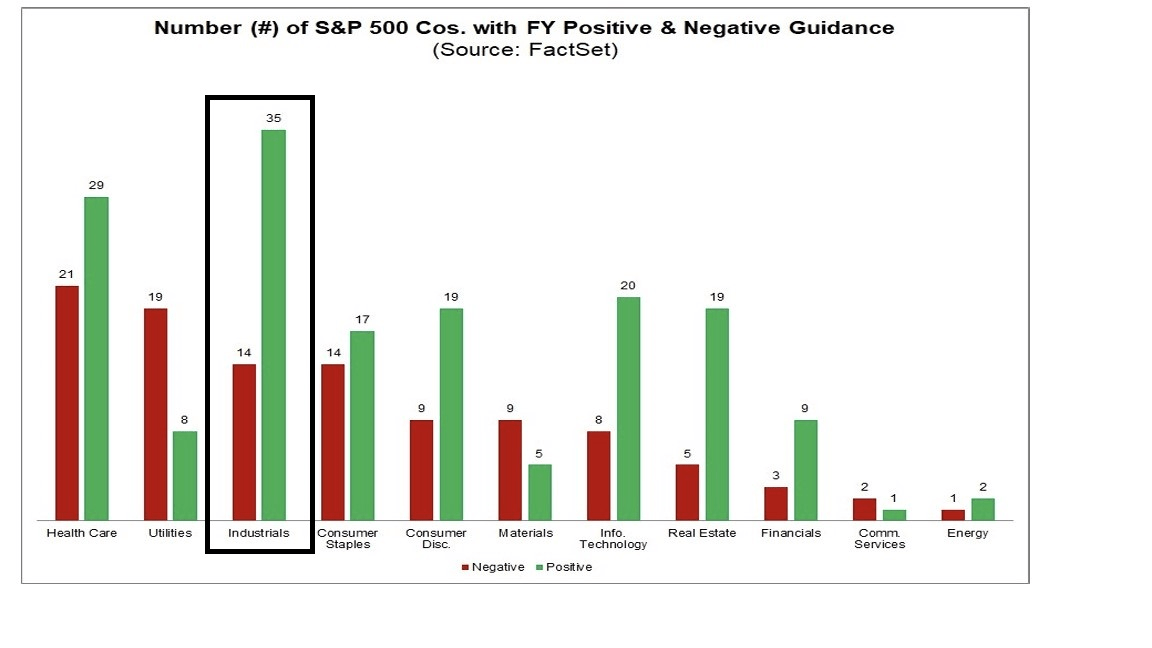
In keeping with this theme, you’d be interested to note that in the earnings guidance provided by management from different sectors in the recent quarter, it was the industrial sector that saw the most pronounced positive EPS upgrades for FY23 and FY24.
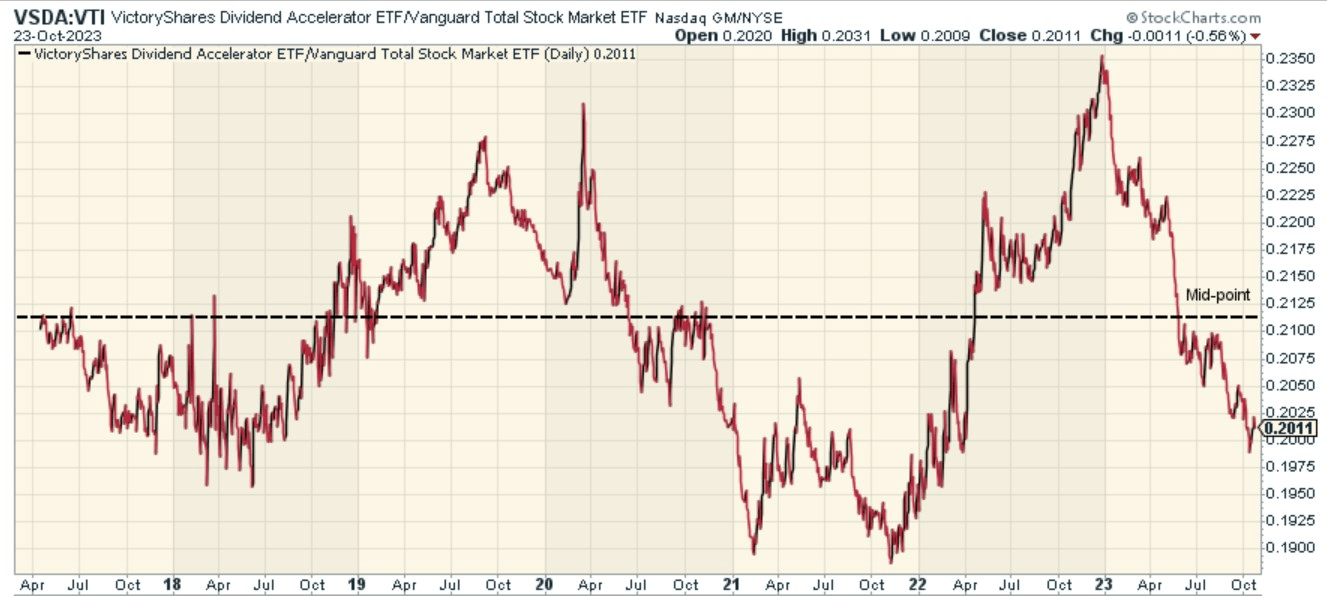
Then we know VSDA fishes for stocks across the entire stock market and not just the S&P500. So it's important to get a sense of how VSDA’s holdings are perched relative to the total market, as represented by the ETF-VTI. The image below tells us that at the start of 2023, one would not have been too keen to dabble with VSDA as the relative strength ratio versus VTI was at record highs. That is no longer the case, with the ratio now contracting even well below the mid-point of the long-term range.
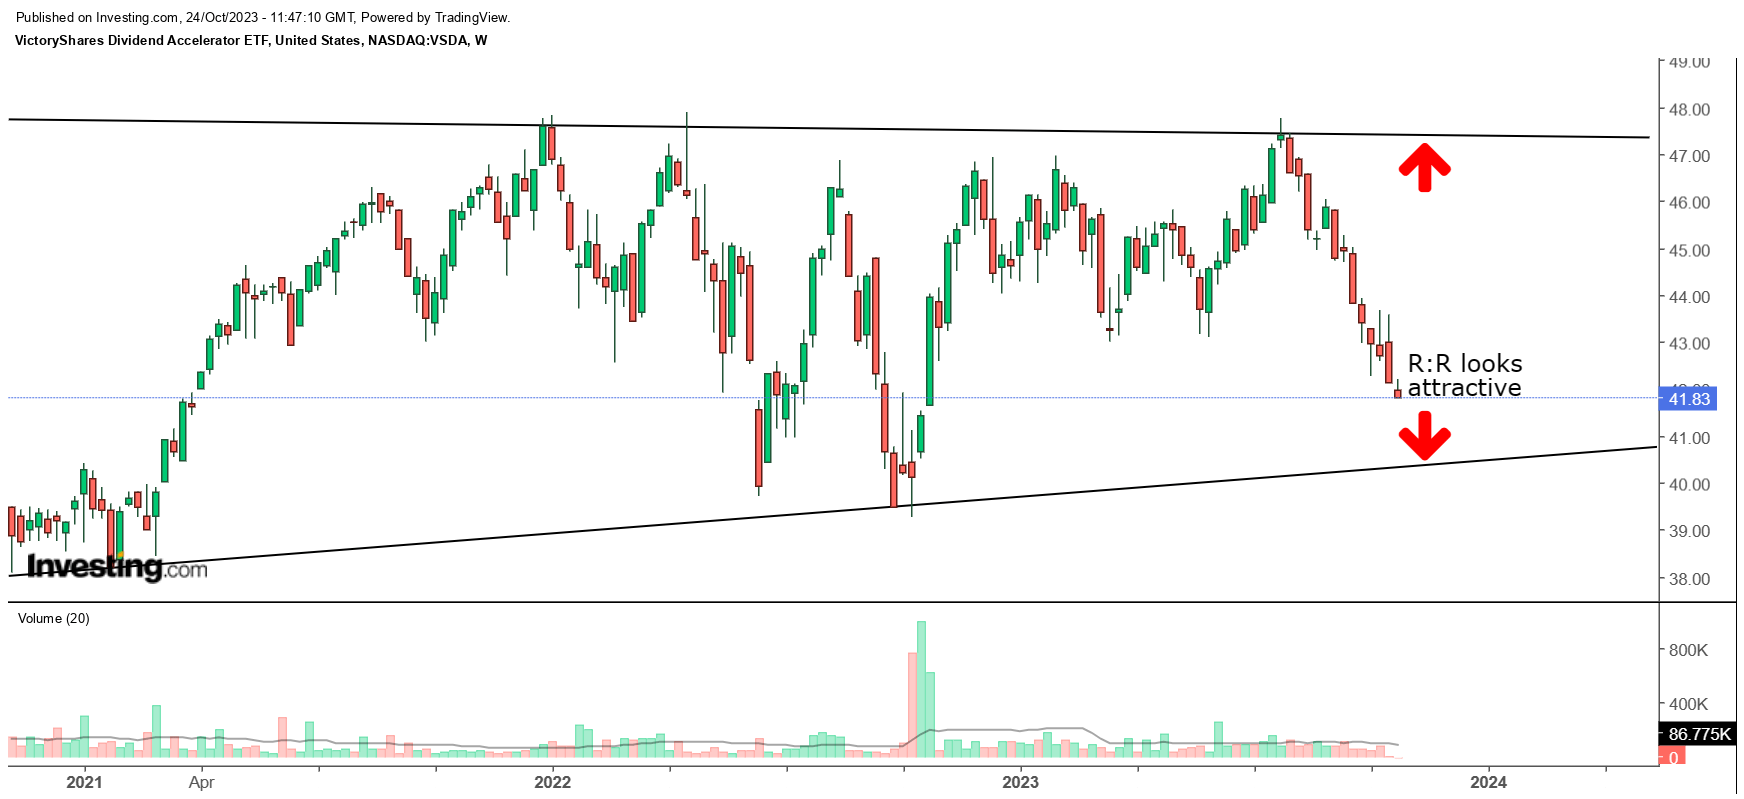
Finally, if we consider the weekly price imprints of VSDA aline, we can see that for over 3 years, this ETF has tended to chop around with a certain range, and timing your entries and exits at around the range boundaries can prove to be quite useful. In that regard, an entry at current levels doesn’t look like a bad bet, given how close the ETF currently is, to the lower boundary of its 3-year range.
For further details see:
VSDA ETF: Yes And No