VSDA - VSDA: Focuses On High Quality Dividend Growth Factor
2024-01-08 07:23:47 ET
Summary
- VictoryShares Dividend Accelerator ETF (VSDA) focuses on large-cap stocks with a history of dividend growth.
- High dividend growth is a high quality factor that tends to outperform during bear markets.
- However, as a single factor ETF, the VSDA ETF may experience volatile relative performance, making it difficult to recommend as a long-term buy.
Recently, I wrote an article reviewing the Pacer Metaurus US Large Cap Dividend Multiplier 400 ETF ( QDPL ), a fund that uses Dividend Futures to boost the distribution yield of the S&P 500 Index by 4x while retaining 85%-90% exposure to the index.
So when I came across the VictoryShares Dividend Accelerator ETF ( VSDA ), my initial thought was that the VSDA ETF is something similar to QDPL, given its name.
However, I was mistaken. The VSDA ETF actually focuses on a portfolio of large-cap stocks with a history of dividend growth. High dividend growth is associated with high quality companies and is a defensive factor, with the VSDA ETF outperforming during the 2022 bear market. Unfortunately, outside of bear markets, there is no evidence the high dividend growth factor consistently outperforms, so I am hesitant to recommend it over the long-run.
Fund Overview
The VictoryShares Dividend Accelerator ETF provides exposure to large-cap U.S. stocks with a history of increasing dividends and "the highest probability of future dividend growth".
The VSDA ETF tracks the Nasdaq Victory Dividend Accelerator Index ("Index"), an index that utilizes a proprietary rules-based approach to identify dividend paying stocks with a higher likelihood of future dividend growth. Index weights are assigned using a methodology that maximizes the portfolio's dividend growth with established portfolio constraints such as maximum single security weights. The VSDA ETF is reconstituted yearly and rebalanced quarterly.
The VSDA ETF has $260 million in assets and charges a 0.35% net expense ratio after fee waivers.
Portfolio Holdings
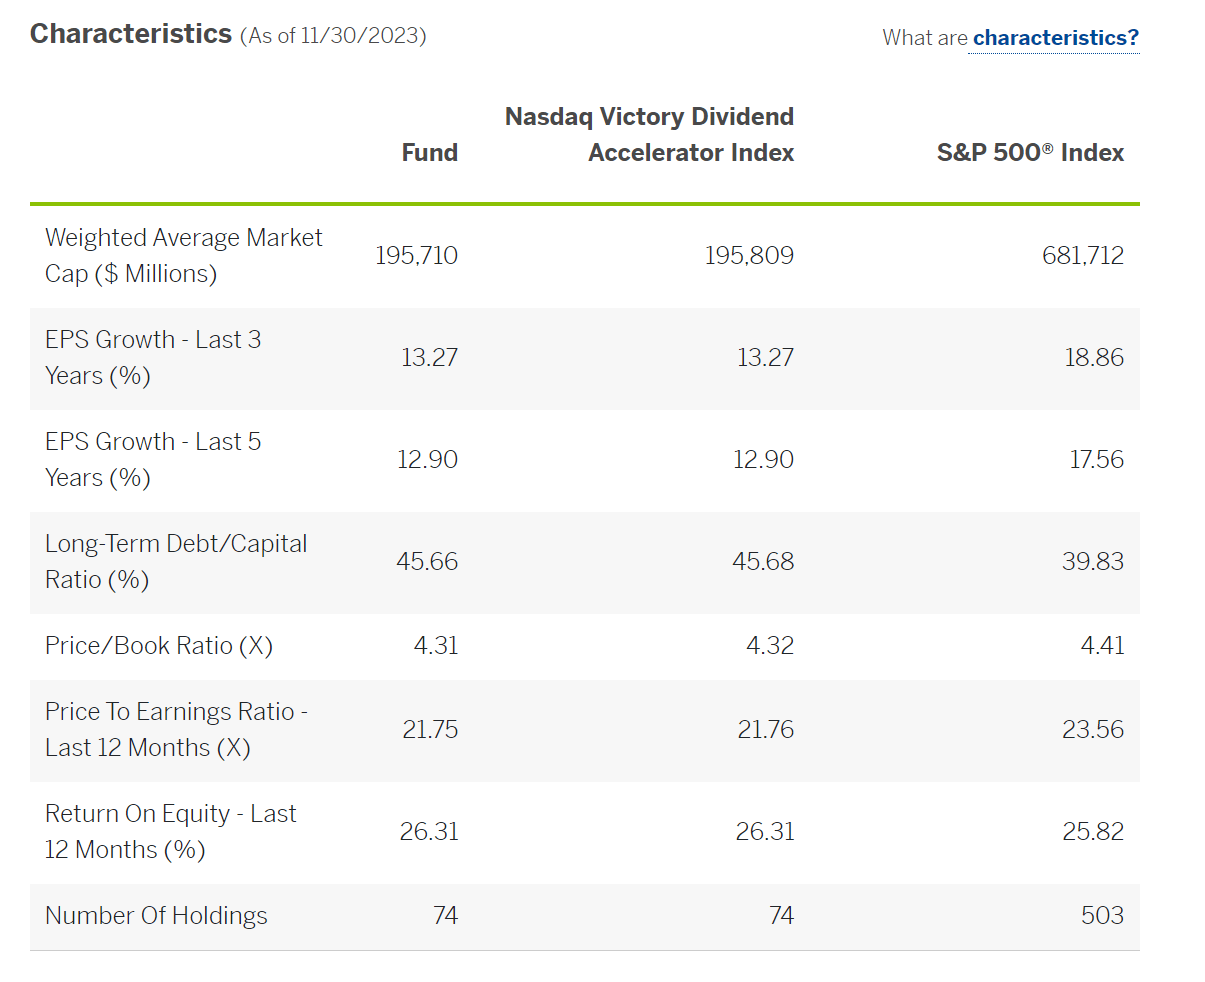
Figure 1 shows the portfolio characteristics of the VSDA ETF. Overall, the securities in VSDA's portfolio has slower EPS growth compared to the S&P 500 Index (13.3% 3 year EPS growth vs. 18.9%), but is slightly cheaper in terms of trailing 12 month P/E (21.8x vs. 23.6x).
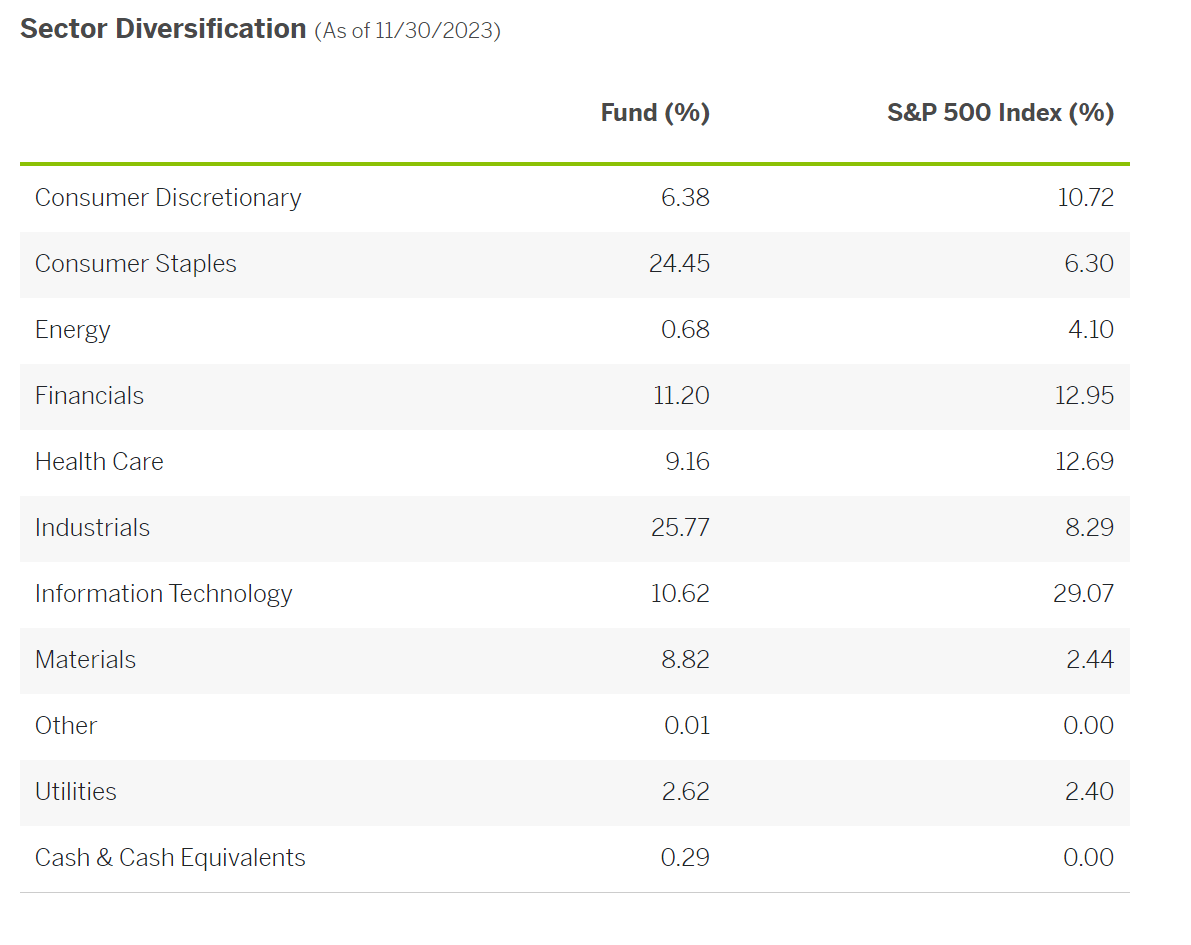
Figure 2 shows VSDA's sector allocation compared to the S&P 500 Index. VSDA's largest sector weights are Industrials (25.8%), Consumer Staples (24.5%), and Financials (11.2%). Compared to the S&P 500, VSDA is very overweight Industrials (25.8% vs. 8.3%), Consumer Staples (24.5% vs. 6.3%), and Materials (8.8% vs. 2.4%). It is very underweight Information Technology (10.6% vs. 29.1%).
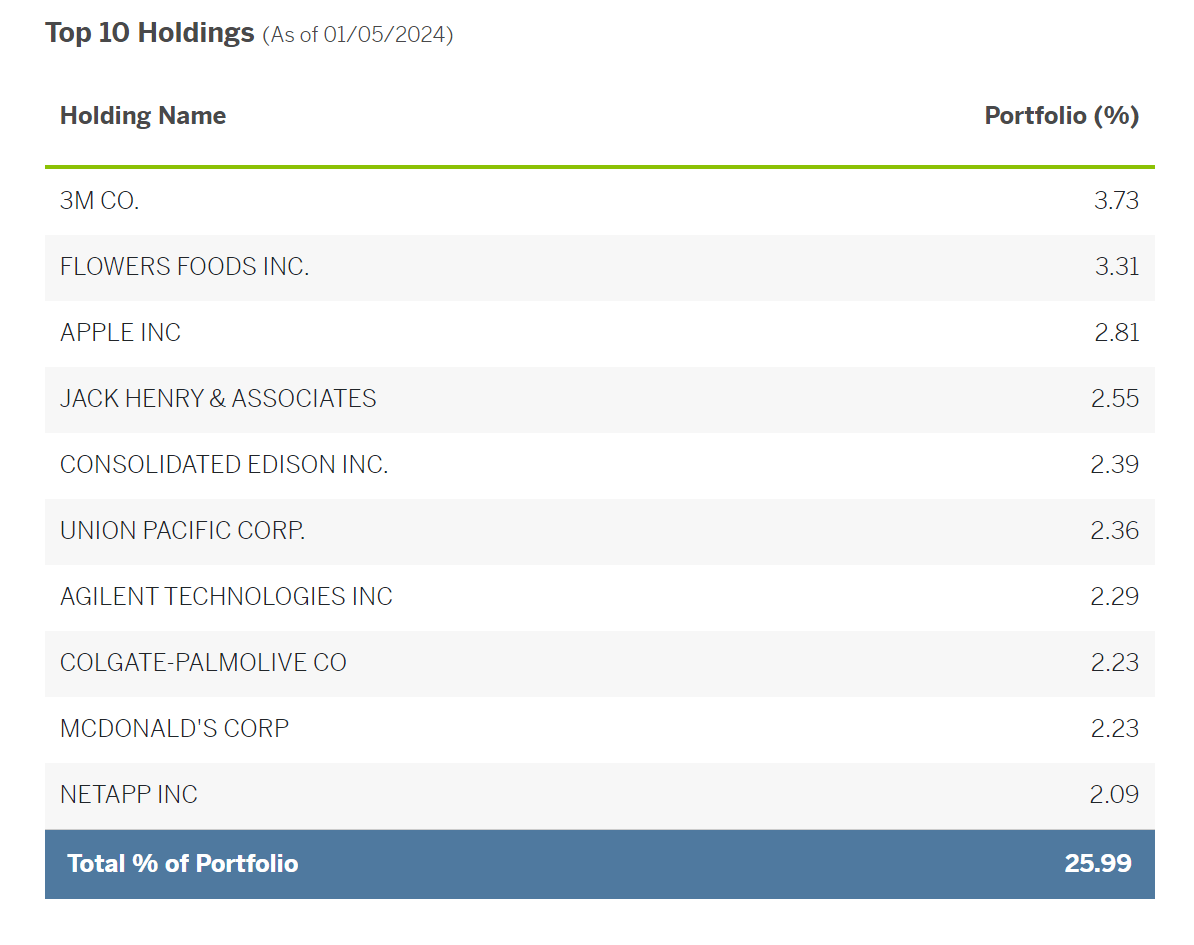
VSDA is not a very concentrated fund, with its top 10 holdings accounting for only 26.0% of the portfolio (Figure 3).
Distribution & Yield
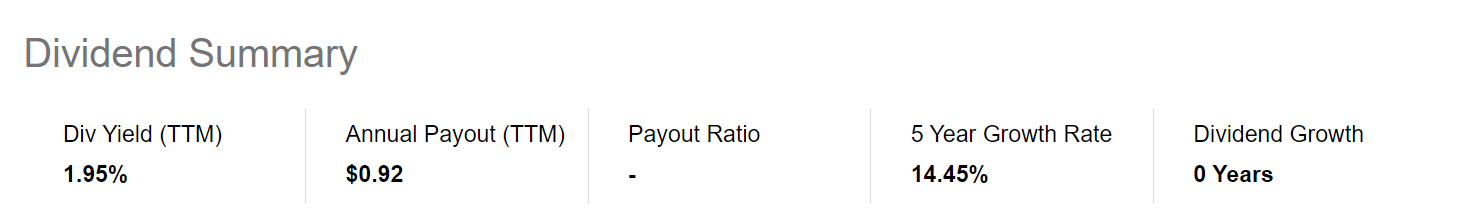
Although the VSDA ETF focuses on dividend paying stocks with strong dividend growth, that does not mean the fund itself pays a high distribution yield. The VSDA ETF pays a monthly distribution with a trailing 12 month distribution yield of 1.9% (Figure 4).
Figure 4 - VSDA pays a trailing 1.9% distribution yield (Seeking Alpha)
Returns
Figure 5 shows the historical performance of the VSDA ETF. Returns have been decent, with 3 and 5 year average annual returns of 8.2% and 12.4% respectively. However, in 2023, VSDA massively lagged the markets, returning only 8.6% compared to 26.1% for the S&P 500, as represented by the SPDR S&P 500 ETF Trust (Figure 6).
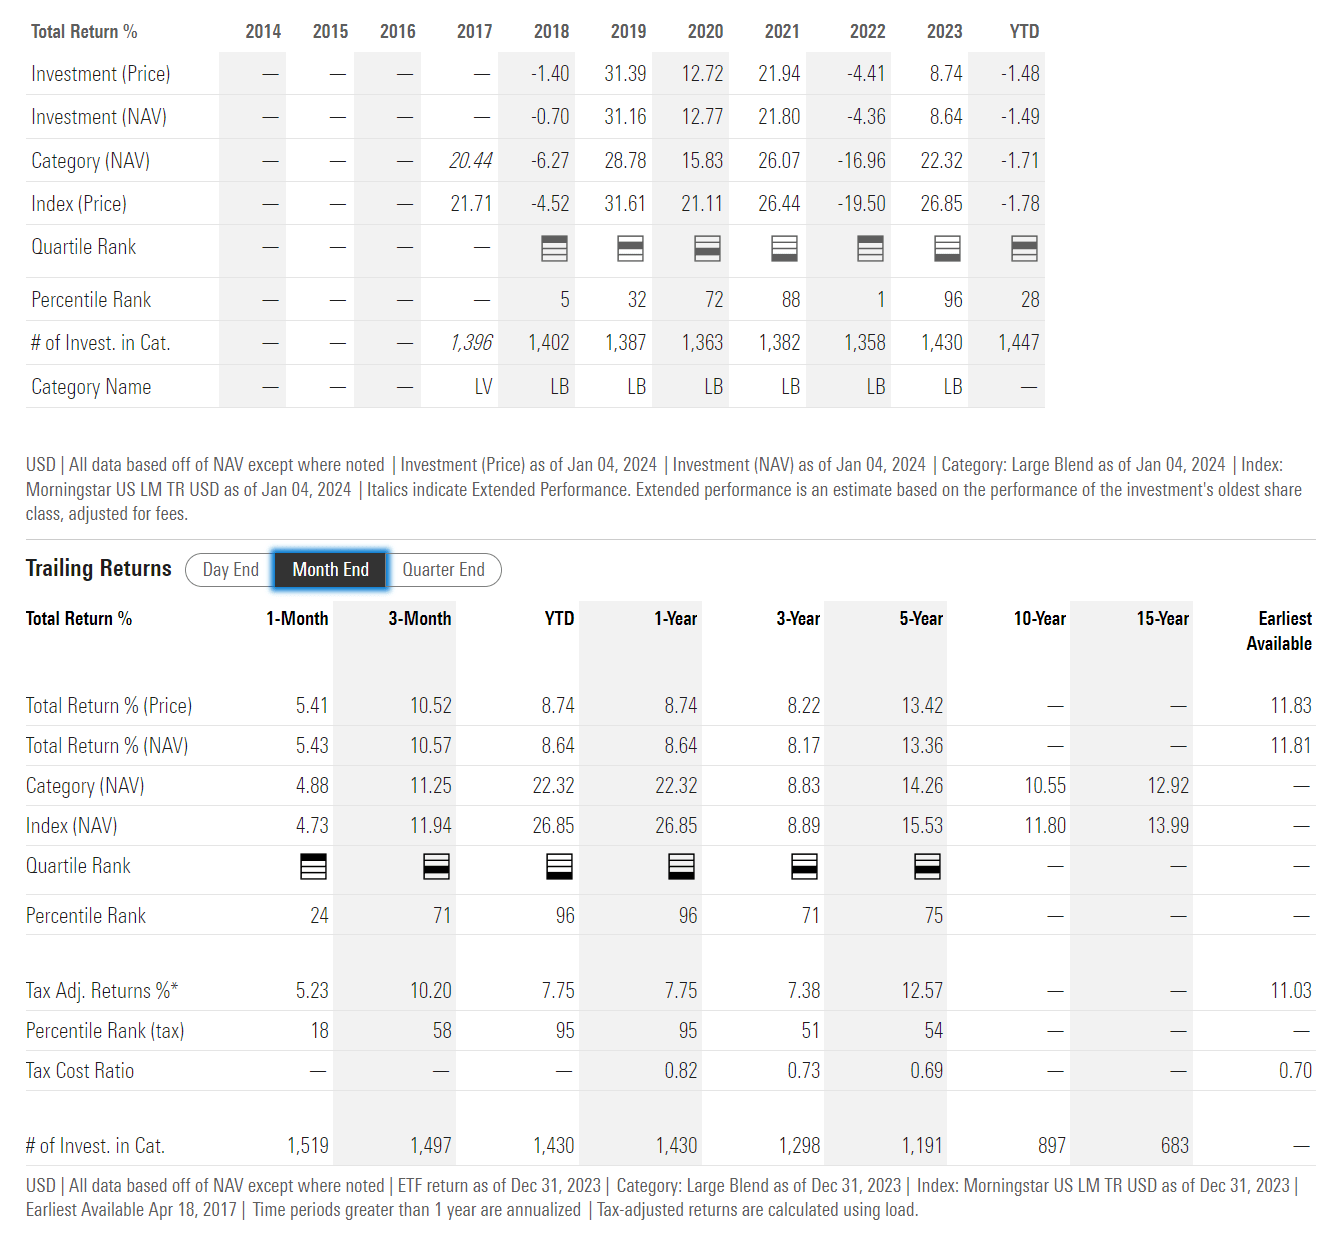
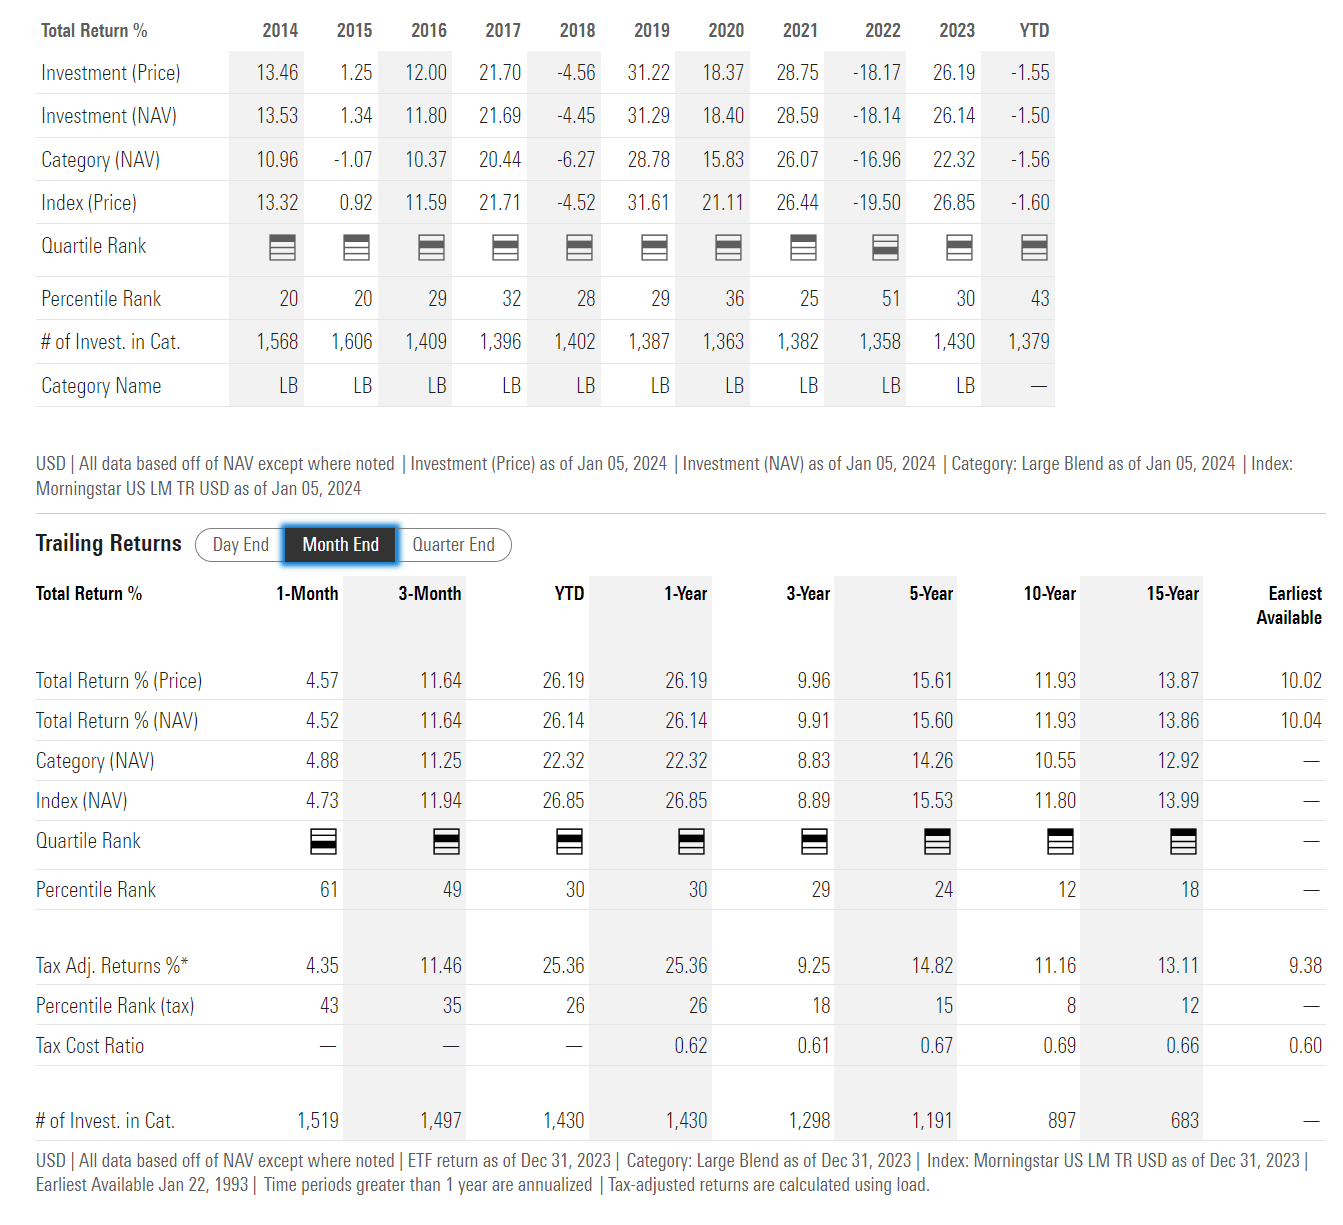
VSDA's relatively weak 2023 performance negated a strong 2022, when the VSDA ETF lost only 4.4% compared to a 18.1% drawdown for the SPY ETF.
How should investors think about VSDA's focus on dividend growth stocks, and potential returns for the strategy going forward?
Dividend Growth As An Investment Factor
Stocks with a history of dividend growth are usually associated with high quality earnings and strong balance sheets, since financial strength is required to pay growing dividends. On the other hand, high dividend yield may not be a sign of quality, as companies may go into debt to maintain its dividend to attract investors.
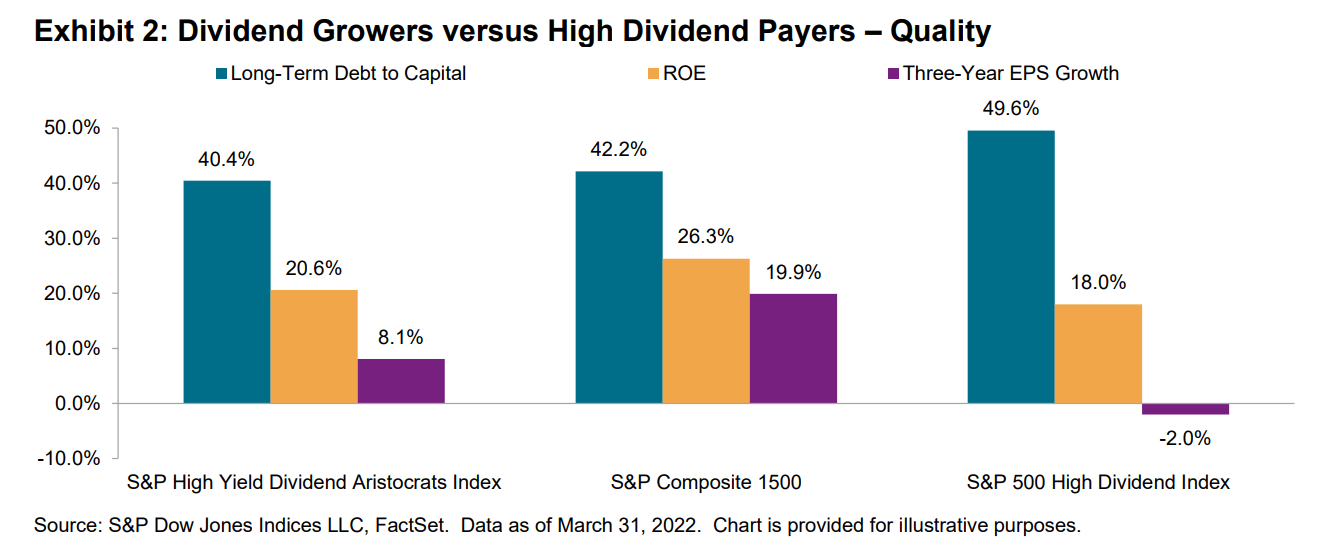
In fact, according to research from S&P Global , stocks with a history of growing dividends ("S&P High Yield Dividend Aristocrats Index") tend to have lower debt levels and higher earnings growth compared to purely high dividend yielding stocks ("S&P High Dividend Index") (Figure 7).
Figure 7 - Dividend growers vs. high dividend payers (S&P Global)
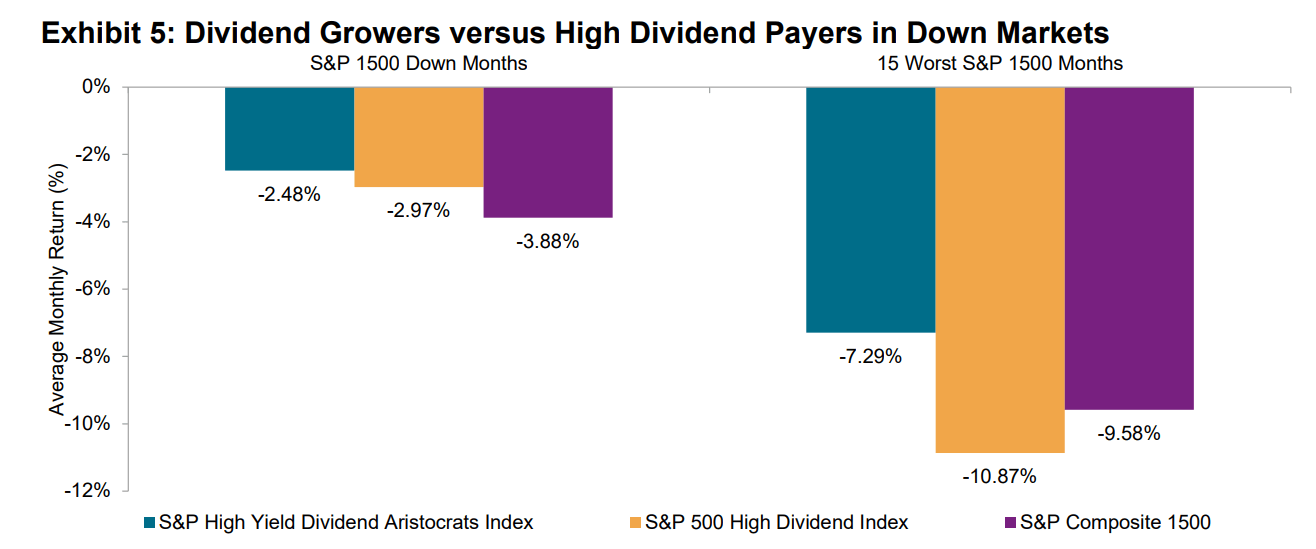
Due to their superior balance sheets and perceived quality, high dividend growers tend to outperform during down months in the equity markets. In fact, their outperformance is especially large when we focus on the 15 worst historical months, with the Dividend Aristocrats outperforming the markets by 229 bps on average, and high yielding stocks by 348 bps on average (Figure 8).
Figure 8 - Dividend growers tend to outperform in bad markets (S&P Global)
We definitely saw this outperformance in action in 2022, when the VSDA ETF only declined by 4.4% compared to 18.1% by the SPY ETf.
However, as we have written in prior articles , single factor performance ebb and flow, depending on the state of the business cycle and market sentiment. When the markets are fearful and 'risk off', high quality factors like Dividend Growth will outperform, like how VSDA outperformed in 2022. But the corollary is that when markets are optimistic and 'risk on', Dividend Growth can underperform, like VSDA has underperformed in 2023.
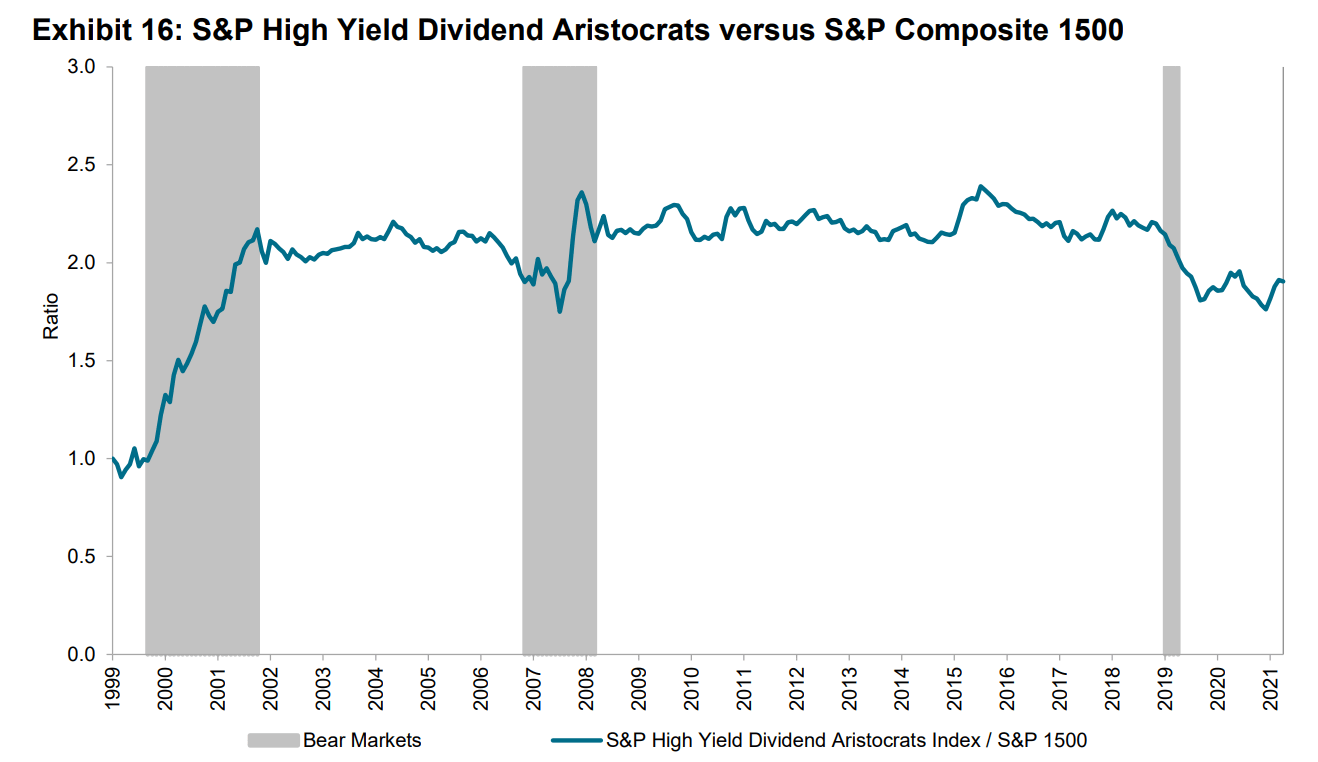
Outside of long bear markets, there is no clear evidence that a high dividend growth strategy will consistently outperform the markets (Figure 9).
Figure 9 - Long term relative performance of high dividend growers (S&P Global)
For investors, investing in a high dividend growth strategy may be a test of one's patience, as the strategy's outperformance only occurs during infrequent bear markets. In the intervening times, investors may become frustrated with lagging performance.
Conclusion
The VictoryShares Dividend Accelerator ETF provides investors exposure to stocks with high dividend growth rates. Historically, high dividend growth is a high quality factor that outperforms during bear markets, and the VSDA ETF certainly outperformed in 2022.
However, as a single-factor fund, the VSDA ETF suffers from volatile relative performance, as single factors ebb and flow over time. Outside of bear markets, it is unclear whether the high dividend growth factor will consistently outperform. Unless one can foresee bear markets with accuracy, investing in the VSDA ETF may try one's patience as it can underperform for long periods of time. I rate the VSDA ETF a hold.
For further details see:
VSDA: Focuses On High Quality Dividend Growth Factor