VIG - VSDA: Is This Dividend Accelerator ETF True To Form?
Summary
- VSDA tracks a propriety Index, selecting 75 U.S. stocks with sustainable dividend growth and stable earnings patterns. Annual fees are 0.35% and the ETF has $253 million in AUM.
- The Index considers a variety of common-sense screens, including dividend growth and consistency, return on equity, price-earnings ratio, and net income stability.
- Unfortunately, the current portfolio is unappealing. Investors can get everything VSDA purports to offer with low-cost alternatives like VIG and SCHD.
- In particular, SCHD offers a net dividend yield that's 1.50% higher and trades at a four-point discount on forward earnings. That's the path dividend growth investors should take instead.
- I'm rating VSDA a hold because, despite all the complex screening, the resulting portfolio is the definition of average in the dividend ETF space.
Investment Thesis
Today, I will initiate coverage of the VictoryShares Dividend Accelerator ETF ( VSDA ), one of the few dividend ETFs I've yet to write about on Seeking Alpha. With a 1.91% trailing dividend yield but an explosive 18.78% three-year dividend growth rate, VSDA appears to be as advertised. However, as this article will argue, there's no advantage going with it over more established and cheaper ETFs like the Vanguard Dividend Appreciation ETF ( VIG ) or the Schwab U.S. Dividend Equity ETF ( SCHD ). This article will discuss VSDA's overall strategy, how its fundamentals are lacking, and why its historical dividend growth is unlikely to continue.
ETF Overview
Strategy
On its website , VictoryShares indicates investors should choose VSDA to address a need for potentially higher income through sustainable dividend growth increases. Furthermore, it aims to select high-quality U.S. stocks with stable earnings patterns, ideally reducing the earnings risk we've seen lately.
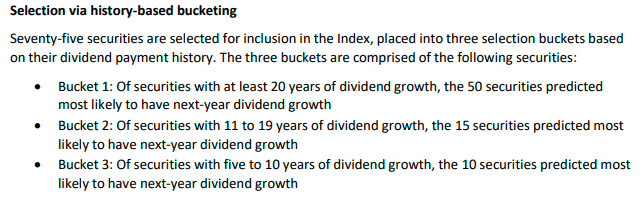
VSDA's tracked Index, the Nasdaq Victory Dividend Accelerator Index, was designed to select 75 securities based on their durations of past dividend growth and predicted likelihood of continued dividend growth. Ten years of data, if available, are used, with the following metrics used:
- dividend yield
- return on equity
- return on invested capital
- pre-tax income to debt ratio
- five-year dividend growth consistency
- price-earnings ratio
- gross margin
- five-year net income stability
- five-year sales stability
- five-year trend in return on equity
- cash to market capitalization ratio
- three-year monthly price volatility
- company market capitalization
- consecutive years of dividend growth
If a data point is missing, the median for that company's industry is used instead. Real Estate securities are excluded, and the Index follows a unique selection process that places additional emphasis on past dividend growth.
Finally, the Index is modified dividend-yield and income stability-weighted, as described below. While the yield factor is self-explanatory, how the Index evaluates stability is unclear. The metrics described above are all important, but it's hard to tell which ones are the most favored. My hunch is that valuation is not a key screen since VSDA trades at a relatively high forward price-earnings ratio for a dividend ETF.
VictoryShares
Sector Exposures and Top Holdings
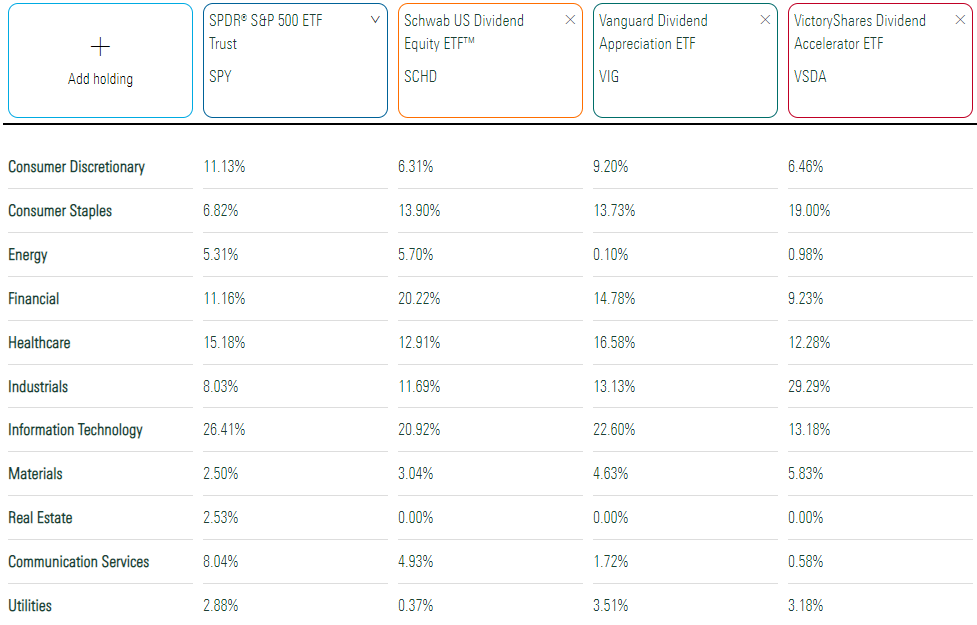
VSDA's sector exposures are listed below alongside VIG, SCHD, and the SPDR S&P 500 ETF ( SPY ). SCHD is a nice benchmark for dividend growth investors, as it's also a reasonably focused portfolio with 100 holdings, but its criteria are more transparent, and the ETF has a much lower 0.06% annual fee.
I'm surprised to see VSDA's Industrials exposure at 29.29%. Though the Index places individual security constraints at 4%, there doesn't appear to be one at the sector level. VSDA also overweights Consumer Staples at 19.00% but has much less Technology exposure than these three peers.
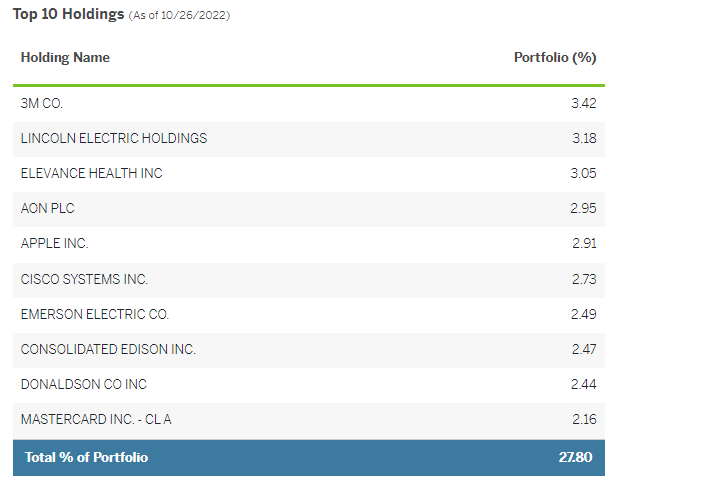
VSDA's top ten holdings are below, covering 27.80% of the portfolio. This coverage is insufficient for analysis purposes, and I'll be extending my analysis to VSDA's top 25 holdings later. However, some familiar names stand out, including 3M ( MMM ), Apple ( AAPL ), and Mastercard ( MA ). These companies have strong dividend growth histories but diverge on total return. 3M, currently embattled in legal issues that will likely take many years to resolve, is down 31% this year and has made negligible $0.04 per year increases to its annual dividend since 2021. Meanwhile, Apple and Mastercard have 8.45% and 17.37% five-year dividend growth rates and appear to be on more solid footing, as reflected in their superior returns YTD.
Performance and Dividend History
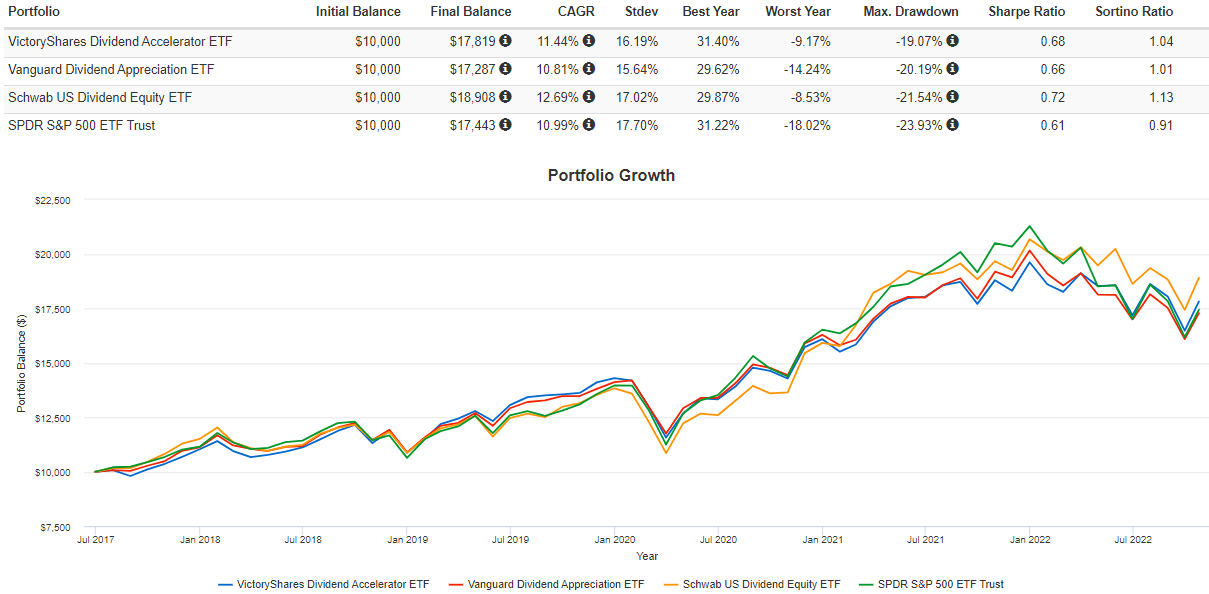
VSDA has performed well since its inception, gaining an annualized 11.44% compared to 10.81%, 12.69%, and 10.99% for VIG, SCHD, and SPY, respectively. It was slightly less volatile than most and experienced a lower max drawdown than all three peers. The 19.07% figure in the table below was its Q1 2020 loss. It also fell 16.02% from January to September 2022, but like most U.S. equity ETFs, it is up sharply in October.
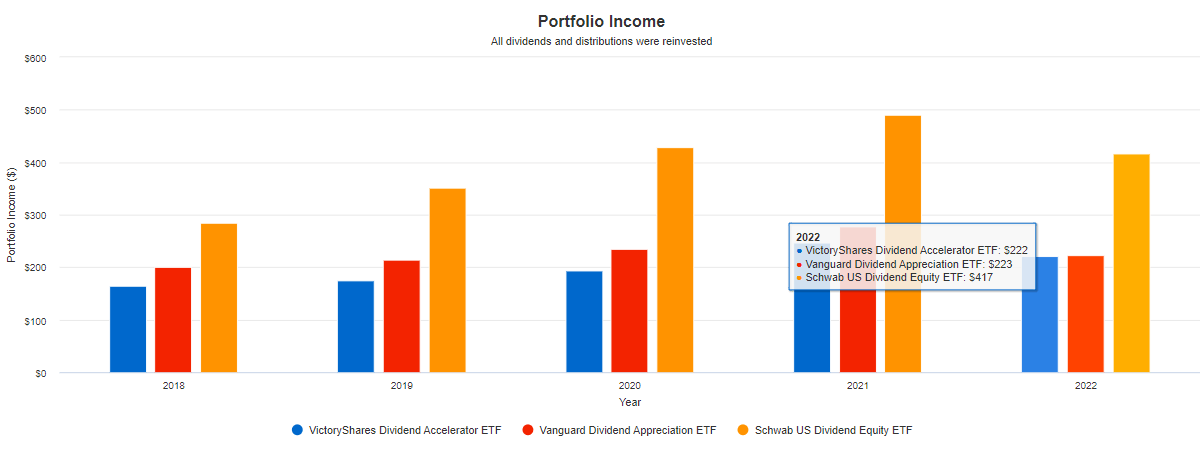
While its track record is solid, VSDA wants to be known for its strong dividend growth. According to Portfolio Visualizer, a $10,000 investment in January 2018 would produce a portfolio income of $222 through this year's first ten months. Since it's a monthly payer, we can forecast $266 in total or a 2.66% yield on cost. It's not bad, but the low starting yield means dividend growth will need to be substantial to catch up with an ETF like SCHD.
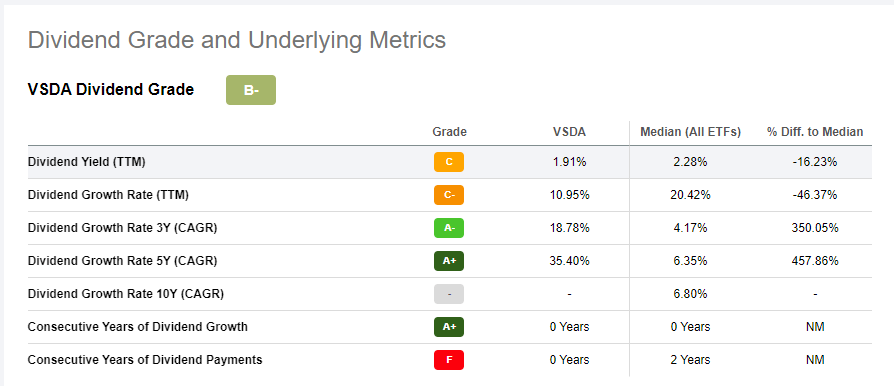
Seeking Alpha gives VSDA a "B-" Dividend Grade, but I want to clarify a few things before moving on. First, VSDA's 35.40% five-year dividend growth rate is inflated, given how the ETF hasn't paid dividends for the six full years required for the calculation. The best we can do is look at the trailing twelve-month dividends as of April 2018 ($0.4654) and compare them to October 2022's trailing dividends ($0.7663). Based on these 53 months, VSDA has an 11.95% dividend growth rate. This calculation is more in line with the growth shown in the Portfolio Visualizer graph.
Second, I think the overall grade is hurt by its "F" Grade on consecutive years of dividend payments. VSDA has paid dividends every month since May 2017, and besides, nearly all equity ETFs pay a dividend, so this grade only reflects how long an ETF has been trading.
VSDA Analysis
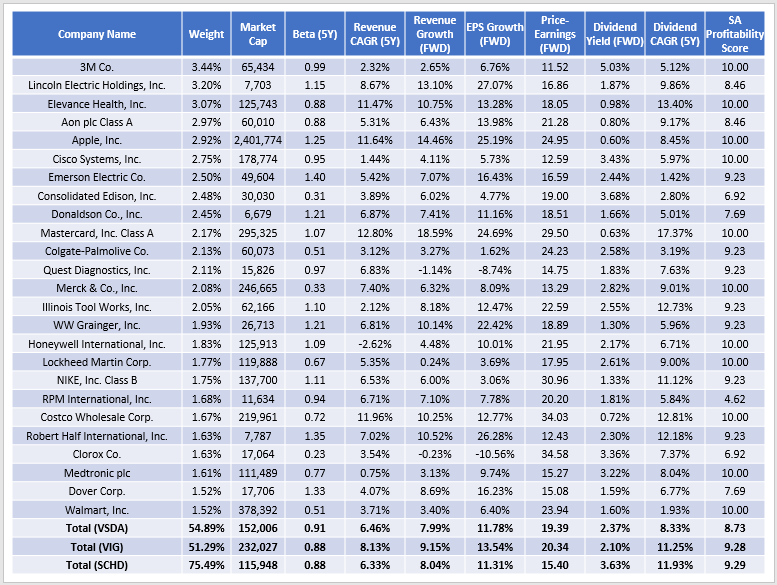
I mentioned how I believe VSDA is similar in concept to VIG. The table below, which highlights selected fundamental metrics for VSDA's top 25 holdings, confirms this. However, I believe that VIG and SCHD are superior, each in their own way. Look through these metrics, and I'll offer my thoughts afterward.
VSDA has a weighted-average market capitalization of $152 billion, $80 billion less than VIG but $37 billion greater than SCHD. A key reason is Apple, whose $2.4 trillion market capitalization is enough to skew any portfolio. Without that company, VSDA's market capitalization would be just $84 billion.
All three ETFs have similar five-year betas, indicating an average level of downside protection for a dividend ETF. VSDA shares a comparable sales and earnings growth level with SCHD but is 1-2% below VIG, which is its closest peer from a dividend yield perspective. VSDA's constituents have a gross 2.37% dividend yield compared to 2.10% for VIG, but after adjusting for fund expenses, investors will likely net something closer to 2%. Notably, VSDA's constituents have the weakest five-year dividend growth rate (8.33%), suggesting the 11.95% historical figure I calculated earlier may be a bit generous going forward. In contrast, VIG and SCHD's constituents have double-digit five-year growth rates. In the case of SCHD, it also features a substantially higher 3.63% gross dividend yield.
VSDA's problem is that it doesn't stand out. Investors looking for downside protection can choose VSDA or 36 other dividend ETFs with a lower five-year beta, including VIG, SCHD, DGRW , and VYM . For capital appreciation, 29 dividend ETFs have superior estimated earnings growth. On valuation, VSDA's 19.39 forward price-earnings ratio is the eighth worst out of 65, only marginally beating out DGRW, VIG, and the ProShares S&P 500 Dividend Aristocrats ETF ( NOBL ). Finally, its yield is paltry compared to what ETFs like SCHD and VYM offer. After analyzing VSDA's fundamentals, I can only conclude that it's unappealing in the crowded dividend ETF space.
Investment Recommendation
VSDA is based on a proprietary model designed to identify companies with sustainable dividend growth and stable earnings patterns. On its surface, it appears unique, but my fundamental analysis reveals that its current portfolio is only average at best. Investors can turn to VIG for better sales growth, earnings growth, and dividend growth for a similar dividend yield, downside protection, and valuation. Or, investors can accept the slower sales and earnings growth and instead opt for SCHD, which should offer a net yield of nearly 1.50% better and a four-point discount on forward earnings. In short, I don't recommend investors buy VSDA until there's a substantial change in its fundamentals, and I look forward to discussing this and other dividend ETFs with you in the comments section below.
For further details see:
VSDA: Is This Dividend Accelerator ETF True To Form?