VTI - VTI: September Has Been Worst Month To Own Stocks Last 5 Years
2023-08-30 22:47:38 ET
Summary
- September has historically been the worst month for owning U.S. stocks over the past five years.
- Economic concerns, rising interest rates this summer, a still inverted Treasury yield curve, and the upcoming restart of student loan payments could negatively impact consumer spending late in the year.
- The odds favor a potentially large equity market downturn during September-October, making it a risky time to own equities.
Statistically speaking, all other variables left out of the equation, September has been the worst month to own U.S. stocks over the last five years. In fact, 3 of 5 have all been huge downers during this month. Will this year prove any different?
While I like to be the contrarian in the room looking for reasons for something different than recent trends to appear in life, I am quite worried about this September's market outlook. The economy is sputtering for growth, long-term interest rates have risen sharply this summer, and student loan repayments are slated to begin on October 1st. So, consumer spending could hit the skids into the important Christmas retail sales season.
And, after a decent upmove in the stock market during 2023, the odds may actually favor a breather in September-October, the seasonally worst months back-to-back to owns equities over the decades. As we end August, the highest long-term 12-month rating I can put on the Vanguard Total Stock Market Index Fund ETF ( VTI ) is a Hold suggestion. Valuations remain high vs. the last 100 years of Wall Street history, interest rates are restricting credit creation, and our inverted Treasury yield curve for almost a year running is screaming a recession may begin soon. To boot, investor sentiment (especially in the leading Big Tech area) just reached levels associated with major stock market tops in July and early August.
When you put all the pricing variables together, expecting a large -10% or greater drawdown in stocks during September and possibly October is an outlook well backed by the facts. For traders and speculators, if you want a 6-week to 8-week rating on the general equity market direction, I am firmly in the Sell camp.
Seasonal September Correction
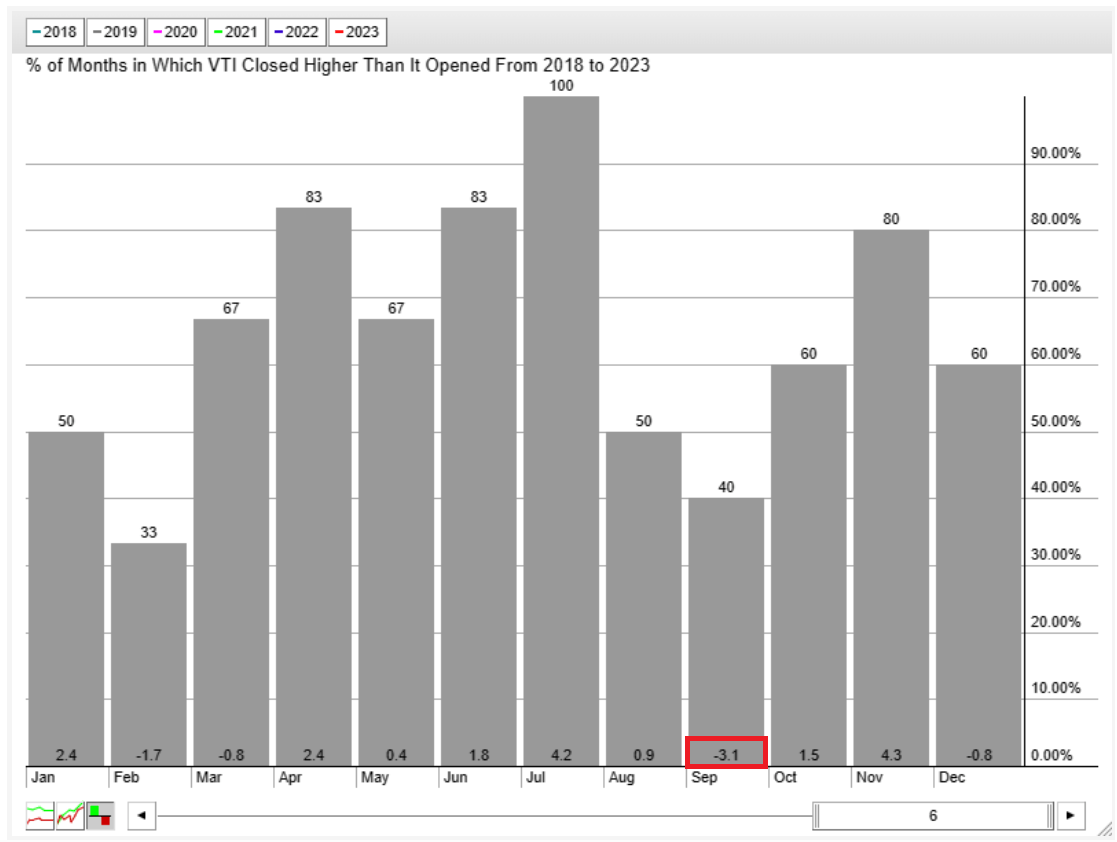
For VTI specifically, the last five September's have averaged a -3.1% loss, the worst of any month during the calendar year.
StockCharts.com - VTI, Average Monthly Returns, Since 2018
In fact, had you sold on August 31st each year, you could have repurchased a position in VTI at far lower quotes sometime in September of October 100% of the time, from 2018-2022 (5 years).
I have drawn the daily closing charts for each year since 2018 below, focused on September into October. Measured from a sell on August 31st to the eventual bottom price of either September or October, VTI's mean average loss was -6.5%.
2018
YCharts - VTI, Daily Price Closes, September 1st to October 30th, 2018
2019
YCharts - VTI, Daily Price Closes, September 1st to October 7th, 2019
2020
YCharts - VTI, Daily Price Closes, September 1st to October 29th, 2020
2021
YCharts - VTI, Daily Price Closes, September 1st to October 4th, 2021
2022
YCharts - VTI, Daily Price Closes, September 1st to October 11th, 2022
Technical Chart
One of the things that has bothered me about the summer rally in Big Tech stocks is interest outside of this group has been clearly lacking. The Russell 2000 index of smaller cap names is barely ahead of April levels as an example of the bad-breadth advance of late. I even wrote a bearish story on this idea in late May here , which admittedly proved a few months early for exact top tick timing (pumped by NVIDIA AI euphoria).
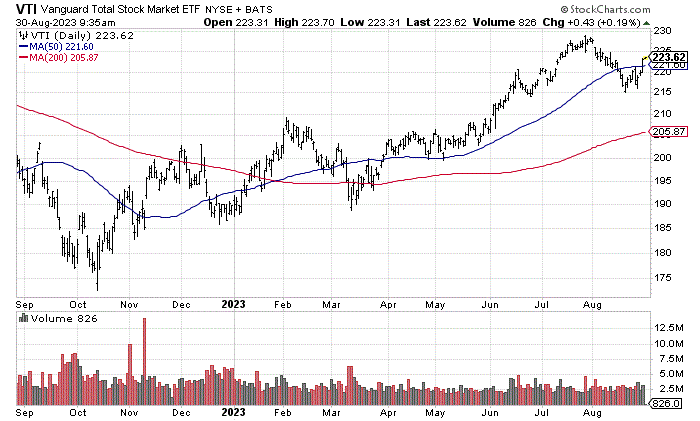
Second, major tops are usually a low trading volume affair. On the 12-month VTI chart below, we can review how September-October 2022 daily volume numbers ran about TWICE current August 2023 levels. In addition, percentage price moves each session today are experiencing less than HALF the intraday swings of September-October 2022, which marked an important tradable bottom last year.
I have mentioned in a variety of articles over the past 10 years on Seeking Alpha, general stock market peaks typically experience lower trading volume than normal, as buying power fades.
Another worrying piece of data is the "meat portion" of bear market declines historically occurs after a price rebound retracement 4 to 5 weeks following the final price top. That's exactly where we are sitting for time cycles going into September, assuming the late July numbers were the best readings for 2023! So, I would not be surprised if the next month or two witness a big downer for price on Wall Street.
StockCharts.com - VTI, 12 Months of Daily Price & Volume Changes
Final Thoughts
When you consider many of the wildest Wall Street swoons have occurred during September and October, including the 1929 and 1987 stock market crashes, reducing your equity exposure now may turn out to be a super-smart risk-adjusted move (especially in non-taxable accounts like IRAs and 401Ks).
We may be setting up for another rotten span to own U.S. equities over the next month or two. I know some pundits are predicting an all-out stock market crash. While I think the odds are exceptionally elevated for such an event, mainly from the massive 2-year rise in interest rates choking liquidity in the financial markets and economy, I am suggesting a more regular -10% to -15% correction is about to unfold.
Of course, a good news resolution of the Russia/Ukraine war, or a long-term agreement to avoid conflict between China/Taiwan, or a dramatic fall in interest rates (in the event of a rather unlikely collapse in commodities) could fuel one more upmove on Wall Street into early 2024. However, I personally feel the odds of each are very remote, at best.
For sure, risk-free cash yields of 5%+ today are enormously attractive, assuming bond and stock pricing remain under pressure. A stagflation environment is still a risk where the economy cools into recession, but inflation doesn't slide back under 3% next year. This scenario would be something of a worst-case scenario for business valuations, especially the growth kind found in the Big Tech area of Wall Street. I keep writing bearish articles on Big Tech this summer because this sector should suffer most in price under a stagflation outcome.
We are not going back to easy money credit conditions from the Federal Reserve, until inflation is tamed and/or a recession hits hard. And, if a recession is next, you definitely do not want to own an overvalued U.S. stock market. Food for thought anyway.
Thanks for reading. Please consider this article a first step in your due diligence process. Consulting with a registered and experienced investment advisor is recommended before making any trade.
For further details see:
VTI: September Has Been Worst Month To Own Stocks Last 5 Years