VTI - VTI: Total Market Beholden To Tech Bubble
2023-07-05 23:42:38 ET
Summary
- The Vanguard Total Stock Market ETF is now almost as exposed to the US tech bubble as the Vanguard S&P 500 ETF, due to the outperformance of mega-cap tech stocks.
- The VTI's valuations are extremely high compared to the small and mid-cap markets, trading at a 48% premium to the S&P 400 Mid-Cap Index and a 40% premium to the S&P 600 Small Cap Index.
- Rising inflation volatility and corporate bond yields make the case for owning the ETF worse than a year ago.
The Vanguard Total Stock Market ETF ( VTI ) tracks the total investable US equity market and historically been much less dependent on the performance of any single stock compared with the Vanguard S&P 500 ETF ( VOO ). However, the outperformance of mega cap tech stocks over recent years leaves the VTI now almost as exposed to the US tech bubble as the VOO. As I argued in August last year , the VTI faces a lost decade due to expensive valuations and weak growth prospects, and while valuations have improved somewhat over the past year, rising inflation volatility and corporate bond yields make the case for owning the ETF even worse than it was a year ago.
Increasingly Exposed To Tech Stocks
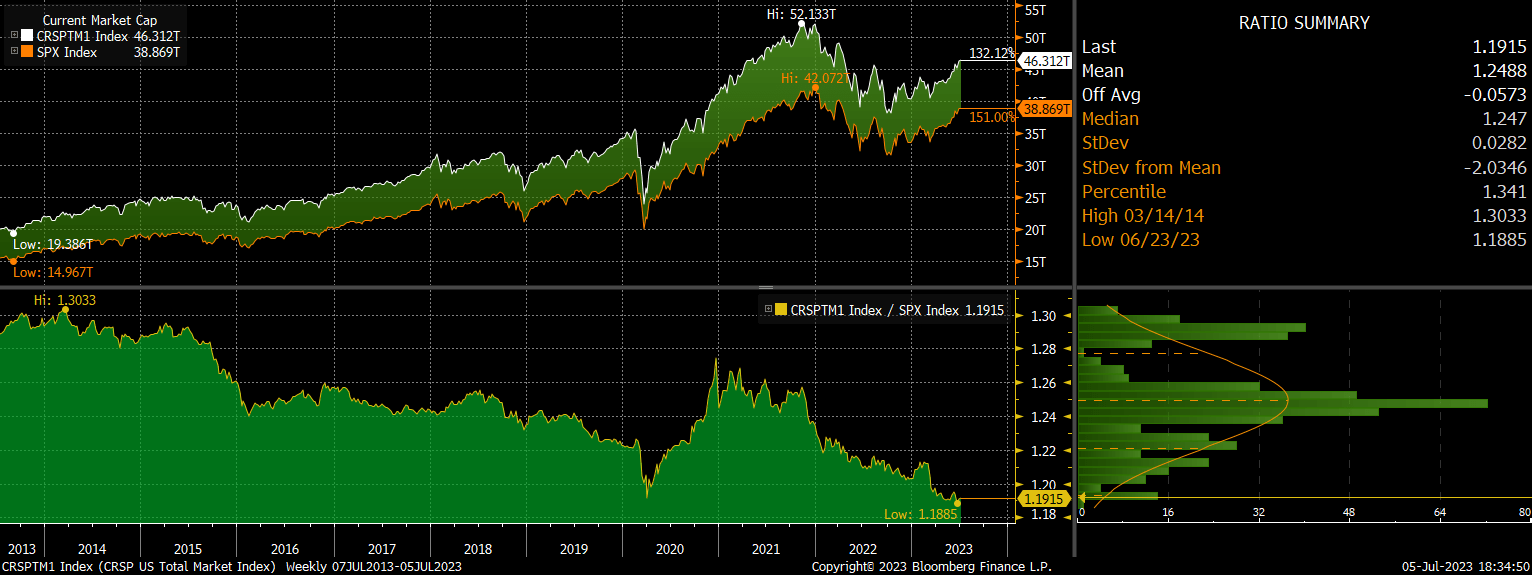
The VTI tracks the performance of the CRSP US Total Market Index which measures the total investable US equities market. While the ETF has a similar composition as the VOO, it also included small- and mid-cap companies meaning the index market capitalization is higher than that of the S&P 500. However, the outperformance of large cap stocks has meant that the total market index market cap is now just 19% higher than the S&P 500, compared with almost 30% a decade ago. This leaves the VTI almost as exposed to the performance of mega cap tech stocks as the S&P 500 itself. For example, the top 7 tech stocks make up 23% of the index, just below the 27% figure for the VOO.
Total Market Capitalisation Vs SPX (Bloomberg)
Extremely Overvalued Relative To The Average Stock
The rally in tech stocks has resulted in the VTI trading at a significant premium to the average large cap US stock. The chart below shows the PE ratio of the VTI against that of the equally-weighted S&P 500 index, with the current premium of 24% only higher during the Covid recession. The VTI's dividend yield is also 0.5% below that of the median S&P 500 company.
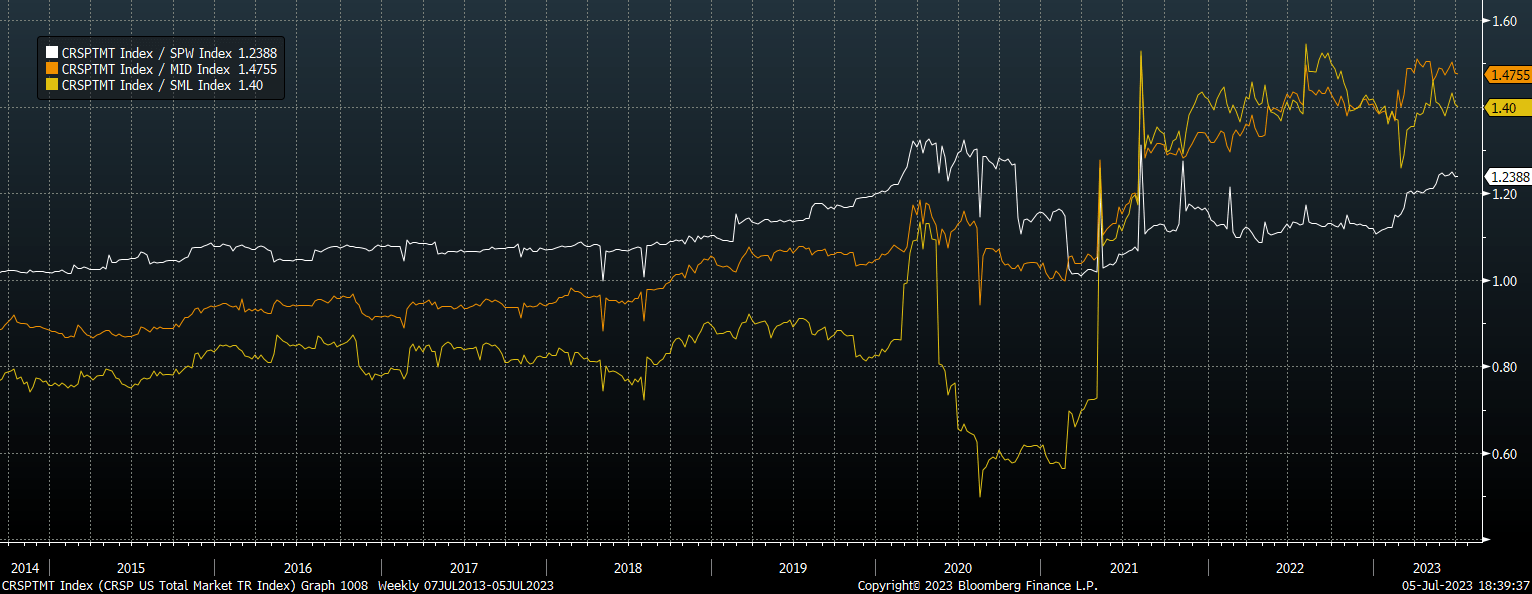
PE Ratio Of VTI Vs Equal Weighted SPX, MID, and SML (Bloomberg)
The VTI's valuations are even more extreme when compared to the small and mid cap markets. The CRSP Total Market Index trades at a 48% premium to the S&P400 Mid Cap Index and a 40% premium to the S&P600 Small Cap Index. This is particularly noteworthy given that small and mid caps have typically traded at a premium to large cap stocks due to their faster growth trajectory. The high weighting of tech stocks means that the VTI does not give enough exposure to reasonably small and mid cap stocks, and is set to track the performance of tech stocks even more closely than it has in the past.
Rising Inflation Volatility And Junk Bond Yields Suggest Fair Value Is Much Lower
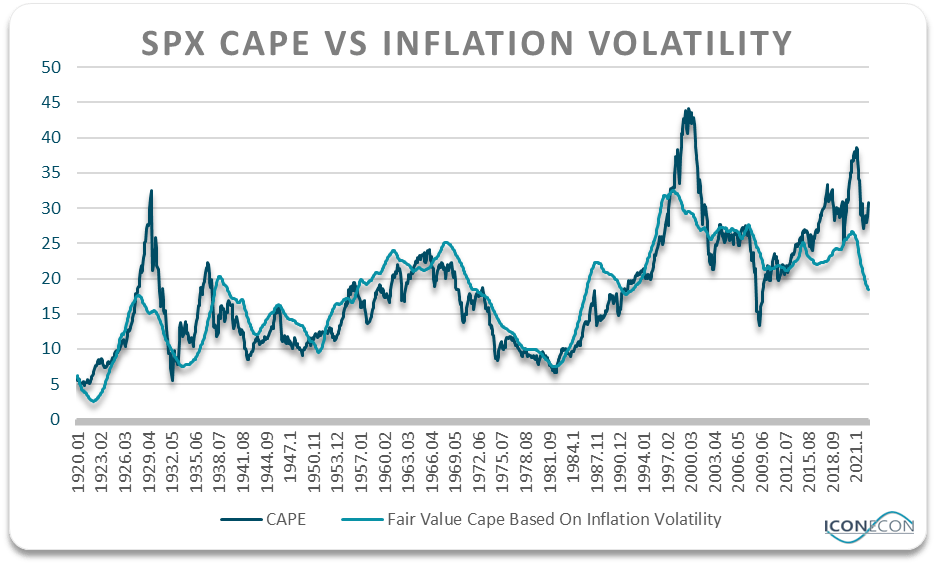
When I first wrote about the VTI in May 2021 I argued that low interest rates did not justify the extreme valuations that prevailed at the time and that rising inflation would burst the market bubble. There is a very strong correlation between US equity valuations and the volatility of inflation, with stocks tending to become cheaper when inflation rises or falls sharply. While we did see some contraction in the VTI's valuation in 2022 as inflation volatility rose, it has since diverged further with its fair value on this metric as shown below. The cyclically adjusted PE ratio is back above 30x, while its fair value sits just above 18%.
Inflation volatility measured using squared standard deviation from 2.0% (Bloomberg, Author's calculations)
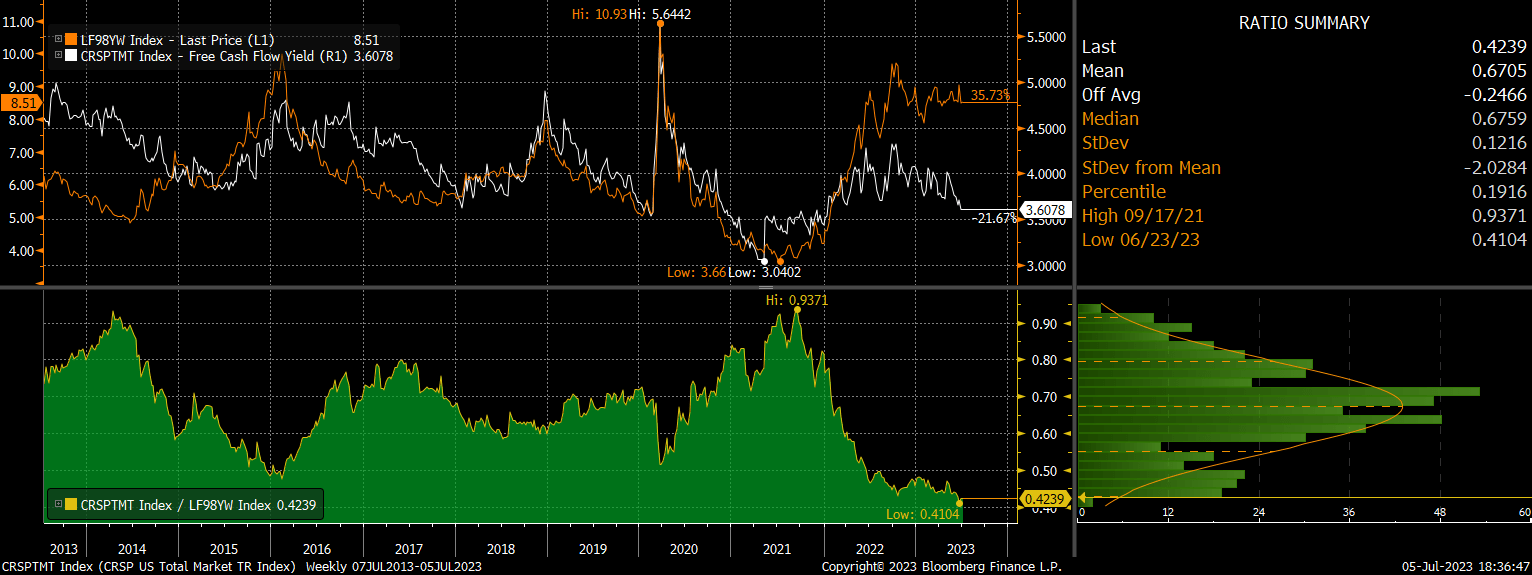
I also noted in 2021 that low bond yields only justify high valuations in theory, having actually shown a positive correlation with equity valuations more often than a negative one. Corporate bond yields are much more important for equity market valuations than US Treasury yields. The strong relationship between the earnings yield on the VTI and high yield US corporate bond yields is shown below. In May 2021 the VTI's FCF yield was on par with the yield to maturity on the Bloomberg high yield bond index, but after a surge in corporate bond yields the VTI's FCF yields less than half of the high yield bond yield.
VTI FCF Yield Vs High Yield Corporate Bond Yield (Bloomberg)
Unlike two years ago, there are several US equity and bond markets that are now trading at outright undervalued levels and priced to generate significant real returns. The case for owning the VTI is therefore even weaker now than it was at its 2022 peak.
For further details see:
VTI: Total Market Beholden To Tech Bubble