VTI - VTI: U.S. Bull Move In 2023 Running Out Of Gas (Technical Analysis)
2023-04-24 18:12:22 ET
Summary
- Low trading volume in the Vanguard Total Stock Market ETF over the last 8-10 weeks could be a warning sign of an impending price reversal lower.
- Similar low-volume, low-volatility periods have marked tops in many ETFs focused on general equity U.S. holdings over the years.
- With VTI still trading under its 2-year moving average, any major bearish turn in price could quickly snowball into a -20% or greater drawdown.
I have mentioned in past Seeking Alpha articles over the years that many (but definitely not all) bull moves in sector and overall market ETFs end when trading volume dries up. One product, the Vanguard Total Stock Market Index Fund ETF ( VTI ), has a decent track record of reaching peaks when trading volume disappears. Unfortunately, the last 8-10 weeks have outlined the weakest net buying interest since late 2019, just weeks before the 2020 COVID pandemic selloff hit.
For sure, there exists a long list of reasons to be wary of general market ETFs right now. Rising interest rates to combat sky-high inflation were the main excuse for last year's horrible performance from U.S. financial securities. And, the likelihood of a recession in the second half of 2023, with declining corporate profits overall, is another excuse to tread cautiously with your buying. The still wicked 40-year high spread in the Treasury yield curve is screaming at investors that credit conditions will tighten rapidly. The March bank runs on deposits should be warning enough that future trouble for Wall Street pricing is a here-and-now worry.
The Bearish Pattern
In terms of trading momentum, many market-centric ETFs have seen trading momentum and volume pull back sharply following the strong January period. Of particular concern for me is buying interest in some of the less popular trading products like VTI has really tailed off in March-April. Why is this troubling?
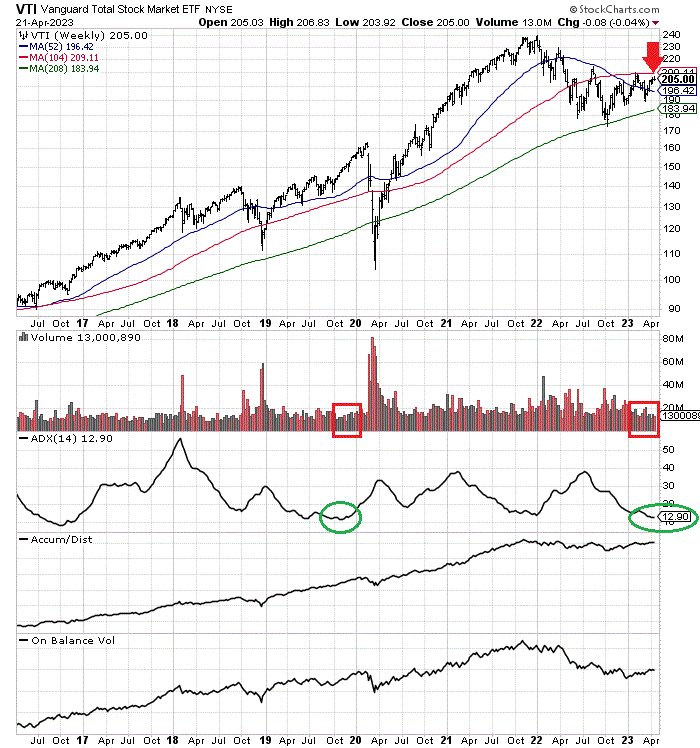
ETFs on whole sectors or markets often peak in price after a span of slow trading. The "fuel" to generate higher prices has basically been exhausted. Below, I have drawn a 7-year chart of weekly trading action.
The first thing you will notice is the price has been fluctuating under its 2-year moving average since June 2022, and the January bounce higher ended right at this indicator. Today's approximate $210 price for the MA is now major overhead resistance, marked with a red arrow. To get over it, we may need a good news event like the end of the Russia/Ukraine war, or a Fed decision to quit the inflation fight. Both would reignite a move higher in U.S. stocks.
Second, I have boxed in red the ultra-low trading volume of March-April. The last time buying interest was this low occurred at the end of 2019 and the first few weeks of 2020. You can also review the low-volume periods of August 2022 and the summer to early fall of 2018 also experienced weak VTI volume, not confirming upmoves in price. Each of these instances was quickly followed by market declines of -15% to -20% in price.
Third, I have boxed in green the only other time on the chart 3-month volatility was as low as the current situation, namely Q4 2019. When we put together the subpar volume and volatility setup of April 2023, it's hard not to get a little nervous about a breakout in selling pressure soon. And, as bad news regarding the economy escalates, we will have excuse after excuse in the near future for investors to run for cover and move to cash or possibly bonds for more guaranteed returns.
StockCharts.com - VTI, Weekly Price & Volume Changes, Author Reference Points, Since April 2016
Overvaluation Problem
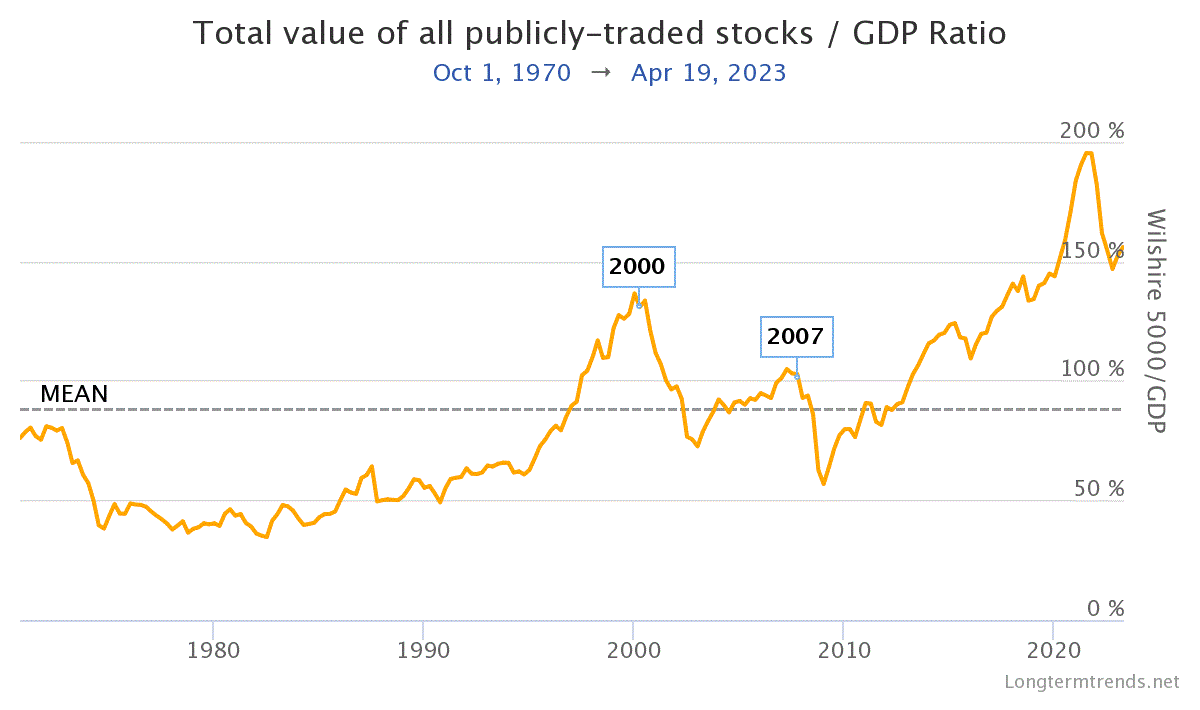
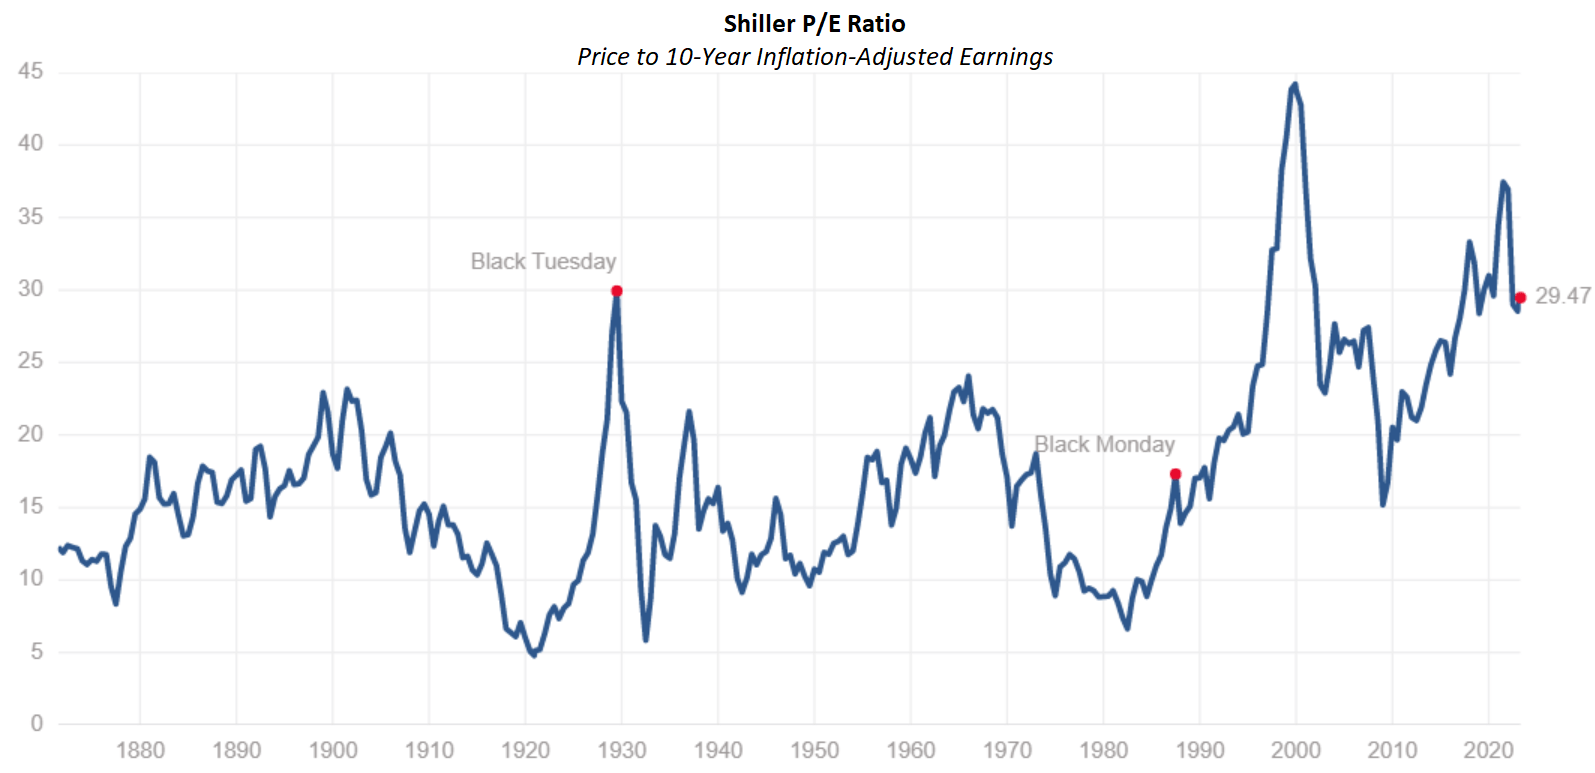
Besides the rotten trading momentum zigzag of late, I worry about the U.S. market's clear long-term overvaluation vs. GDP output (one of Warren Buffett 's favorite value indicators) or the 10-year inflation-adjusted Shiller P/E ratio for the S&P 500 index. Basically, even after the 20% market decline since January of last year, Wall Street's pricing of equities remains on a par with 1929 (before a stock market crash and economic Depression) and 1999-2000 (the infamous Dotcom technology bubble).
Longtermtrends.net - Total Wall Street Equity Worth vs. Trailing 12-Month GDP, Since 1970 Multipl.com - Shiller P/E Ratio for S&P 500, Since 1871, Estimated before 1957
Lastly, the relative valuation of the dividend yield vs. inflation remains one of the worst setups in modern times, on par with the year 2000 boom peak or 2008 going into the Great Recession banking crisis. If inflation does not fall from 5% YOY rates, the only way to rebalance dividend yields is through sharply higher dividend payouts (unlikely in a recession) or a material price decline for stocks. (I am using the SPDR S&P 500 ETF ( SPY ) for this stat as it has a longer trading history than VTI).
YCharts - Relative Dividend Yield for U.S. Equity Market (SPY) vs. CPI Inflation, Since 1995
Final Thoughts
My read of the whole Wall Street setup is another large selloff that makes logical sense, especially if stubborn inflation forces the Fed to tighten further into the summer months. For example, an unexpected spike in crude oil (or grains) could actually add considerable pressure for rising inflation rates again during the summer and second half.
What would change my mind? In terms of the current Sell rating for VTI, the weekly chart's 2-year moving average should not be breached to the upside. While a minor 3% upmove will not improve the long-term valuation argument to avoid U.S. stocks generally, a 3-month to 6-month zigzag in place or even slightly higher is not impossible. So, I would watch the $210 VTI price level closely in the coming weeks. A rise above $210 might force me into a Hold rating for a spell.
My market-weighting sentiment since August has been to keep stock market exposure limited, while focusing on company selection, as the best way to survive this multi-year bear phase on Wall Street. I personally hold about 60% in cash reserves (earning close to 5% annually), with another 25% invested in gold/silver/platinum metal assets that should benefit from flight-to-safety and eventual reflation monetary moves by the Federal Reserve. I do not recommend going heavily short U.S. equities, as the costs of holding such a position are quite elevated (either through expensive put option premiums or high brokerage margin loan rates).
Thanks for reading. Please consider this article a first step in your due diligence process. Consulting with a registered and experienced investment advisor is recommended before making any trade.
For further details see:
VTI: U.S. Bull Move In 2023 Running Out Of Gas (Technical Analysis)