VTI - VTI: What's Different From SPY And How We Use It
2023-10-12 21:11:44 ET
Summary
- The Vanguard Total Stock Market ETF is a core holding in our portfolio.
- A FAQ we receive from readers involves the differences between VTI and other market index funds, such as the SPDR S&P 500 Trust ETF (SPY).
- Our experiences tell us the key is to get the allocations right based on the relative valuation of bonds, equity, precious metals, etc.
- Exactly which fund you hold is of secondary importance. Although, there are a few considerations that made us favor VTI.
- Here we will detail these differences and also illustrate how we allocate VTI among different asset classes.
VTI or SPY?
The Vanguard Total Stock Market ETF ( VTI ) is our core equity holding and it has invited many questions from our readers. The questions came in various ways and today I will compile the answers to one of them in a more coherent way. The question essentially boils down to: why do we hold VTI rather than other market index funds such as the SPDR S&P 500 Trust ETF (SPY)?
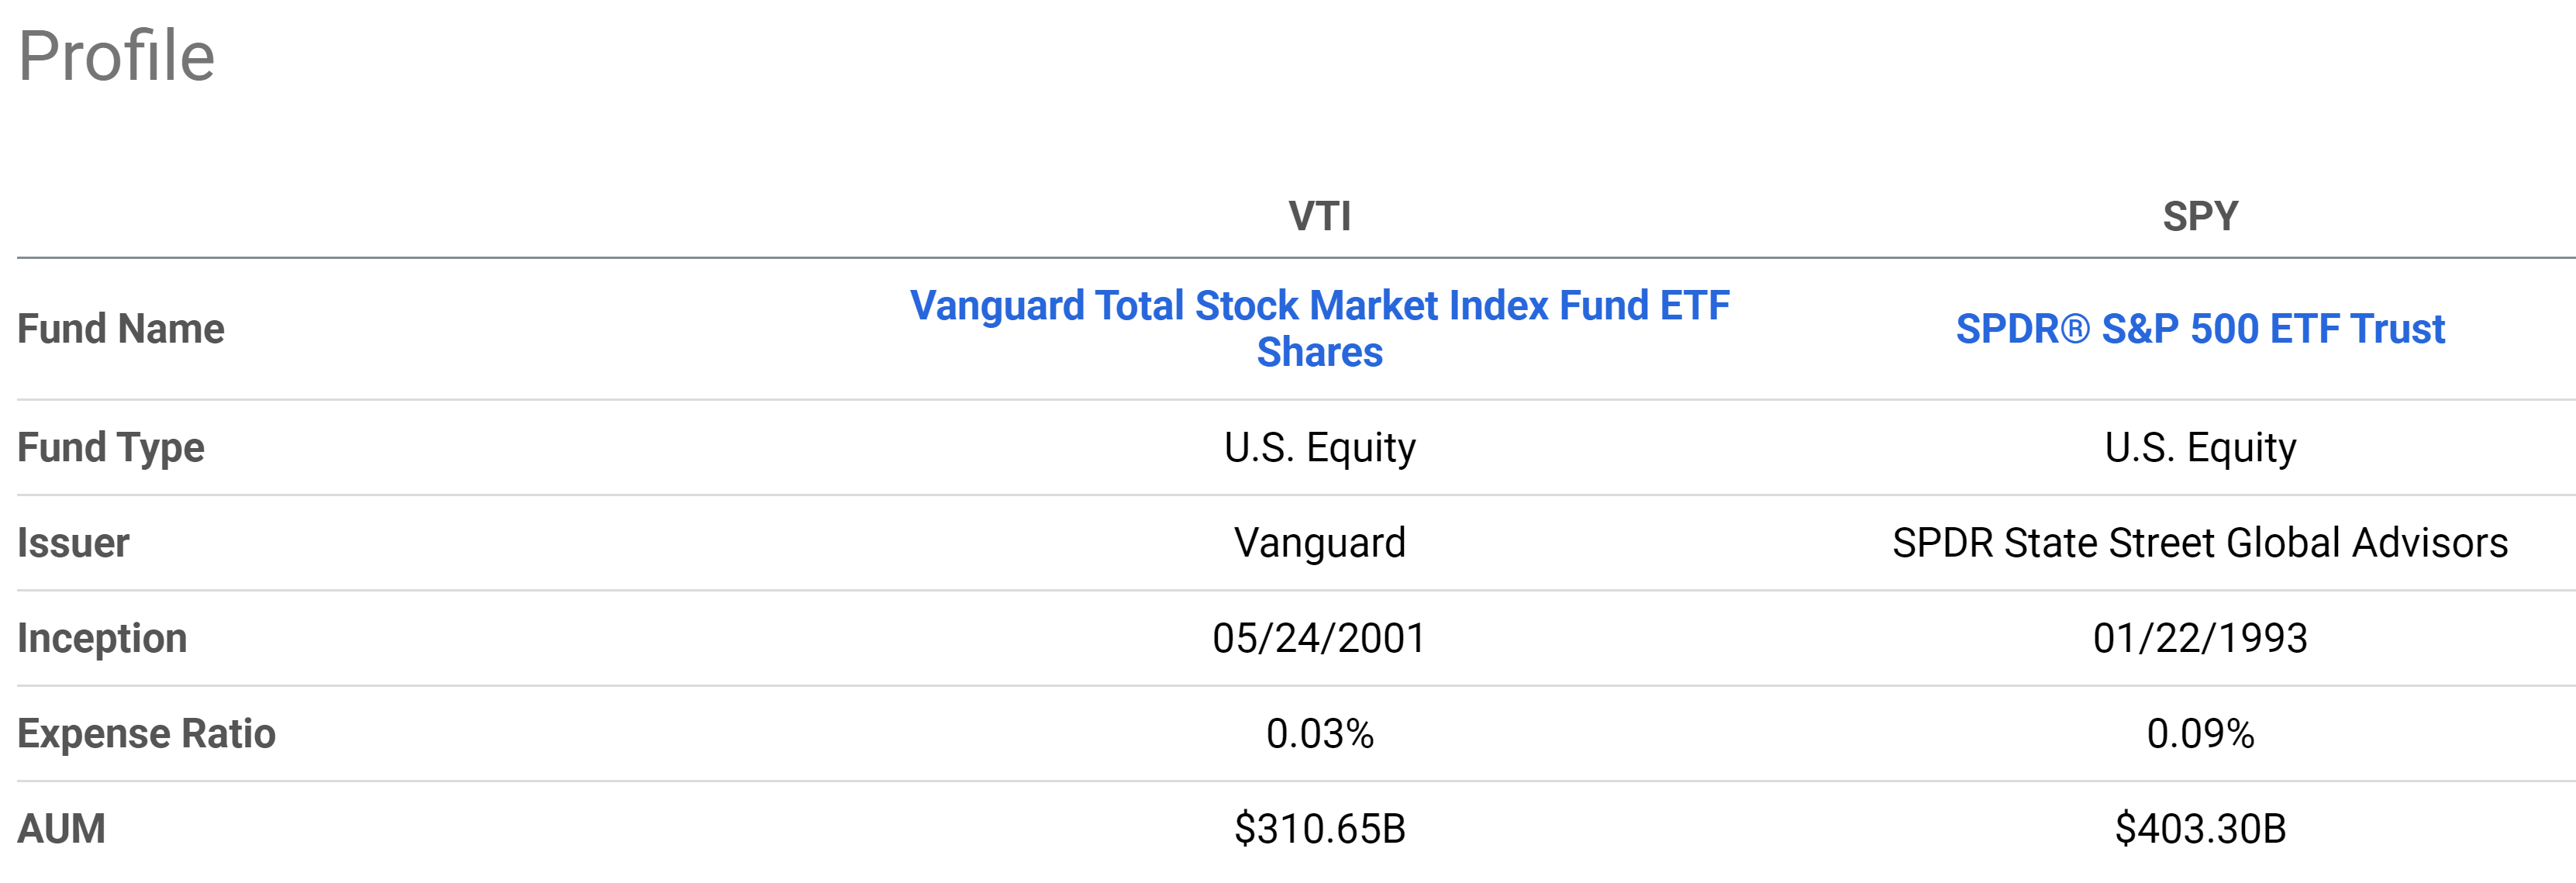
Our experiences tell us the key is to get the allocations right (and we have been dynamically allocating VTI among our assets for nearly two decades based on the relative valuation of bonds, equity, precious metals, etc.), and the exact ETF funds that you hold is of secondary importance. For buy-and-hold investors, long-term performance of passive index funds is largely determined by their fees. And VTI offers a small advantage on this front due to its rock-bottom 0.03% expense ratio (compared to SPY's 0.09%). Although more importantly, under current conditions, the valuation differences between VTI and SPY are at the largest level in about a decade as to be elaborated later. Combined with the lower fees charged by VTI, we feel VTI has a good chance of offering noticeably better performance in the years to come.
In the remainder of this article, I will detail the above differences between VTI and SPY, especially their valuation gap and due to their exposures. I will also illustrate how we allocated VTI dynamically among different asset classes.
VTI – basic information
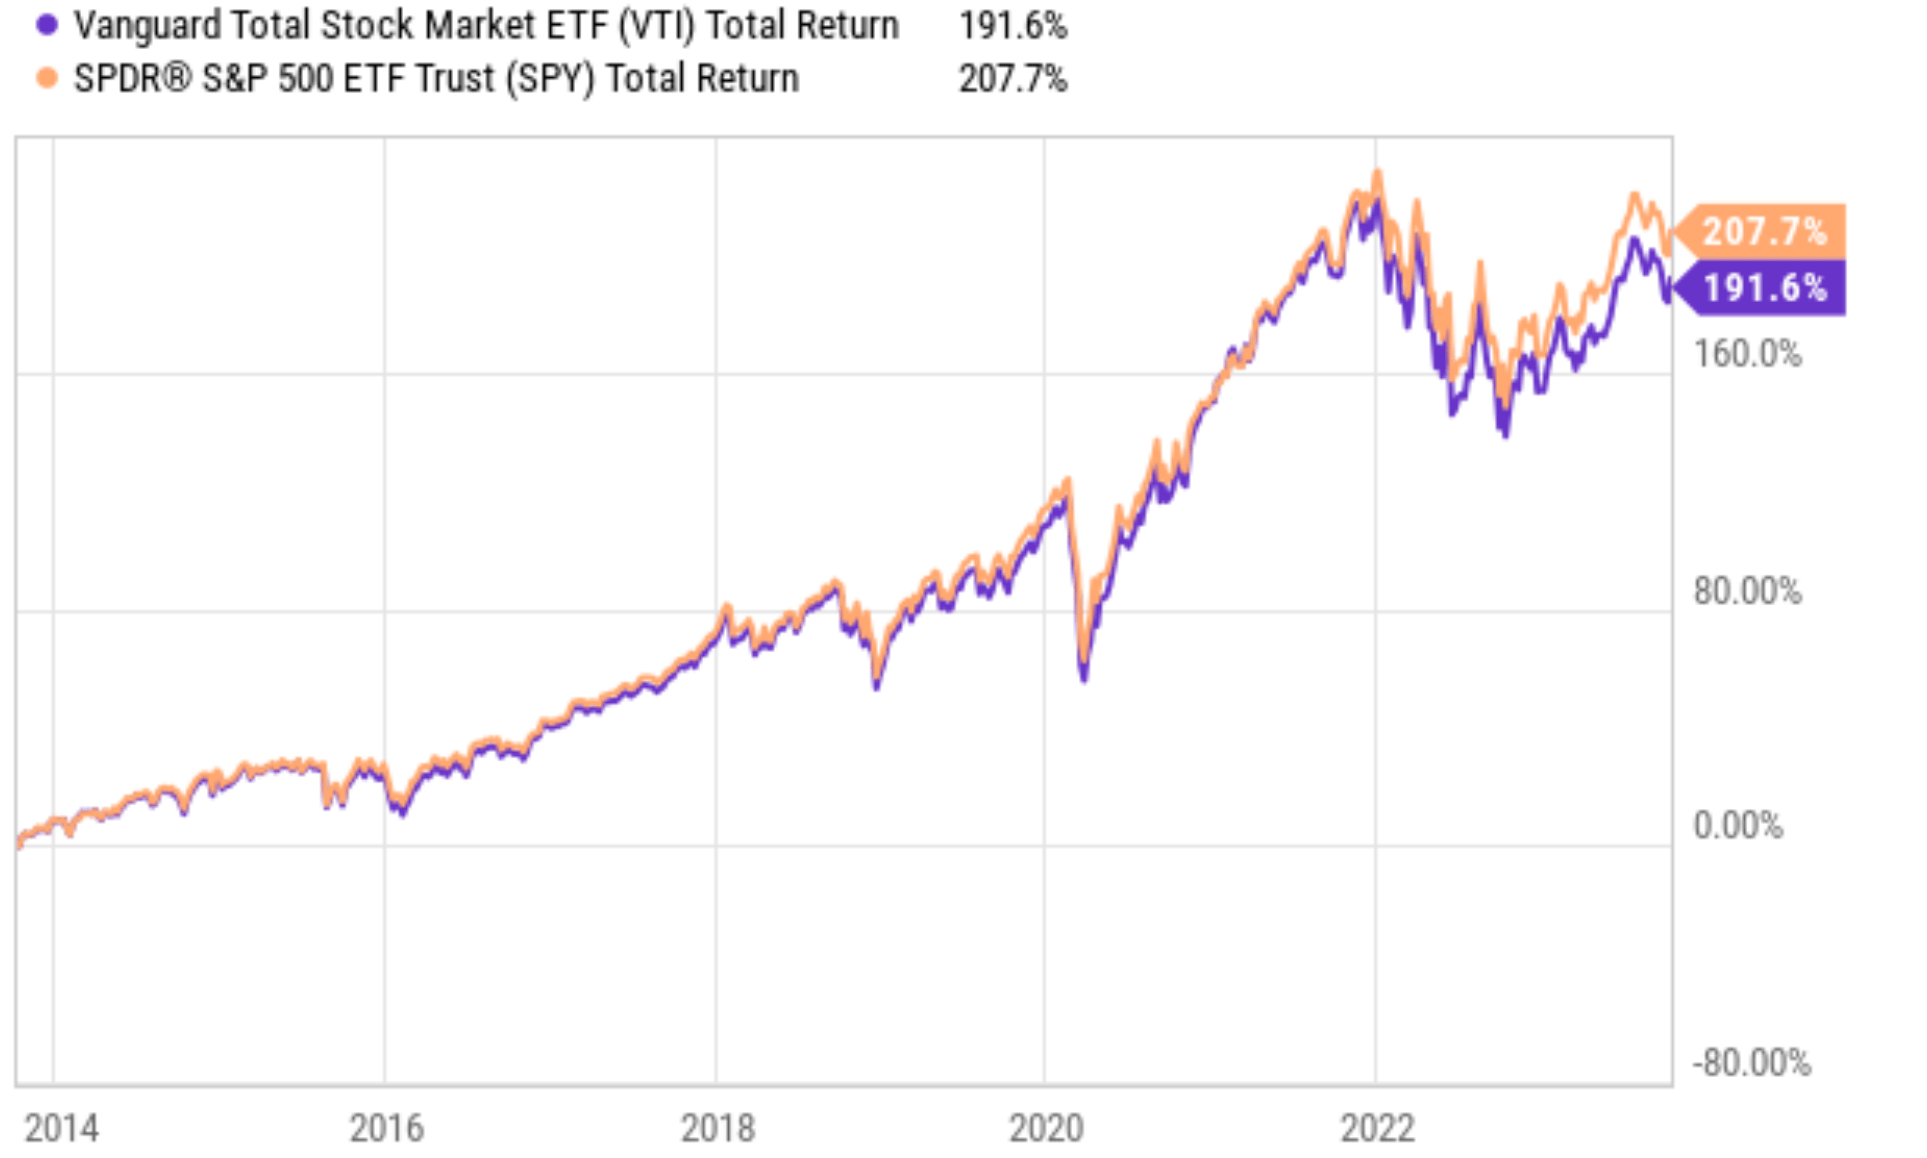
VTI is one of Vanguard's flagship funds and one of the most popular funds for investors to obtain broad exposure to the U.S. equity market. Its low fee, large AUM and excellent liquidity (see the first chart below), and also broad diversification are the main draws for us. As an overall market fund, its performance and risks are quite close to other overall market funds such as SPY, VOO, and IVV. As an example, the second chart below compares its total return in the past 10 years to SPY. As seen, their performances almost entirely overlapped. Admittedly, a difference of about 8% (207.7% from SPY vs. 191.6% from VTI) has accumulated over 10 years, the difference is quite small when annualized (about 0.8% per year).
VTI and SPY valuation gap
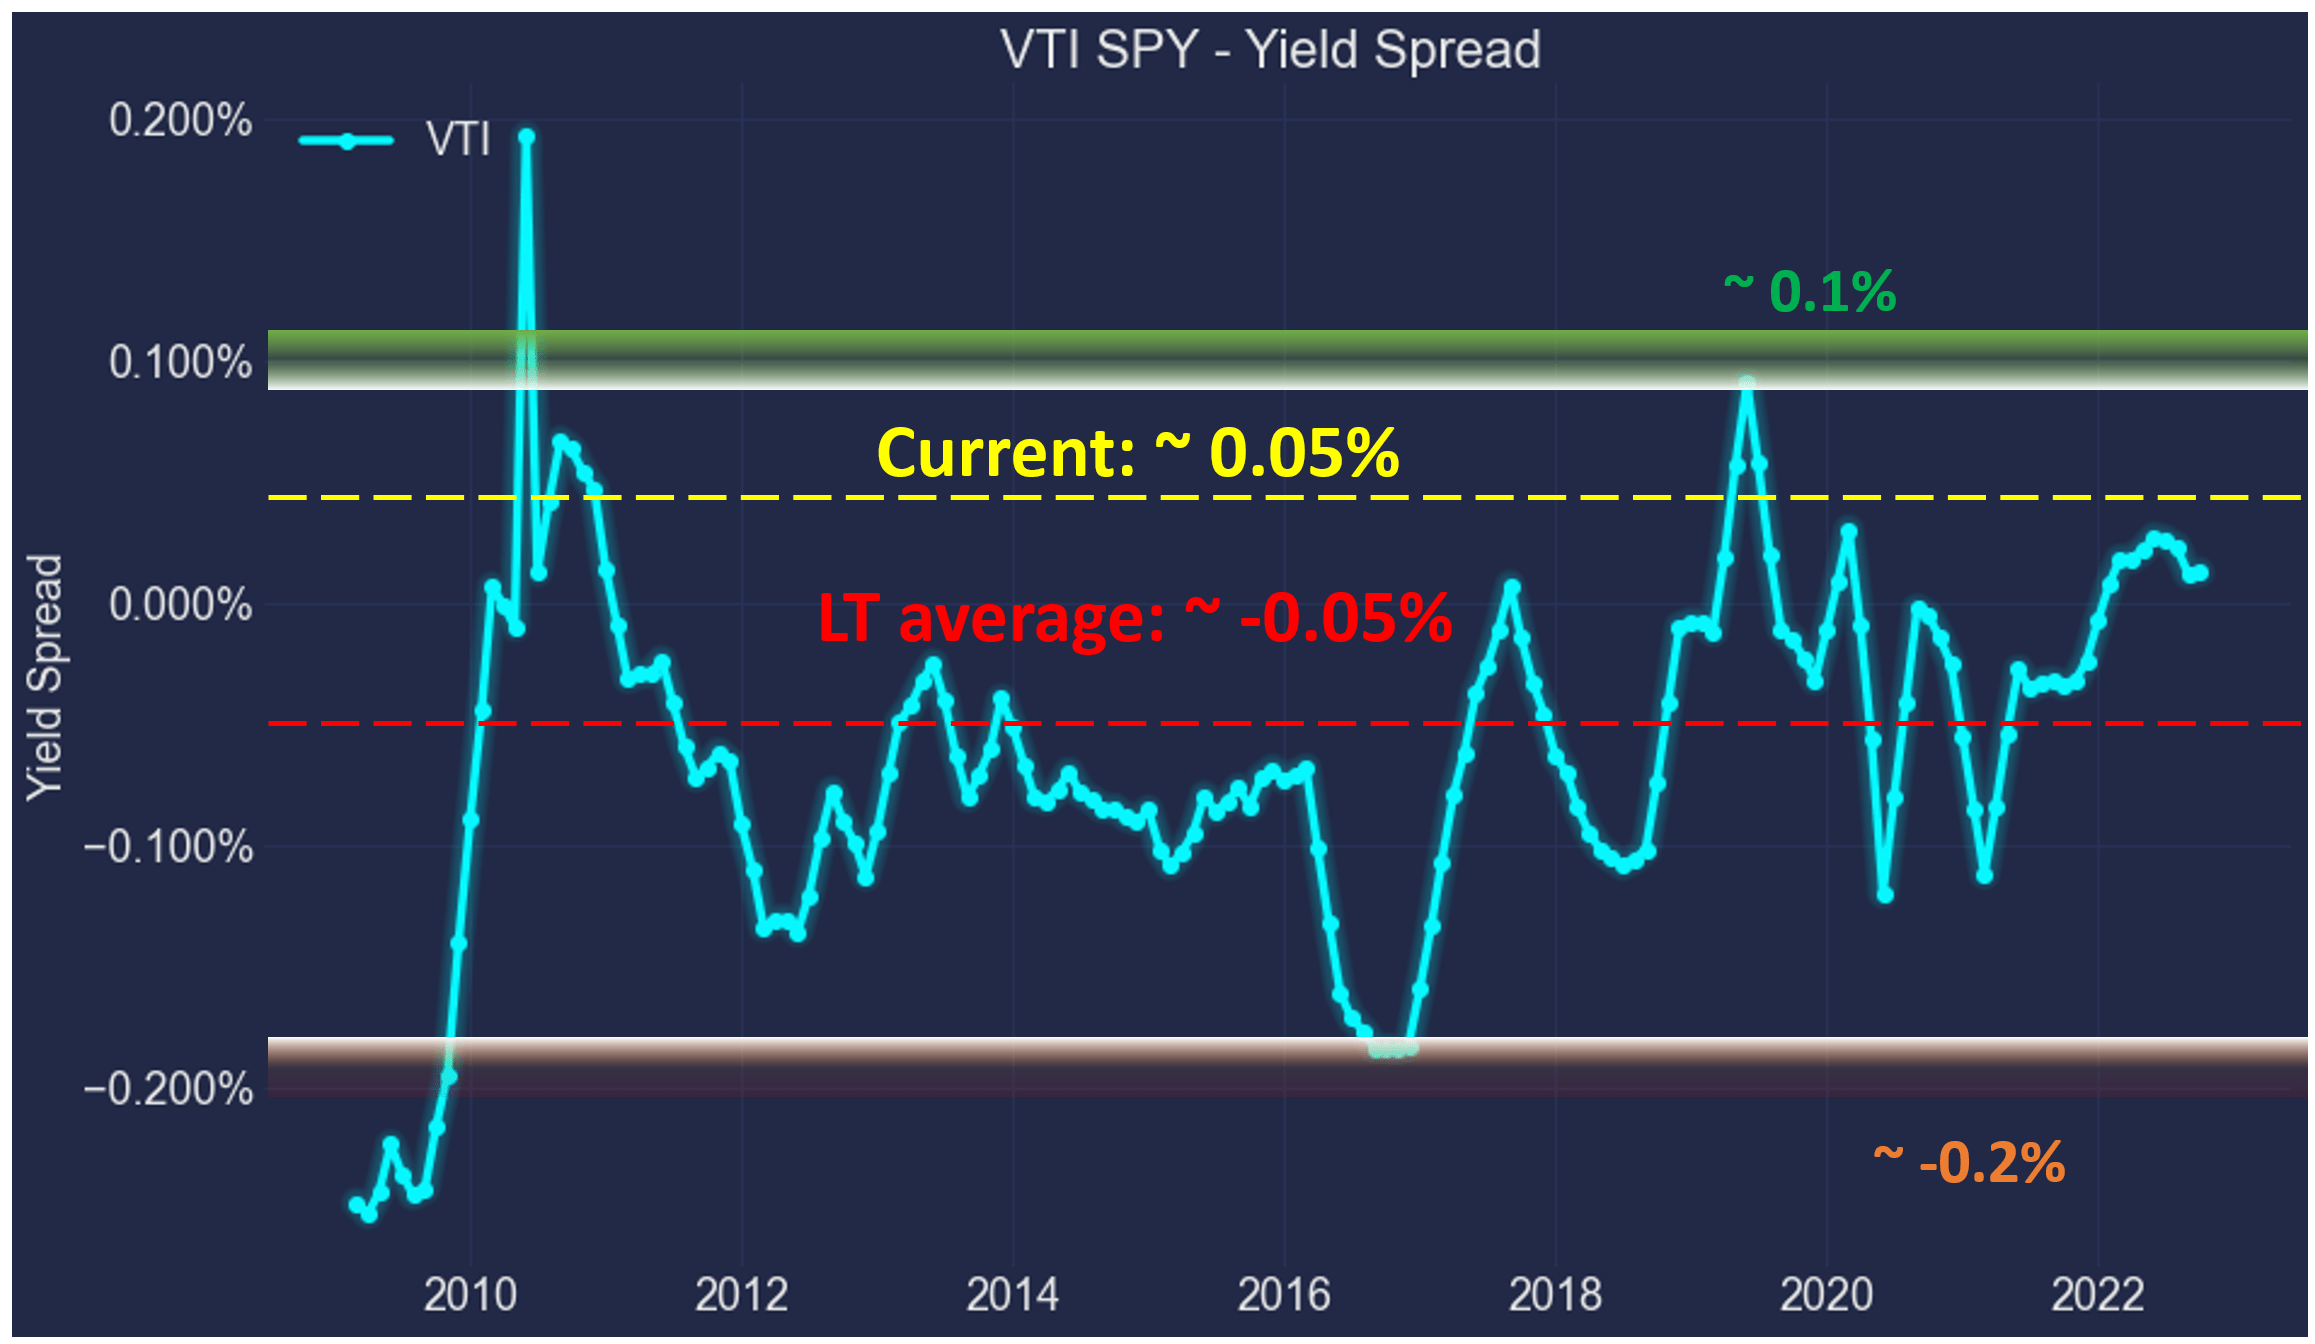
Although, from time to time, a relatively large divergence can happen. Our analysis shows now is one such time. The valuation differences between VTI and SPY are at the largest level in about a decade as seen in the chart below. The chart measures their valuation difference by the spread of their dividend yield, an effective way of measuring risk premium in the long term for many good reasons. As detailed in our earlier article ,
- The common PE, Price/Book Value ratio, or Price/cash flow multiples provide partial and even misleading information due to the differences between accounting earnings and owners’ earnings.
- Dividends provide a backdoor to quickly estimate the owners’ earnings. Dividends are the most reliable financial information and least open to interpretation.
- The dividend yield spread (“YS”) is based on a timeless intuition. No matter how times change, the risk-free rate serves as the gravity on all asset valuations and consequently, the spread ALWAYS provides a measurement of the risk premium investors are paying relative to risk-free rates.
As the chart shows, the YS between VTI and SPY (defined as the TTM yield of VTI minus that from SPY) has been in the range between about 0.1% and -0.2% the majority of the time in the past. The average YS was around -0.05%. Currently, the spread is about 0.05% (VTI’s 1.54% TTM yield minus SPY’s 1.49%). An YS of 0.05% is the highest level since ~2010 if you ignore the outlier data points created during the 2020 COVID panic.
Author based on Seeking Alpha data
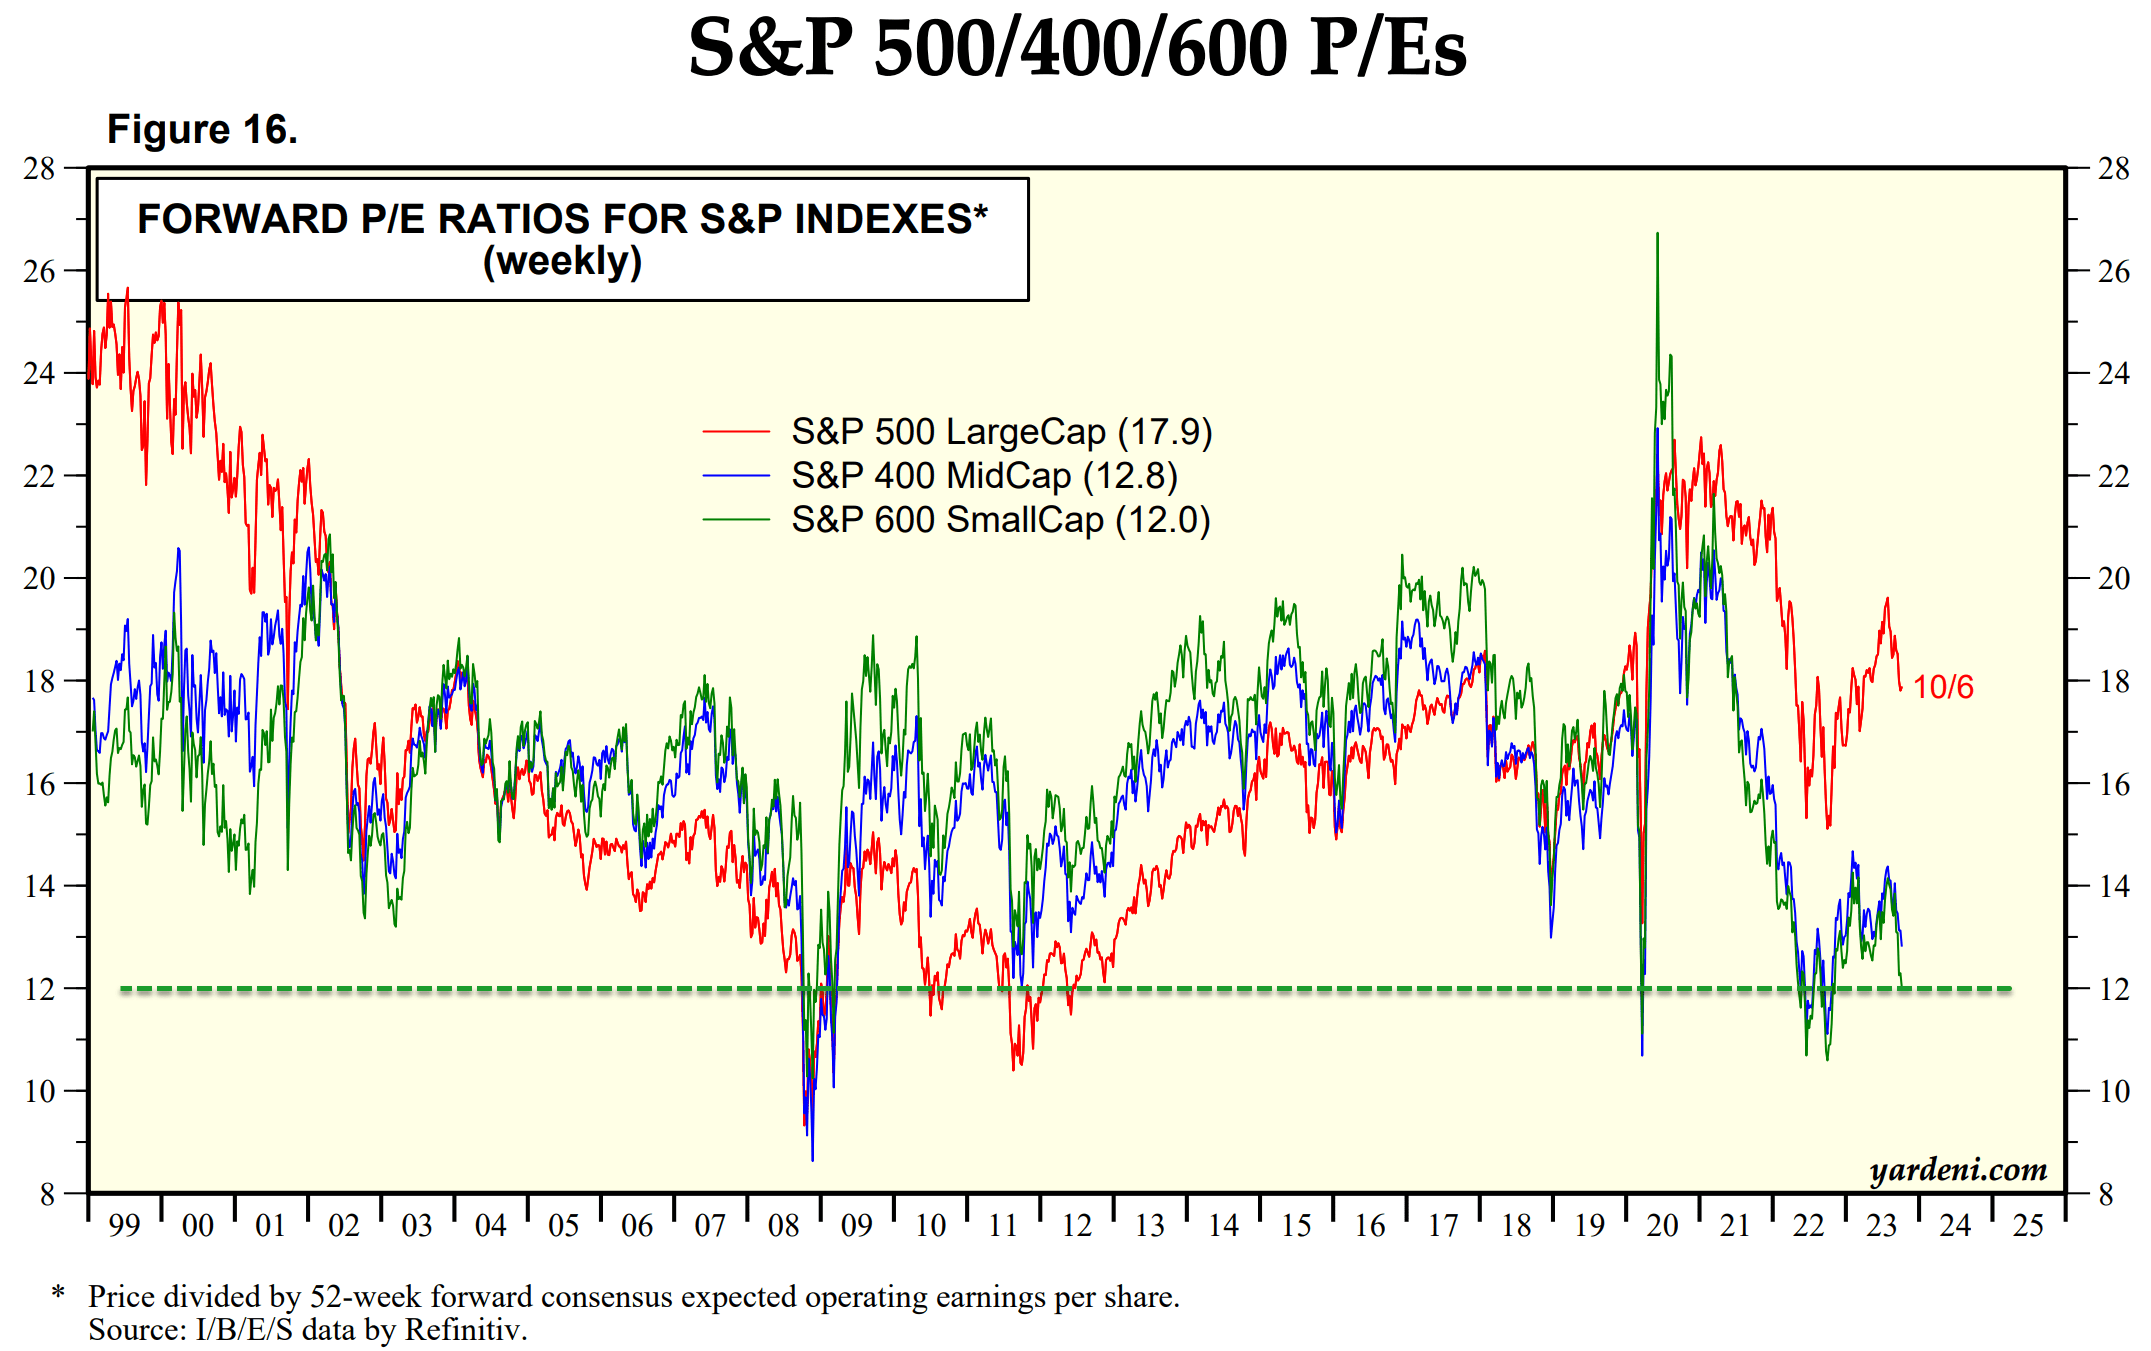
The root cause of such a large valuation gap between VTI and SPY is that small- and mid-caps are currently out of favor (to which VTI is exposed but SPY is not). As seen in the next chart below, small- and mid-caps (the green and blue lines) are currently valued at nearly a cyclical bottom. While the S&P 500 large caps are valued near a cyclical peak. For example, small caps are currently trading at ~12x FW P/E. This is a level that is among the lowest in more than 2 decades and approaching those during the COVID crash and the 2008 crisis.
All told, the large valuation gap, combined with the lower fees charged by VTI, should give VTI a good chance for a noticeable outperformance over SPY in the years to come in our view.
Our approach, risks, and final thoughts
If the above use of yield spread for gauging risk premium made sense to you, then our method for dynamic allocating VTI among other assets is quite simple. We use the yield spread between the equity market and risk-free interest rates to determine the allocation between equity and bonds. It is very parallel to the use of VTI:SPY yield spread to decide if we want to hold VTI or SPY (and how much of each if somehow we want to hold both).
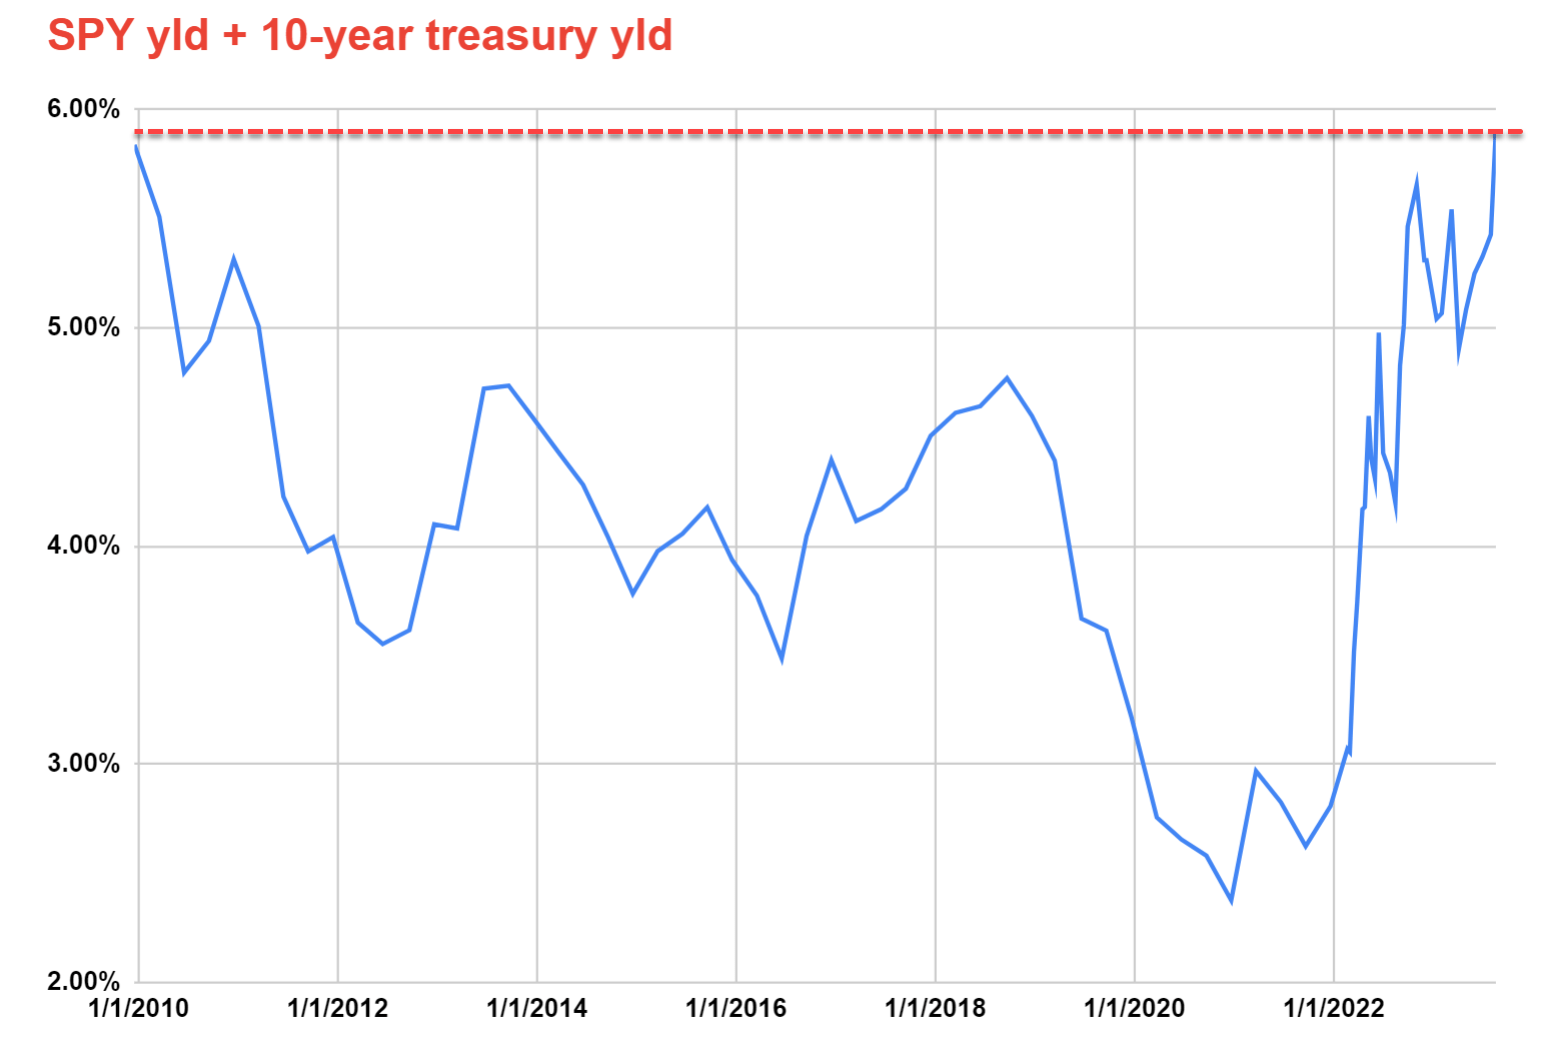
The dividend yield data not only provides information on equity:bond allocation, they also provides information about cash allocation. If you are a subscriber to the so-called barbell strategy, allocating cash is an equally, if not more, important investing decision. For us, we find the SUM of the equity yield and risk-free interest rates to be a good indicator, what we call the exposure index (“EI”). The EI measures the overall opportunity cost of holding cash. And as you can see from the chart below, the current EI is quite high, indicating that the opportunity cost of holding cash is relatively high. However, bear in mind that the risk premium in the overall market represented by the S&P 500 is also high as aforementioned. So, it is important to carefully consider which assets to put the cash into.
Our earlier article provides further details on our dynamic approach if you are interested. Before leaving the topic, it is important to point out a key risk involved in our approach:
Dividend yields do not always reflect business fundamentals due to several factors such as tax law, political climate, the composition of the market index, et al. As a result, we do not directly use the yield spread in our investment or asset allocation decisions. In practice, we first adjust for the above corrections and then use the adjusted yield spread in our investment decision. But the data and approach illustrated here is the first place we check.
To reiterate, the goal of this article is to compile the Q&As surrounding VTI we've had into a coherent thesis. The key takeaways are twofold. First, our experience is that the key to investing is to get the allocations among different asset classes such as bonds, equity, precious metals, etc. Whether we use VTI or SPY (or other equivalent funds) is of secondary importance. Our approach to making such allocations is based on the yields of equity and risk-free rates. Secondly, although the current valuation gap between VTI and SPY is quite large by historical standards due to the valuation compression of small- and mid-caps. Such a large valuation gap, combined with VTI’s lower fee (0.03% vs. SPY’s 0.09%), should provide VTI with good odds to deliver better performance in the years to come.
Author based on Seeking Alpha data
For further details see:
VTI: What's Different From SPY And How We Use It