ARKK - VUG: A Solid Large Cap Growth ETF But Here's A Magnificent Alternative
2023-10-30 12:15:24 ET
Summary
- The Vanguard Growth ETF has a simple and efficient structure, with low fees and minimal turnover. Ten-year returns are about average, while its five-year track record is slightly above average.
- However, assigning a buy rating based on past performance alone is not appropriate. We should consider the alternatives, too, which include QQQ, SPYG, VOOG, SCHG, MGK, and IWY.
- This analysis takes a comprehensive look at how VUG compares fundamentally with its peers. For completeness, I also highlight the short- and long-term total returns for 49 large/all-cap growth ETFs.
- I ask readers to consider how the Magnificent Seven stocks (AAPL, MSFT, GOOGL, AMZN, NVDA, META, TSLA) have contributed to all of SPY's gains this year, and suggest reducing exposure. In particular, QQQ is nicely set up after the July special rebalancing.
- Readers can also download my Excel Workbook for a complete look at each growth stock's fundamentals and historical returns. Mix and match ETFs as you see fit, and make sure to leave a comment afterwards to keep the discussion going.
Introduction
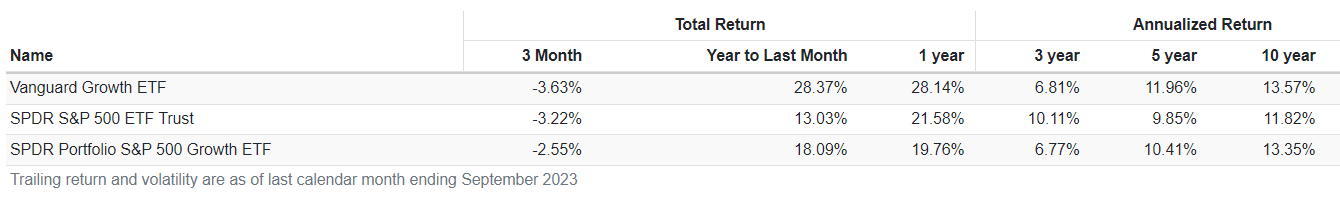
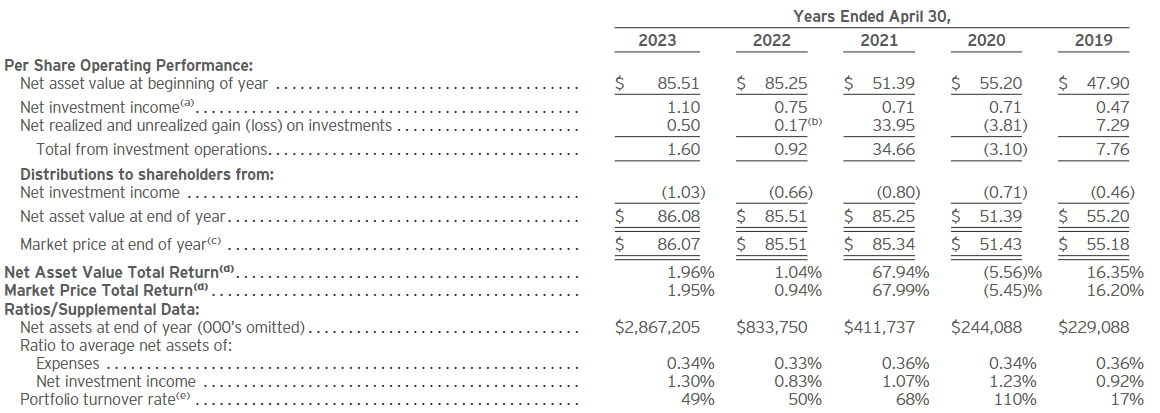
The Vanguard Growth Index Fund ETF Shares ( VUG ) is about as simple and efficient as possible. Utilizing a free-float-market-capitalization weighting scheme, Vanguard charges just 0.03% in annual fees for exposure to large- and mid-cap U.S. stocks with high historical and expected sales and earnings growth rates. Screens for current investment to assets and return on assets ratios boost quality, and turnover is minimal. Between 2018-2022, VUG's portfolio turnover rate was 5-11%, indicating it's nearly as stable as the SPDR S&P 500 ETF Trust ( SPY ) at 2-4%. There's something about "knowing what you own" and not having to deal with smart-beta rules-based funds that's attractive to many.
Over the last ten years, the strategy has worked well, too. Compared to SPY, VUG has outperformed by an annualized 1.75%. It's also outpaced the SPDR Portfolio S&P 500 Growth ETF ( SPYG ), a popular fund that relies solely on historical metrics to calculate growth and value scores.
So, why would any long-term investor not buy VUG? Well, for starters, past performance is not guaranteed to repeat. More importantly, there are four dozen alternatives, and 20 have at least a ten-year track record. Assigning a "buy" rating without also evaluating these ETFs would result in an incomplete analysis, and that's what I want to avoid today. To supplement this analysis, I've included an Excel Workbook that contains dozens of statistics for the 450 stocks held in VUG and the following five large-cap growth ETFs:
- Invesco QQQ Trust ETF ( QQQ ).
- SPDR Portfolio S&P 500 Growth ETF ( SPYG ).
- Schwab U.S. Large-Cap Growth ETF ( SCHG ).
- Vanguard Mega Cap Growth Index Fund ETF Shares ( MGK ).
- iShares Russell Top 200 Growth ETF ( IWY ).
I selected these five because of their strong track records, high assets under management, and low fees. If the ETF you're interested in isn't included, please request it in the comments section afterward. However, for now, let's get started by discussing VUG's selection process.
VUG Overview
VUG tracks the CRSP US Large Cap Growth Index, which selects large-cap growth stocks based on six screens:
- Future Long-Term Earnings Per Share Growth.
- Future Short-Term Earnings Per Share Growth.
- Historical 3Y Earnings Per Share Growth.
- Historical 3Y Sales Per Share Growth.
- Current Investment-To-Assets Ratio.
- Return on Assets.
I prefer this mixture of forward and backward-looking metrics over how S&P Style Indexes work. SPYG and the Vanguard S&P 500 Growth Index Fund ETF Shares ( VOOG ) track the S&P 500 Growth Index, whose growth screens are limited to historical metrics:
- Three-year earnings per share over price change.
- Three-year sales per share growth rate.
- Twelve-month price change.
These changes led to Microsoft and Amazon ( AMZN ) joining the S&P 500 Value Index, while Energy giants Exxon Mobil ( XOM ) and Chevron ( CVX ) made their way to the S&P 500 Growth Index (SPYG and VOOG). The price change momentum screen was the catalyst for the changes, and unfortunately, it didn't work out in 2023. Microsoft and Amazon are up 37.66% and 42.35%, while Exxon Mobil and Chevron are down 0.03% and 11.33%.
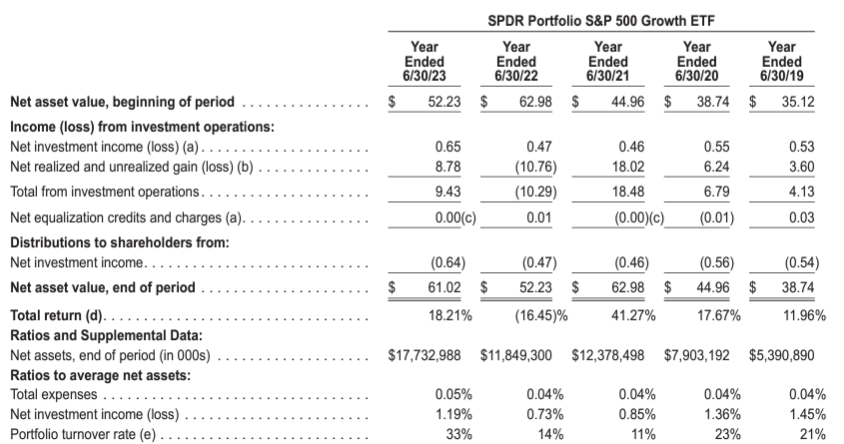
I point out this difference to benefit investors who divide their portfolios into "buckets," e.g., dividends, value, growth, and income. ETFs that track Indexes with few and sensitive screens, as is the case with the S&P 500 Growth Index, tend to have higher turnover, which can lead to higher-than-expected overlap in the future. Recall that VUG's portfolio turnover rate for the last five years was 5-11%. On the other hand, SPYG's was 33% for the year ending June 30, 2023, and averaged 17% the four years prior.
I'm not saying this methodology is inherently worse. However, it does make it more challenging to follow. I don't want to put anyone in a position five years from now where they want to sell in favor of a more stable ETF but are reluctant because of tax implications.
As for the other four ETFs, here are some brief notes to consider:
1. QQQ follows a modified market-cap-weighting scheme and includes the 100 largest non-financial stocks on the Nasdaq exchange. Recently, the Index underwent a special rebalancing, as the collective weights with weightings above 4.5% exceeded 48%. Now, that figure is down to 26.4%, but apart from these infrequent special rebalancings, portfolio turnover is consistently below 10%, per the fund's latest annual report .
2. SCHG is Schwab's low-cost, large-cap growth solution. It tracks the Dow Jones U.S. Large-Cap Growth Total Stock Market Index, is free-float-market-cap-weighted, and selects stocks based on six screens:
- Forward Price-Earnings Ratio.
- Estimated 3-5Y Operating Earnings Growth.
- Trailing Price-Book Ratio.
- Indicated Dividend Yield.
- Trailing 5Y Sales Growth.
- Trailing 21-Quarter EPS Growth.
Similar to VUG, these screens blend backward and forward-looking metrics. The result is lower turnover than the two ETFs tracking the S&P 500 Growth Index (SPYG and VOOG). Again, all else equal, more screens generally indicate less turnover. Keep that in mind for any ETF you evaluate, especially if you're not the trading type.
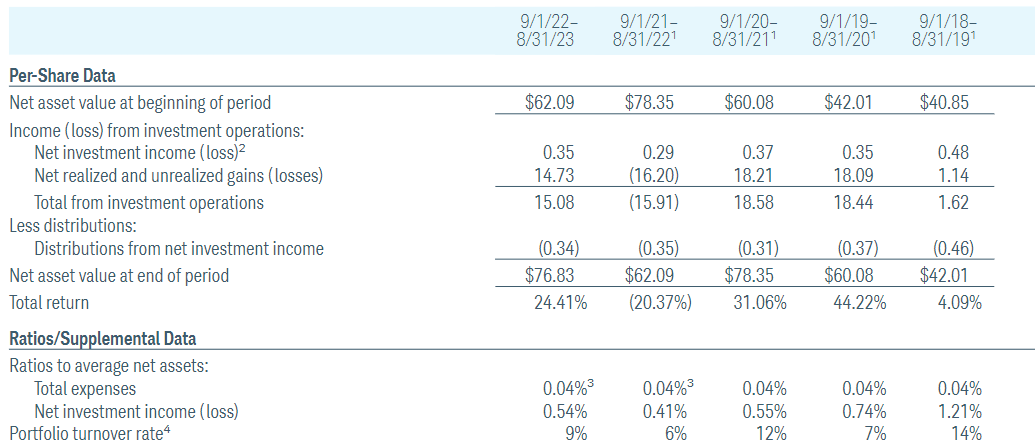
3. MGK tracks the CRSP US Mega Cap Growth Index and is a more concentrated version of VUG. It uses the same six screens described earlier to calculate a growth score and charges slightly more (0.07% vs. 0.04%). To illustrate the impact, MGK holds only 87 securities vs. 219 for VUG. Furthermore, Apple and Microsoft combine for 28.73% of MGK vs. 25.77% for VUG. Finally, turnover was also relatively low last year at 7% and ranged between 5-14% between 2019-2022, per the latest annual report .
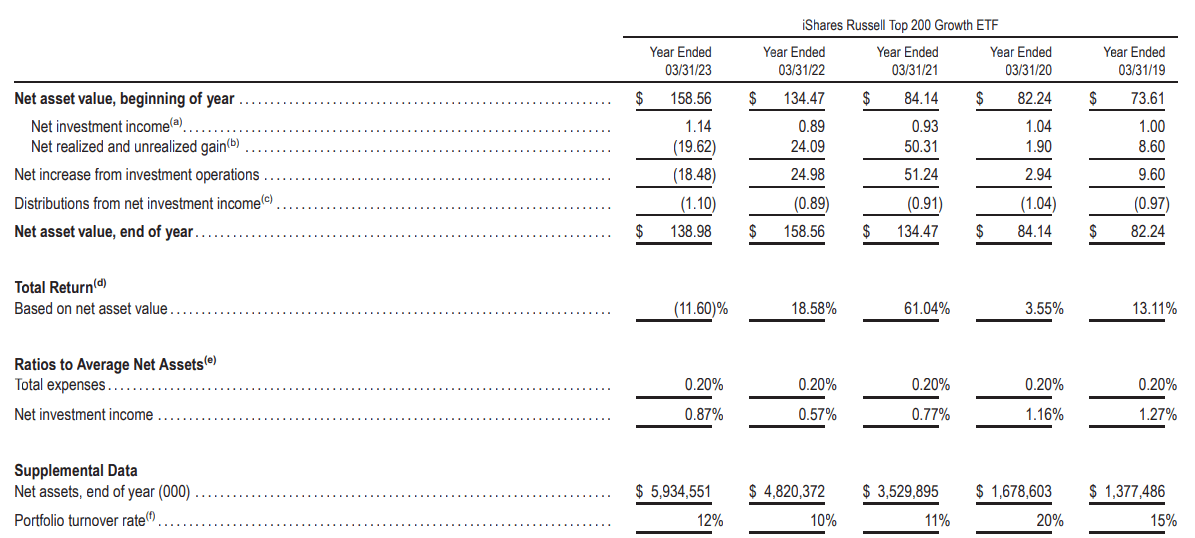
4. IWY is more "under the radar," with "only" $6.84 billion in assets under management and a relatively high 0.20% expense ratio. This ETF tracks the Russell Top 200 Growth Index. IWY doesn't hold 200 stocks but merely selects from a universe of the 200-largest Russell 1000 stocks based on three factors:
- Three-year earnings per share over price change
- Three-year sales per share growth rate
- Twelve-month price change
Recall how these are the same three screens used for the S&P 500 Growth Index. However, it's virtually a mega-cap ETF, making it an exciting blend between MGK and SPYG. Portfolio turnover also tends to be in the middle, ranging between 10-20% between 2019-2023, per the latest annual report .
As a large-cap growth investor, you have a few decisions to make before we even look at the fundamentals of each ETF. Questions include:
1. How comfortable are you with mega-cap stocks having such a considerable influence on the ETF's performance?
2. Is sector diversification important to you so long as sufficient growth potential exists, or are you looking to hedge your bets more?
3. Do you prefer backward-looking metrics, forward-looking metrics, or a mix of both?
4. If you make a wrong decision today, will you be willing to change investments several years down the line, even if it means accepting the inevitable tax consequences?
If you're unsure about these questions, VUG is a nice compromise. It's reasonably well-diversified by sector compared to its peers, utilizes both forward and backward-looking metrics, and has a low turnover rate. As I stated in the introduction, it's about as straightforward as it gets and something that's worked quite well over the last decade. However, its track record could be better, and on that note, I want to look closer at the historical track records of not just these five ETFs but all 49 large/all-cap growth ETFs in my database.
Large-Cap Growth ETF Track Records
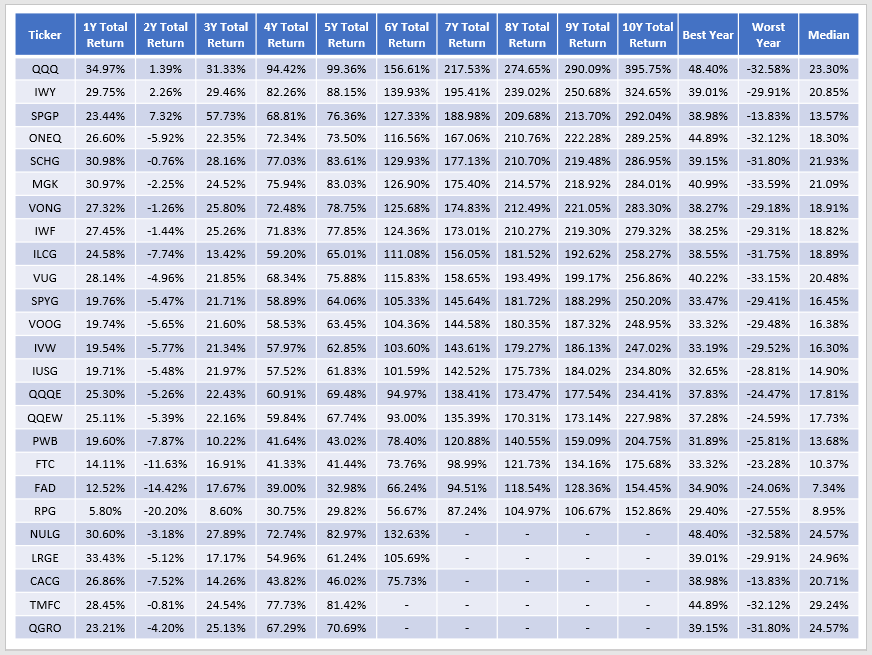
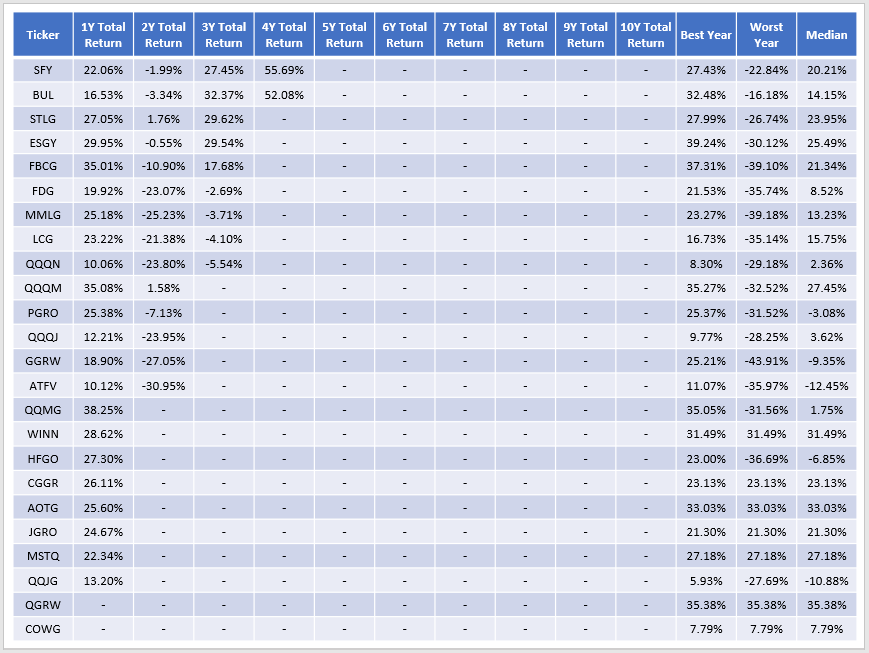
The following two tables highlight compounded returns for all large/all-cap growth ETFs in my database. I've also included best and worst-year statistics, along with each ETF's annual median return.
The Sunday Investor The Sunday Investor
QQQ was the best performer, earning total returns of 395.75% in the ten years between October 2013 and September 2023, as shown here . IWY was second best but substantially behind at 324.65%. For those who enjoy using Portfolio Visualizer's back-testing tool, you could pair QQQ with any value ETF and come to a positive conclusion about the combination. However, that merely backtests the results of an ETF that excludes Financials and overweights the Technology sector. Remember that the Financial Select Sector SPDR Fund ETF ( XLF ) only gained an annualized 9.55% over this period, while the Technology Select Sector SPDR Fund ETF ( XLK ) gained 19.38%. If you want to use QQQ's previous ten-year returns to justify ignoring other growth ETFs, you must also commit to backing Technology over Financials.
For VUG, its 256.86% total return figure is #10/20 on the list among those with a ten-year track record. In other words, average. It's slightly ahead of SPYG, though well behind SCHG and MGK, which rank #5/10 and #6/10, respectively. On three- and five-year total returns, VUG ranks #19/34 and #10/25, but again, it's behind QQQ, IWY, SCHG, and MGK but ahead of SPYG.
What About SPGP?
An honorable mention is the Invesco S&P 500 GARP ETF ( SPGP ), which ranks #2/20 on ten-year returns. However, SPGP has only tracked its current Index since June 21, 2019, meaning only the four-year total return figures are relevant. Over this period, SPGP still ranked a respectable #10/27, but its semi-annual reconstitutions are often quite eventful, and the ETF only sometimes does a good job targeting growth stocks. The growth-at-a-reasonable-price, or GARP strategy, is more appropriate to complement a broad market fund like SPY. If you plan on using it for the growth side of your portfolio, expect it to sometimes overlap with the value side, as it's challenging to predict the changes, too. When the Index switched, SPGP's turnover rate skyrocketed to 110% and has averaged 56% in the last three years.
The key takeaway is that SPGP requires investors to trust the strategy. The GARP strategy has been around for a long time, and the way the Index selects constituents is clever, as discussed here . However, my previous reviews demonstrate how the fund's volatility, sector allocations, and growth potential can substantially change with each reconstitution. It's slightly lagged VUG since I downgraded the fund in April 2022, and I've been hesitant to change my rating because I don't have a great handle on where it's heading next.
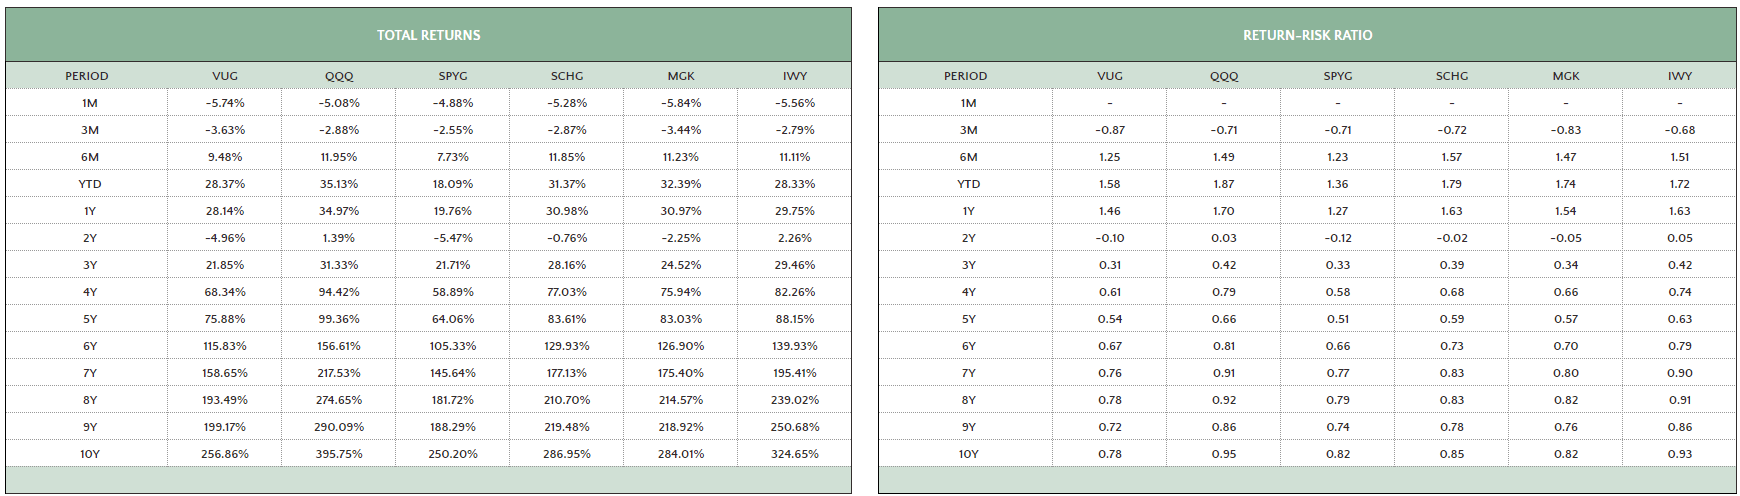
Periodic Risk-Adjusted Returns
Finally, here's a different look at the six ETFs' returns over the last ten years. These tables include return-to-risk ratios, the same as the commonly-used Sharpe Ratio , but less the risk-free rate. The data source for these tables is Portfolio Visualizer, assuming reinvested dividends.
VUG's total risk-adjusted returns are generally worse than its five peers. As a fundamental analyst, I prefer evaluating the ETF's current metrics to assess return potential, but I have to assign some weight to this track record. There should be a compelling reason for me to recommend VUG, which might include:
- A favorable composition.
- Superior quality.
- Attractive growth and valuation combination.
- Positive sentiment.
I look forward to evaluating VUG's fundamentals in detail, but first, let's examine its composition at the sector and sub-industry levels.
VUG Analysis
Sector Exposures and Sub-Industry Composition
This first table offers a high-level view of VUG's diversification compared with the five ETFs listed above. Before I begin, I want to note how Vanguard's holding updates are delayed up to 45 days, which impacts these Morningstar sector allocation tables. I worked around this by viewing VUG's Portfolio Composition File and re-calculating the weights using the number of shares provided, which are updated daily. I found a few minor variances, with a 0.89% increase to Technology as the largest. I will use these updated calculations for the rest of this review.
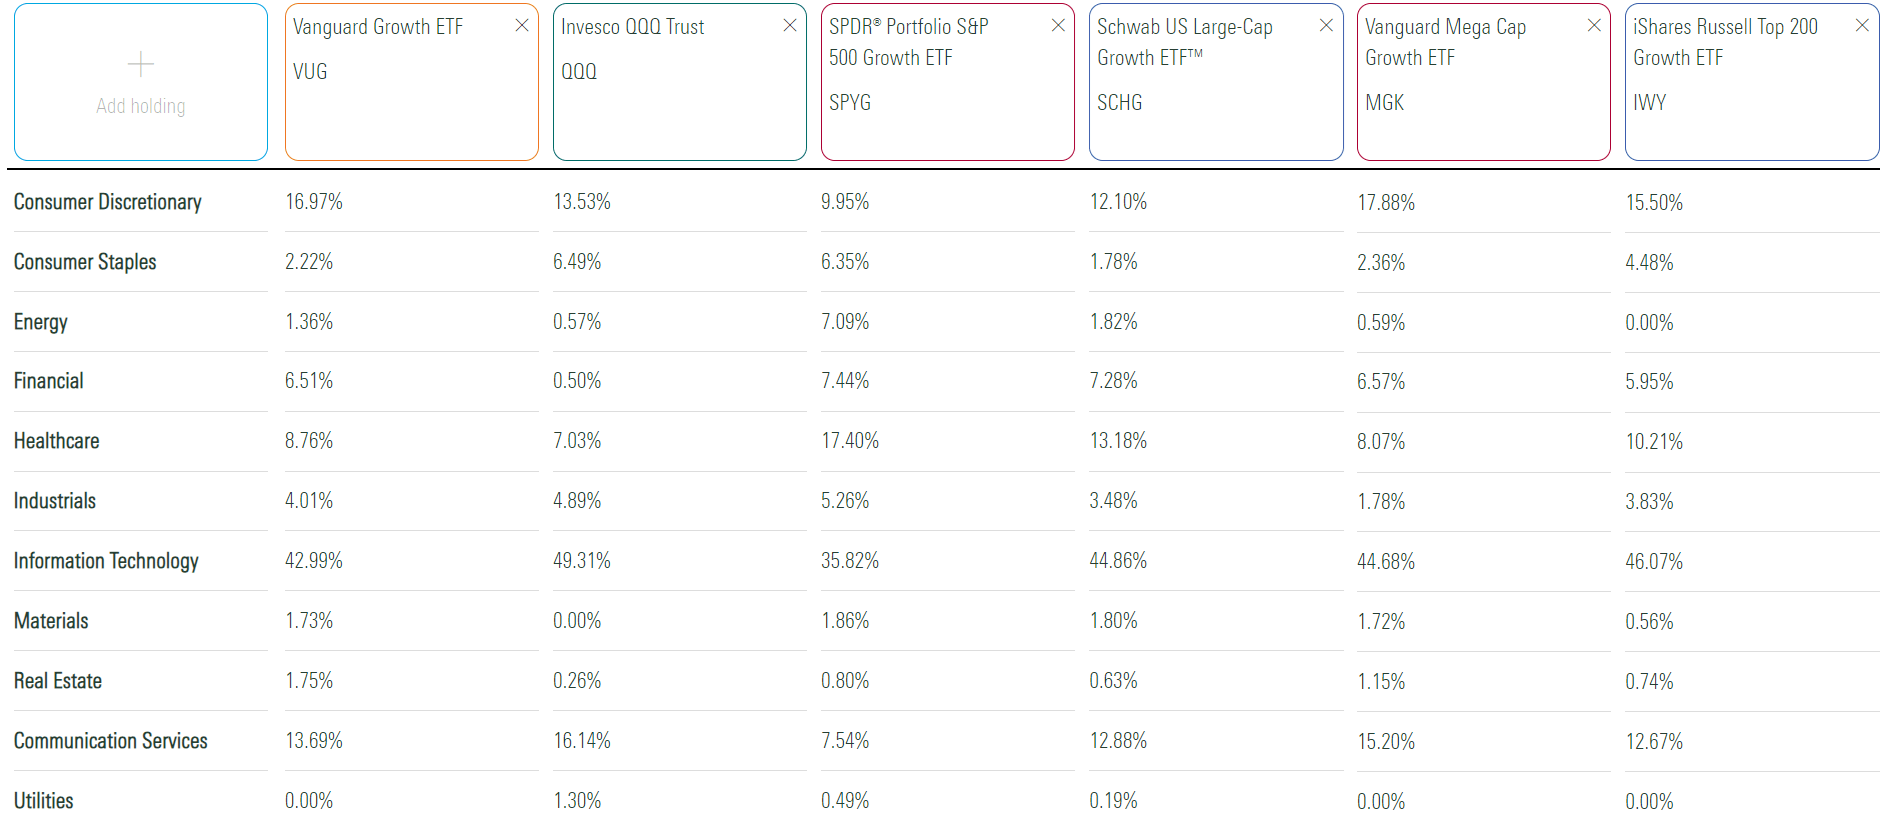
Despite the increase, VUG's Technology sector exposure is slightly on the low side, with SPYG and QQQ's 35.82% and 49.31% exposure representing the lower and upper bounds in this sample. Compared to the average of these five, VUG overweights Consumer Discretionary, Financials, and Real Estate by 2.52%, 0.92%, and 0.90%. As offsets, VUG underweights Healthcare and Consumer Staples by 2.74% and 2.01%.
This composition indicates VUG will likely be more volatile than the average growth fund. However, it's unclear if this will result in greater growth potential. With declining interest rates likely over the next few years, banking margins will come under pressure. However, underweighting Healthcare and Consumer Staples should positively impact growth potential. It will be interesting to see how it all shakes out later in my fundamental analysis.
I've also compiled a summary of VUG by GICS sub-industry, a view I find a nice compromise between sector- and company-level analysis. Per the table below, VUG's top 25 sub-industries total 87.80% of the portfolio, and in many cases, the top three holdings in each sub-industry account for most of the exposure. In particular, Apple ( AAPL ) and Microsoft ( MSFT ) comprise 25.77% of the fund, so any growth investor considering a market-cap-weighted ETF should be comfortable owning these companies.
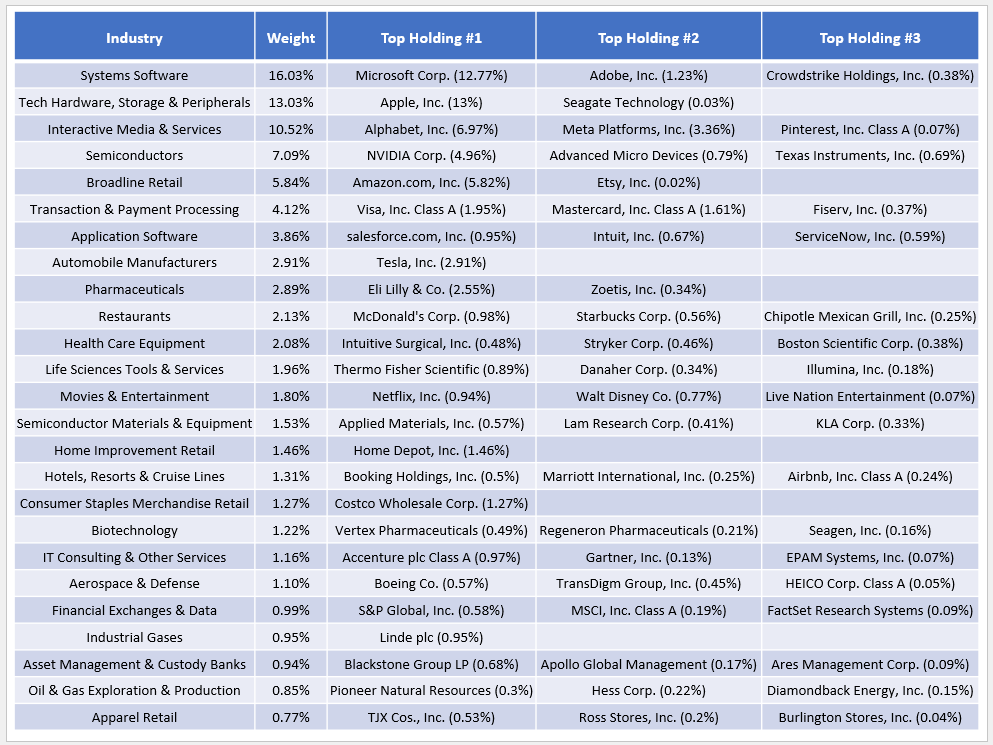
I've combined Alphabet's two share classes, which total 6.97%, for analysis purposes. Amazon ( AMZN ) and Nvidia ( NVDA ) round out the top five, with 5.82% and 4.96% weightings. The fund's top holdings total 55.90%. I've also compiled a table highlighting the weighting differences between VUG and the five alternatives plus SPY by sub-industry.
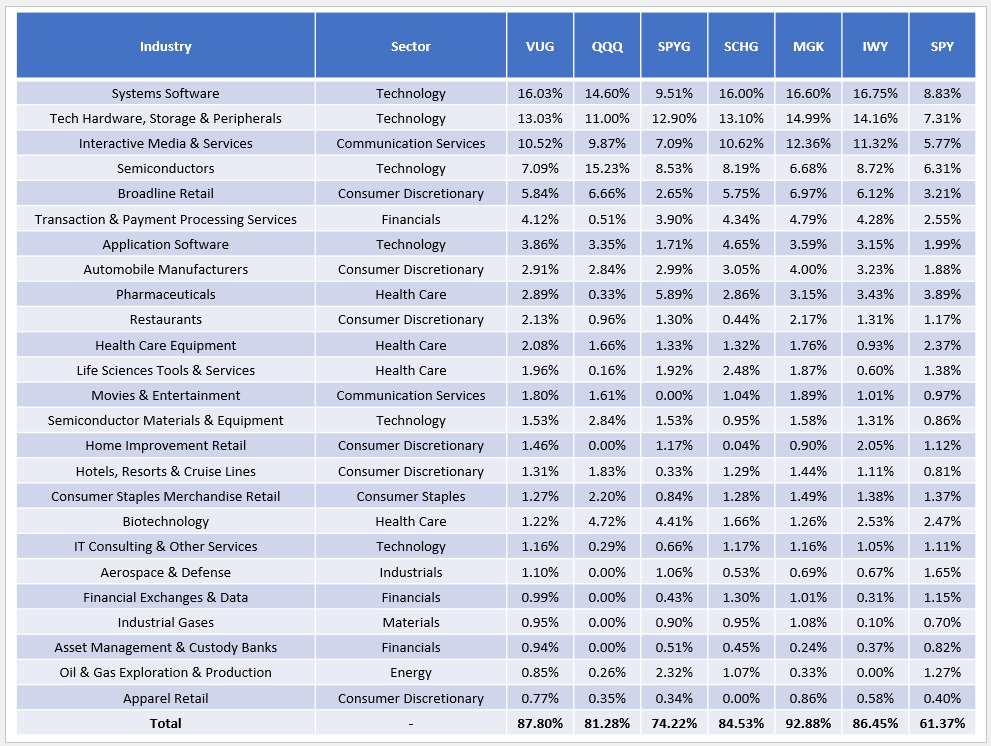
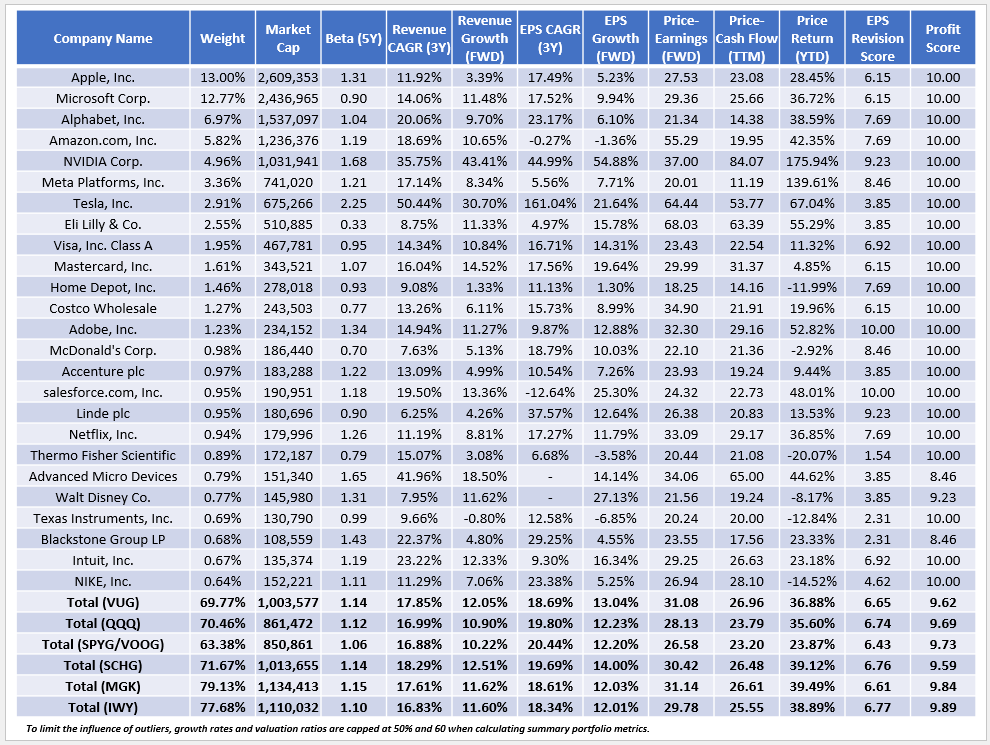
VUG Fundamentals By Company
The following table summarizes VUG's fundamentals for its top 25 holdings, totaling 69.77% of the portfolio. Summary metrics for all six ETFs are in the last rows.
I want to examine four areas in closer detail:
1. VUG's concentration is close to average. It's 6% more than SPYG/VOOG but 8-10% less than MGK and IWY, the two mega-cap funds. QQQ has a similar concentration in its top 25 holdings at 70.46% but has lower allocations to Apple and Microsoft and no Financial sector exposure, except for PayPal Holdings ( PYPL ).
2. VUG trades at 31.08x forward earnings and 26.96x trailing cash flow using the arithmetic weighted average method, making it the second most costly choice behind MGK. The benefit is that its 12.05% and 13.04% estimated sales and earnings per share growth rates are also second best, so at least the growth potential acts as an offset. However, several mega-cap stocks are weighing down these numbers. Consider the following table, highlighting the weighting difference for 12 of the largest stocks across all six ETFs.
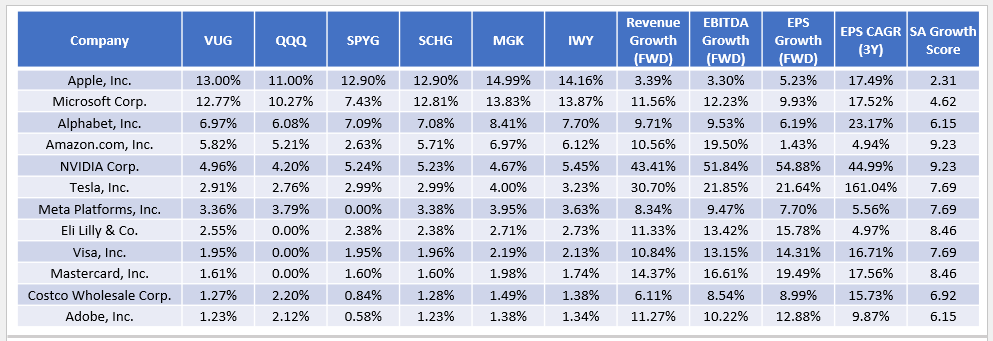
Apple, Microsoft, and Alphabet have estimated EPS growth rates of only a fraction of their three-year historical average, and they have an average 32.16% combined weighting. If these estimates hold, it's one reason why you should not solely rely on past performance to select an ETF. For those looking for better growth rates, consider the following five alternatives, but I caution that these ETFs tend to have high turnover or insufficient track records.
- First Trust Large Cap Growth AlphaDEX Fund ETF ( FTC ).
- American Century U.S. Quality Growth ETF ( QGRO ).
- Invesco Large Cap Growth ETF ( PWB ).
- Pacer US Large Cap Cash Cows Growth Leaders ETF ( COWG ).
- Fidelity® Blue Chip Growth ETF ( FBCG ).
3. As I'm sure you've realized, VUG and the other five growth ETFs have gotten extremely top-heavy. You may have heard about the "Magnificent Seven" (AAPL, MSFT, GOOGL , AMZN, NVDA, TSLA , META ) contributing to nearly all of SPY's gains this year. There are several ways to calculate, but consider that averaging each stock's weight between January 1 and October 28 results in a YTD price gain of 12.64%. Following the same method but excluding these stocks results in a 1.17% loss.
Of course, only value investors would advocate for avoiding these stocks altogether, as excluding them effectively results in the Vanguard Value ETF ( VTV ). However, their contribution to the fund's growth potential may not be as significant as it once was. Excluding them in SPY results in only 0.91% less estimated earnings growth (8.68% vs. 9.59%), so there's a case for investors shifting away from these mega-caps. Here are these seven stocks' combined weights for each of the six growth ETFs discussed today:
- VUG: 49.79%.
- QQQ: 43.31%.
- SPYG: 38.28%.
- SCHG: 50.10%.
- MGK: 56.81%.
- IWY: 54.15%.
At first glance, SPYG looks most appropriate for those wanting to take some correction risk off the table. However, remember how twelve-month price momentum is one of the three screens used to reconstitute the Index in December. Currently, SPYG's allocations to AMZN, TSLA, and META are 2.63%, 2.99%, and 0.00%, respectively. Based on these stocks' 52.07%, 68.29%, and 146.58% YTD price gains, there's every chance their allocations will substantially increase in two months, and SPYG will end up with similar returns to the VUG, SCHG, MGK, and IWY, like in 2022.
That leaves us with QQQ, which is the most different of the six, with 43.31% exposure to these seven stocks after its special rebalancing in July. Per the table below, the collective weights dropped by 11.6%, which changes the game and my previous opinion that QQQ was too top-heavy.
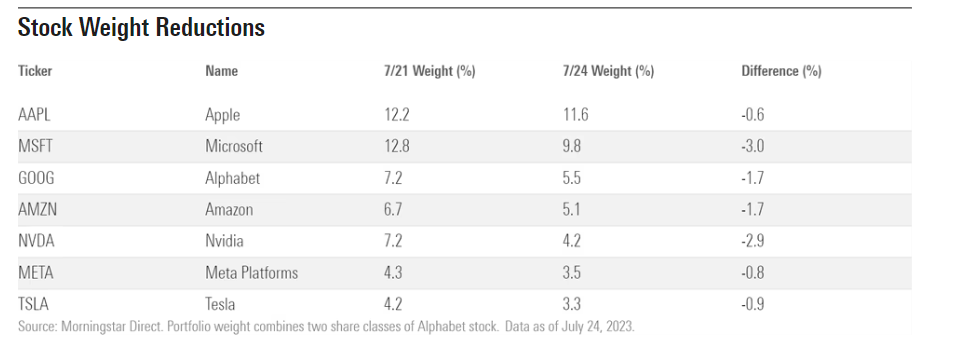
Remember that these rebalancings are designed to protect investors. As an extreme case, Canadian investors may recall when Nortel accounted for 33.47% of the TSE 300 Index, while Seagram, the #2 company, had a 2.85% allocation. The conflict at the time was that Canadian securities legislation required actively managed mutual funds to limit the allocation to 10% per stock. The Investment Funds Institute of Canada lobbied to increase the limit, but regulators refused.
It's a good thing, too. Just three months after this article was published, Nortel missed quarterly sales targets. Three months later, in February 2001, shares fell 33% after the company cut sales and earnings forecasts in half. Then came the accounting scandal and the eventual delisting of Nortel stock eight years later. To be sure, I don't expect anything like that to happen to any of these stocks. However, diversification is a crucial risk management tool, and given how the estimated growth rates of all six growth ETFs are so similar (12-14%), I favor the better-diversified one, which is QQQ.
4. Investing in high-quality stocks is the easiest way to build long-term wealth. In a September 2022 review of the ARK Innovation ETF ( ARKK ), I showed that non-profitable stocks could generate similar average annual returns as profitable stocks, but when compounded (i.e., not trying to time the market), the profitable stocks always won, which is logical. An easy tool you can use to quantify profitability is Seeking Alpha Factor Grades. My approach normalizes the grades on a ten-point scale to calculate a weighted average score for over 850 U.S. Equity ETFs. VUG's profit score is 9.62/10, far above the 9.10-9.20/10 minimum I set for large-cap ETFs. MGK and IWY are the highest at 9.84/10 and 9.89/10, providing evidence for what everyone should know by now, which is that mega-cap stocks are where they are because they make the most money.
As such, I doubt any of these ETFs will be considered a "bad" long-term investment. SPY's score is 9.39/10, and without the Magnificent Seven, it's 9.10/10, suggesting that at least some mega-cap exposure is required to make it a high-quality portfolio. For those interested in more profitability metrics, consider the following table of the ten largest sub-industries in VUG, totaling 68.41% of the portfolio.
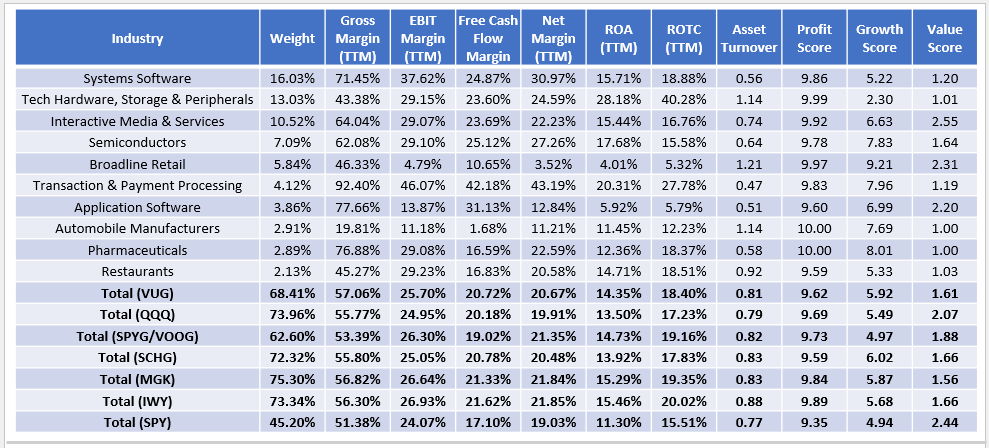
This analysis highlights a few potential weak spots from a profitability perspective. Broadline Retail, which is mainly Amazon, might be a sub-industry growth investors wish to avoid. However, Amazon's operating margins are recovering, now nearly as high as two years ago (7.82% vs. 8.17%), and the stock has soared in response.
Tesla margins (i.e., Tesla) are also relatively low but still strong among Automobile Manufacturers like Toyota Motor Corporation ( TM ), General Motors Company ( GM ), Ford Motor Company ( F ), and Rivian Automotive, Inc. ( RIVN ). Still, unlike Amazon, operating margins are steadily declining and are about half of what they were one year ago. This results from the company prioritizing market share by aggressively cutting prices. Gross margins slipped to 17.89% for the most recent quarter compared to 25.09% one year prior.
If you want to avoid this stock, QQQ has the least exposure at 2.76%, though all six growth ETFs are similar. The Excel Workbook I linked to earlier highlights all these weighting differences.
Investment Recommendation
It's hard to write too many negative things about VUG. It's a low-fee fund that's reasonably well-diversified compared to the market-cap-weighted alternatives. Its ten-year track record is average, and its five-year returns are slightly above average. Furthermore, it's a high-quality ETF with low turnover, two features great for long-term buy-and-hold investors. However, I find QQQ superior. It offers 0.81% less estimated earnings growth but trades at a 2.95-point discount on forward earnings, and based on current weightings, I don't anticipate another special rebalancing anytime soon. From a risk management perspective, investors should welcome QQQ's lower exposure to the Magnificent Seven stocks and, of course, give some weight to QQQ's vastly superior ten-year track record. Therefore, I think the most appropriate rating for VUG is a "hold." I hope this information was helpful, and as always, I look forward to the discussion below. Thank you for reading.
For further details see:
VUG: A Solid Large Cap Growth ETF, But Here's A Magnificent Alternative