VUG - VUG And VTV: How To Beat The Market With Vanguard's Growth And Value ETFs
2023-06-28 12:03:51 ET
Summary
- Vanguard Growth Index Fund ETF Shares and Vanguard Value Index Fund ETF Shares are Vanguard's most popular style funds offering exposure to the large-cap growth and value segments. They have a combined $187 billion in assets under management.
- VUG and VTV are growth and value cutouts of VV, Vanguard Large-Cap Index Fund ETF Shares, and one would expect a 50/50 portfolio to produce equal returns over the long run.
- However, my analysis reveals this combination consistently outperformed VV. Furthermore, it allows investors to efficiently target a particular style due to low fund overlap.
- I also tested the strategy using nine rebalancing options and entry points between 2009-2023. Frequent rebalancing was unnecessary, and you can likely let allocations drift to 60/40 without materially impacting long-term results.
- I recommend this strategy to long-term index investors, and believe distinguishing ETFs using a multi-factor approach will help bring more clarity to your investment strategy.
Introduction
Most investors own some low-cost plain vanilla funds like the Vanguard Large-Cap Index Fund ETF Shares ( VV ). They're simple, broadly understood, and likely to deliver a substantial return over time. However, most investors also favor a particular style, either growth or value. In response, Vanguard and other large exchange-traded fund, or ETF, providers created style ETFs like the Vanguard Growth Index Fund ETF Shares ( VUG ) and the Vanguard Value Index Fund ETF Shares ( VTV ). These ETFs provide investors with flexibility, as they can simply overweight one style based on personal preferences.
However, I've found that investors using a 50/50 portfolio of VUG/VTV and rebalancing relatively infrequently outperformed VV since it began tracking the CRSP US Large Cap Index in June 2009. As a bonus, the fundamentals of a 60/40, 50/50, and 40/60 portfolio look very similar, so it's unlikely you'll be too overexposed to one style, even in extreme markets. I'm excited to share this simplified investment strategy, but first, let me provide a brief overview of how Vanguard's CRSP Style Indexes work.
CRSP Style Indexes: A Brief Overview
In 2007, CRSP, an affiliate of the University of Chicago Booth School of Business, engaged with Vanguard to create a series of broad-based cap-weighted Index that eventually would be implemented on June 1, 2009. One unique feature of CRSP Indexes is "packeting," described in its methodology guide and this press release as follows:
CRSP’s capitalization-weighted methodology introduces the unique concept of “packeting,” which cushions the movement of stocks between adjacent indexes and allows holdings to be shared between two indexes of the same family. This approach maximizes style purity while minimizing index turnover.
The proof is in the pudding. According to the ETF Research Center , there is only a 4% overlap by weight between VUG and VTV. As a result, Vanguard investors can efficiently deploy capital to whatever style they feel is appropriate. You can accomplish the same with Schwab U.S. Large-Cap Growth ETF™ (SCHG) and Schwab U.S. Large-Cap Value ETF™ (SCHV), but you lose efficiency when you mix and match providers. There's a 12% overlap by weight with SCHG/VTV and 18% with SCHV/VUG.
Vanguard's Multi-Factor Model: Growth
VUG tracks the CRSP US Large Cap Growth Index, selecting large-cap securities based on six growth factors:
- Future Long-Term Earnings Per Share Growth
- Future Short-Term Earnings Per Share Growth
- Historical 3Y Earnings Per Share Growth
- Historical 3Y Sales Per Share Growth
- Current Investment-To-Assets Ratio
- Return on Assets.
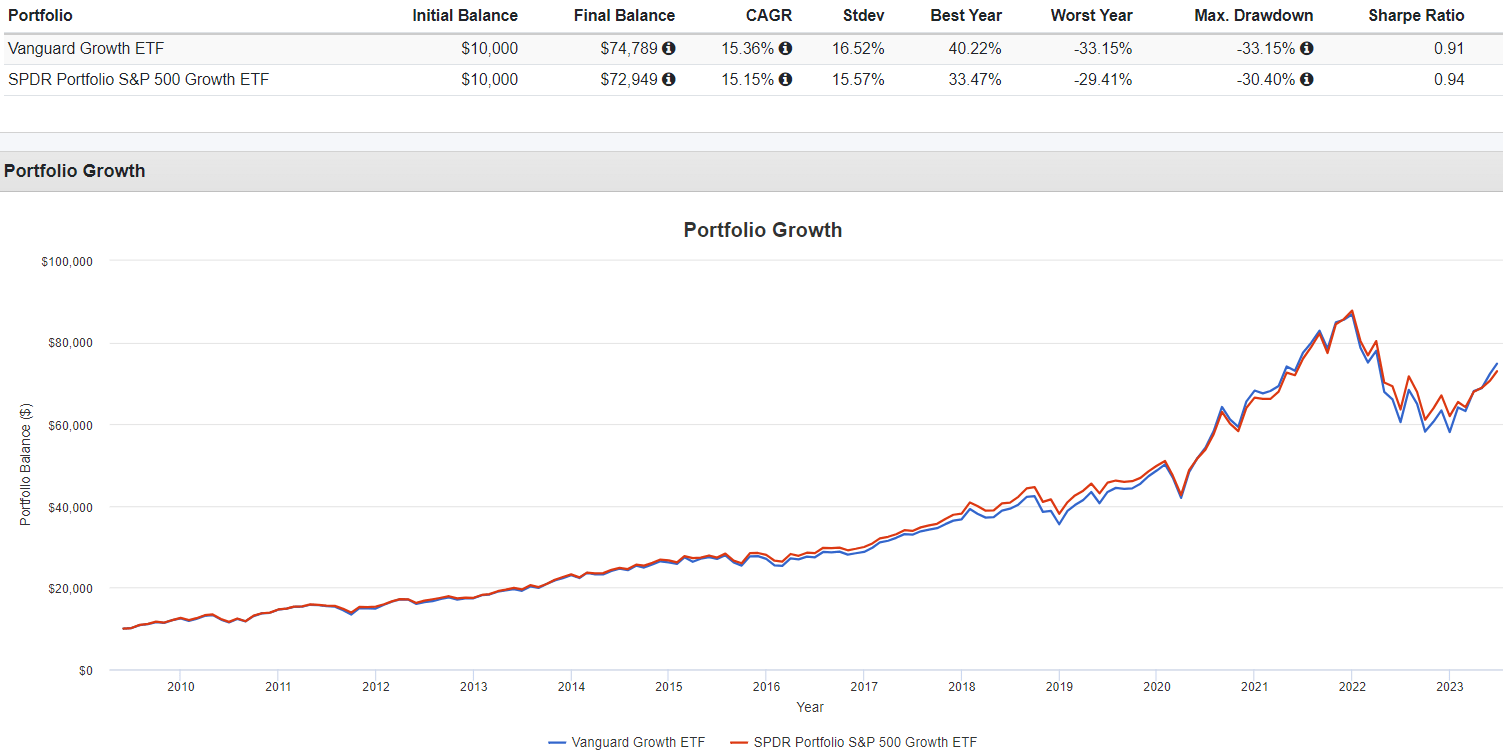
I like the mix of trailing and forward metrics, placing equal importance on historical growth and what analysts expect moving forward. This approach has yielded positive results and is also used by Schwab's SCHG. Since June 2009, it's outperformed the SPDR® Portfolio S&P 500 Growth ETF ( SPYG ) by an annualized 0.21%. Notably, S&P Style Indexes use only historical metrics.
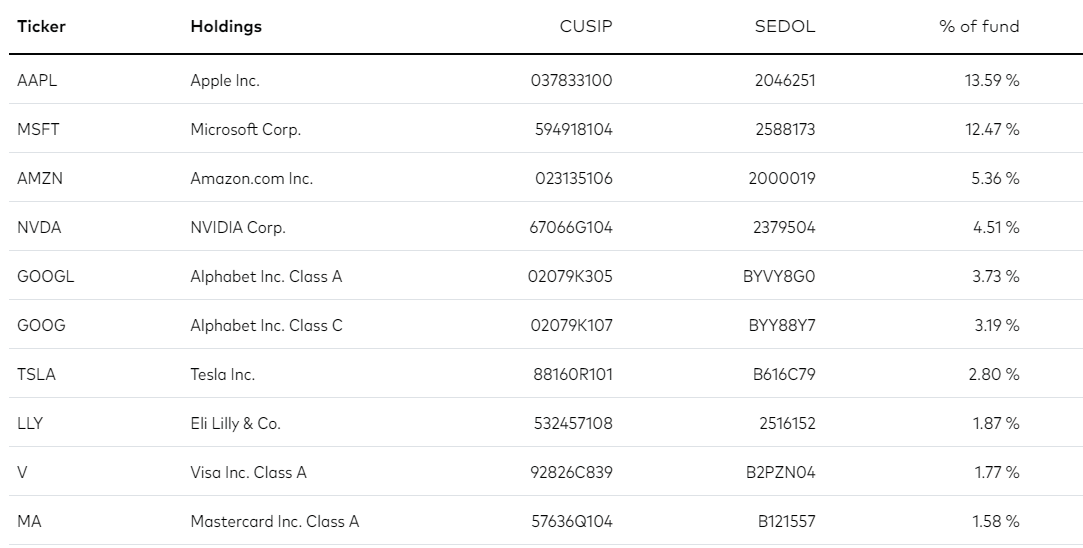
VUG's selection process results in a high concentration in mega-cap stocks like Apple ( AAPL ) and Microsoft ( MSFT ). Alphabet ( GOOGL , GOOG ), Amazon ( AMZN ), and NVIDIA ( NVDA ) round out the top five, as shown below.
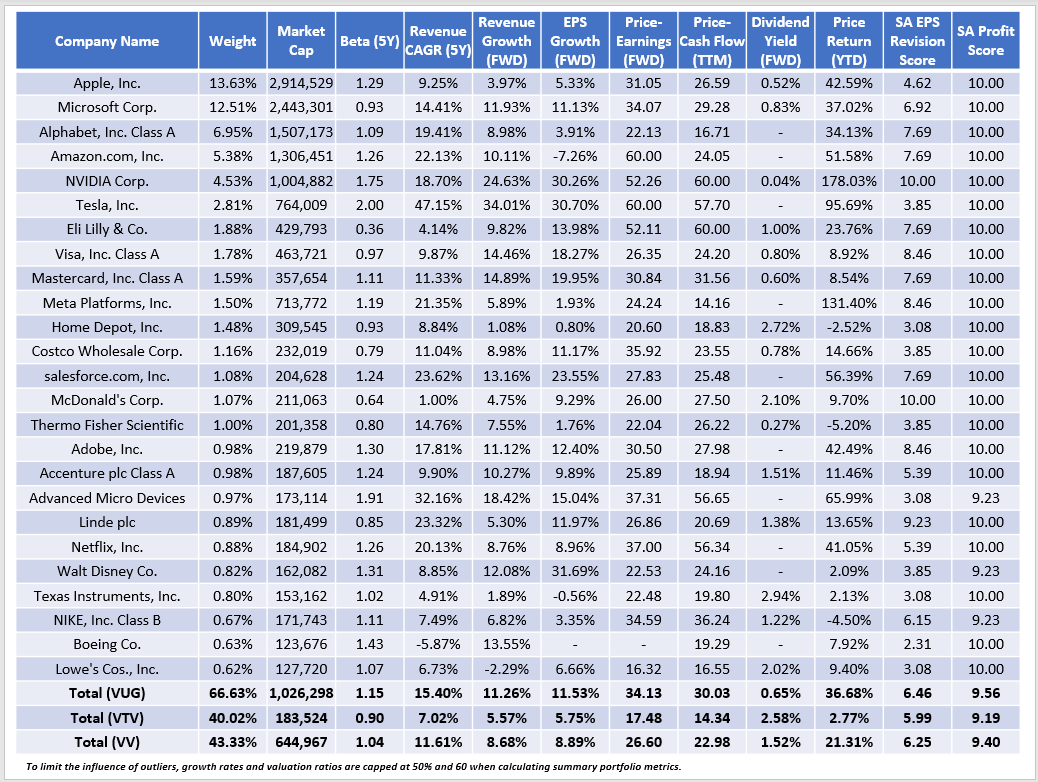
I've also calculated several fundamental metrics for VUG's top 25 holdings, which total 67% of the portfolio. For comparison purposes, summary metrics for VTV and VV are in the bottom rows.
VUG's $1.03 trillion weighted average market capitalization is substantially higher than VTV's $184 billion, as is its 1.15 five-year beta. As expected, VUG offers twice as much estimated sales and earnings per share growth as VTV but also features a twice as expensive valuation based on forward earnings and trailing cash flow. VUG's 0.65% dividend yield is negligible because most either pay below 2% or don't pay a dividend at all. Its 9.56/10 Profitability Score is excellent and suggests plenty of capacity to weather market storms.
Finally, VUG's price is up 28.36% YTD, but on a weighted average basis, it's up 36.68% due to the greater influence mega-cap stocks have compared to earlier in the year. VUG's better Seeking Alpha's EPS Revision Score suggests its outperformance over VTV is at least partially warranted, but the difference is now extreme. In my experience, taking some of these substantial profits off the table is rarely a mistake.
Vanguard's Multi-Factor Model: Value
VTV tracks the CRSP US Large Cap Value Index, selecting large-cap securities based on five value factors:
- Book-To-Price Ratio
- Future Earnings-To-Price Ratio
- Historical Earnings-To-Price Ratio
- Dividend-To-Price Ratio
- Sales-To-Price Ratio.
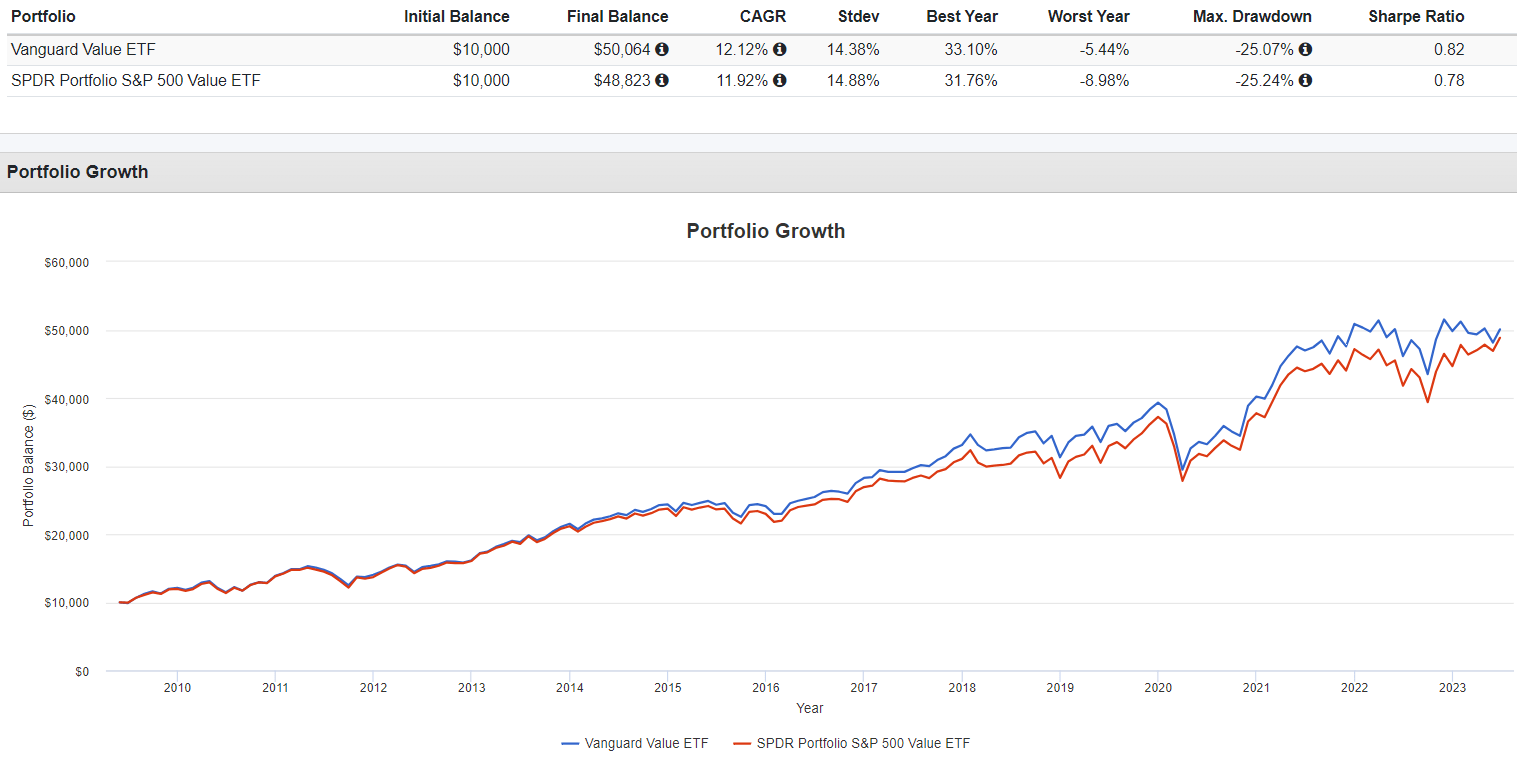
Again, we see a mix of trailing and forward metrics, but trailing metrics are more emphasized. Since June 2009, VTV has outperformed the SPDR® Portfolio S&P 500 Value ETF ( SPYV ) by an annualized 0.20%.
VTV's selection process results in a much less-concentrated top-ten list. The combined weighting for Berkshire Hathaway ( BRK.B ), UnitedHealth Group ( UNH ), Exxon Mobil ( XOM ), Johnson & Johnson ( JNJ ), and JPMorgan Chase ( JPM ) exceeds Apple's weighting in VUG by only 0.30%. However, the total free-float market capitalizations of VUG and VTV are relatively close at $21.5 trillion and $17.8 trillion, respectively.
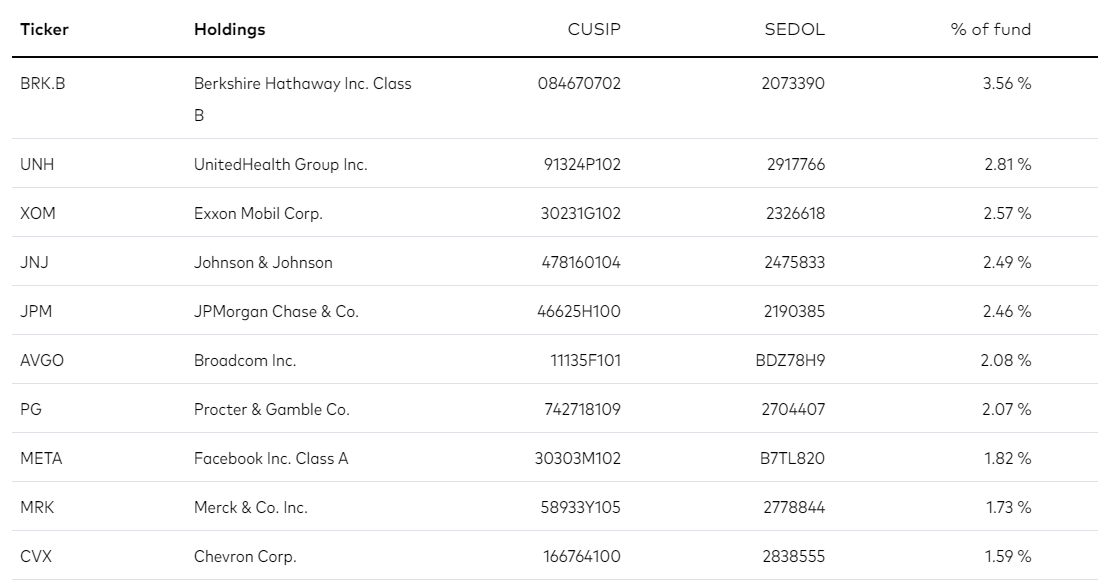
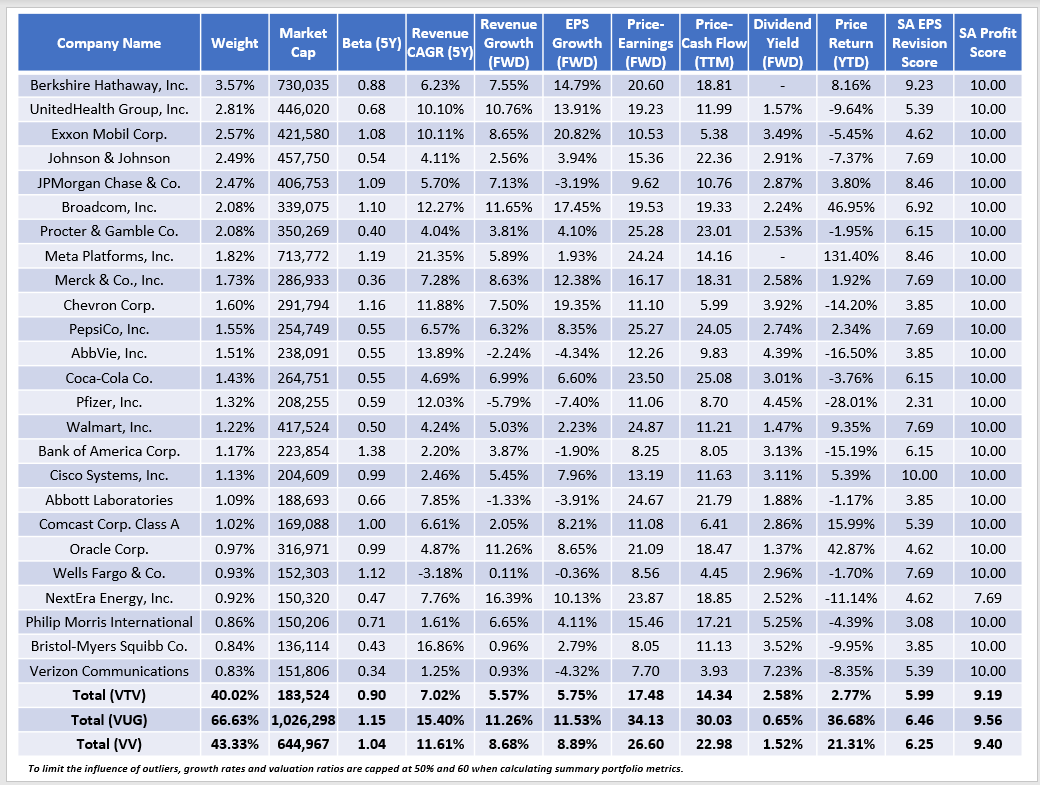
Like with VUG, I've also listed selected fundamentals for VTV's top 25 holdings below, totaling 40% of the portfolio. Berkshire Hathaway, UnitedHealth Group, and Exxon Mobil have excellent combinations of growth and value. Still, diversified bank stocks like JPMorgan Chase weigh down VTV's 5.75% estimated earnings per share growth rate. VUG doesn't hold any companies from this industry. Also, VUG avoids stocks in the Integrated Oil & Gas, Managed Health Care, and Electric Utilities industries, all prominent in VTV.
VV's metrics are almost perfectly between VTV and VUG, evidence that CRSP Style Indexes are thoughtfully designed. Even on metrics not screened for, like beta and five-year historical sales growth, VV looks like the perfect balance between the two.
Performance Analysis
Compounded Returns Since June 2009
The following table highlights the total returns for VUG and VTV since June 1, 2009, assuming all dividends were reinvested. I set rebalancing for the 50/50 Vanguard Growth/Value portfolio to occur annually.
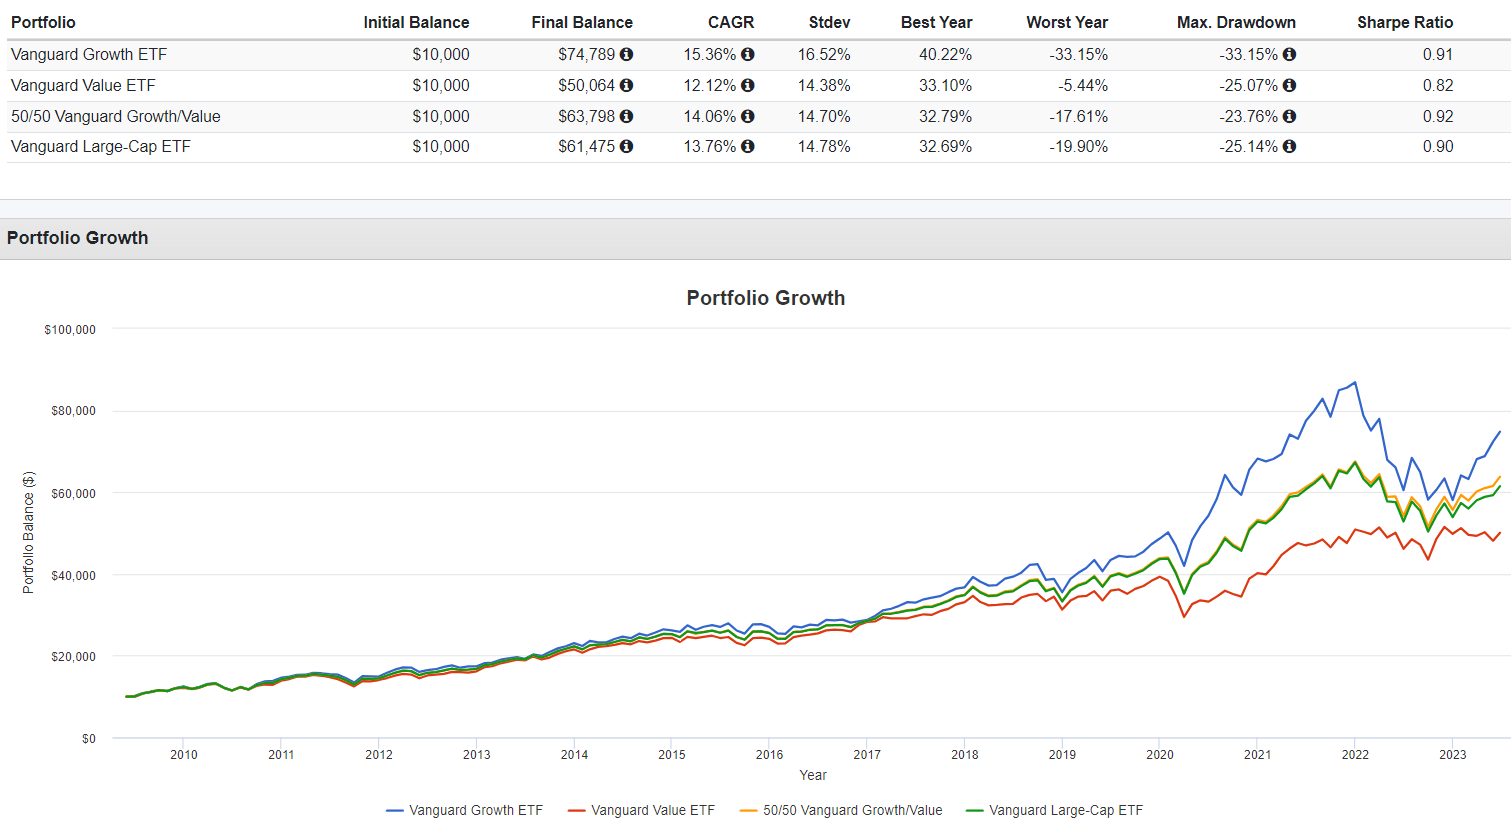
VUG outperformed VTV by 3.24% per year, but more importantly, the 50/50 portfolio outperformed VV by 0.28%. This result lays the foundation for this article: you can beat the market and increase flexibility by selecting two ETFs with opposing styles and low overlap. However, not all investors religiously rebalance their portfolios on a fixed schedule. It's only prudent to run some more simulations.
I compiled a matrix of annualized return differences with VV depending on when an investor could have implemented this 50/50 portfolio and how frequently they rebalanced. In this example, the nine rebalancing choices are:
- No Rebalancing
- Time-Based: Monthly
- Time-Based: Quarterly
- Time-Based: Semi-Annually
- Time-Based: Annually
- Tolerance Bands: +/- 2.5% (47.5-52.5%)
- Tolerance Bands: +/- 5.0% (45.0-55.0%)
- Tolerance Bands: +/- 7.5% (42.5-57.5%)
- Tolerance Bands: +/- 10.0% (40.0%-60.0%)
Time-based rebalancing occurs on a fixed schedule, but tolerance bands are an alternative method investors can use to control risk. For example, if your tolerance band is +/- 10%, you would only rebalance should either ETF reach 60% of the combined market value.
The Sunday Investor (Data Source: Portfolio Visualizer)
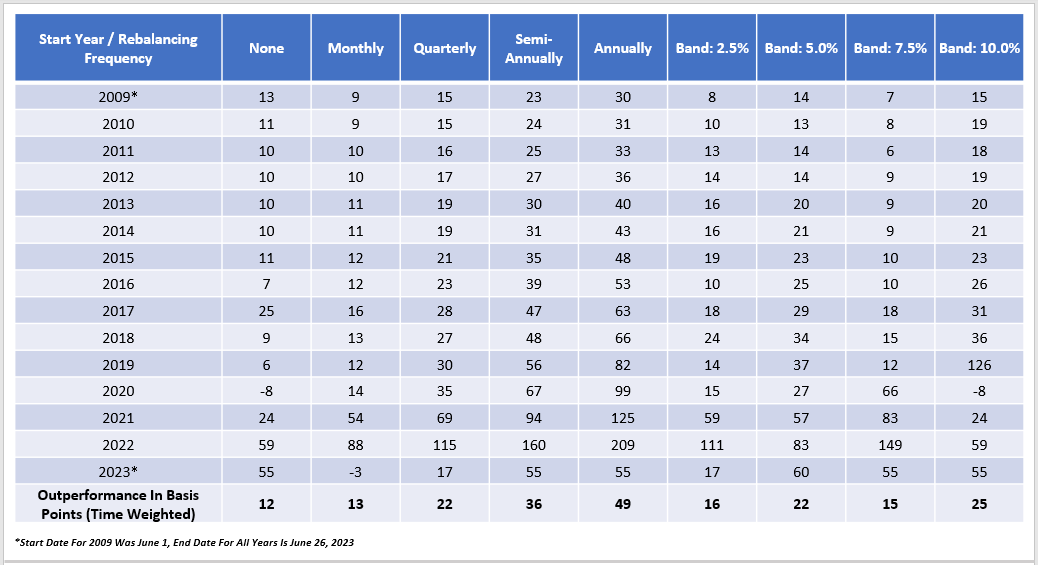
These results demonstrate little value in frequent rebalancing over the last 14.5 years. However, not rebalancing led to only a 12 basis point (0.12%) annualized outperformance on a time-weighted average basis. Annual rebalancing was the "sweet spot," delivering an annualized 0.49% outperformance, while semi-annual rebalancing and setting +/-10% band corridors (40-60% weightings) still produced solid results. Therefore, the first takeaway is that rebalancing is helpful, but you can overdo it. Consider any tax consequences, and understand that forgetting to rebalance each year likely won't materially impact your long-term returns.
The second takeaway is that the 50/50 split portfolio almost always outperformed VV. There are 135 data points in the table above, and there were only three instances where the strategy failed:
- No rebalancing between January 2020 and June 2023 produced a 10.21% annualized return for the split portfolio compared to 10.29% for VV.
- A +/- 10% corridor set between January 2020 and June 2023 produced the same results as above.
- Monthly rebalancing beginning January 2023 produced a 14.06% return for the split portfolio compared to 14.09% for VV.
VUG/VTV Fundamentals
I presented fundamental metrics for VUG and VTV's top 25 holdings earlier. The following table shows the same metrics for a 50/50 allocation between the two ETFs. In addition, I provided summary metrics for a 60/40 and 40/60 portfolio, should you have a style preference.
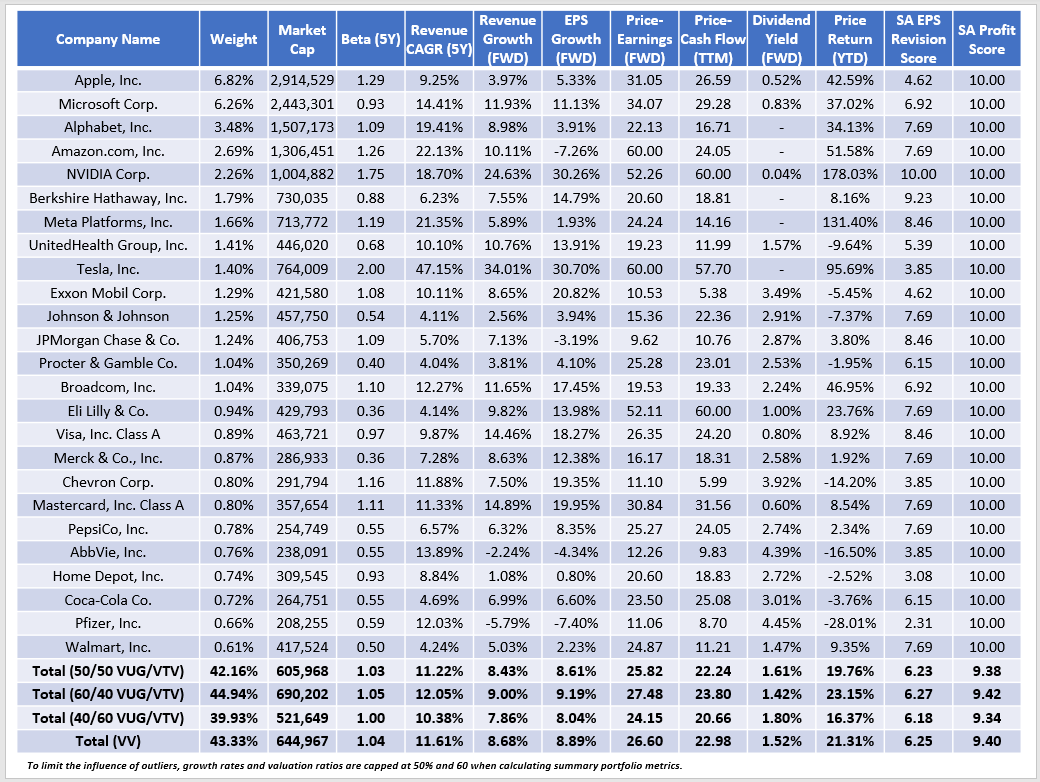
This portfolio's top five holdings are the same as VUG's, but the combined 21.50% weighting is precisely half of VUG's 43% and 2% less than VV's 23.50%. The result is a slight value lean, evident when comparing the other fundamental metrics. The 50/50 portfolio has about 0.25% less estimated sales and earnings growth but trades less than one point cheaper on forward earnings and trailing cash flow. Its gross dividend yield is 0.09% more (1.61% vs. 1.52%), but its constituents' share prices have gained about 1.50% more YTD. The Seeking Alpha Factor Scores, which I derived using individual Factor Grades, are nearly identical.
Investors may lean toward growth or value, but this analysis supports the concept that you don't need to worry about frequent rebalancing. Even a 10% shift towards growth or value results in approximately:
- +/- 2% concentration in the top 25 assets
- +/- $85 billion in weighted average market capitalization
- +/- 0.02 five-year beta points
- +/- 0.80% five-year historical sales growth
- +/- 0.60% estimated sales and earnings growth
- +/- 1-2 points on valuation (forward earnings and trailing cash flow)
- +/- 0.10% on dividend yield
- +/- 0.05/10 points on profitability.
Neither of these differences is material, but you can use them as guidelines for how aggressively you want to target a specific style. Today, I feel growth stocks are likely overvalued, so I support a higher weighting to VTV over VUG.
Investment Recommendation
This article demonstrated how long-term passive investors could use Vanguard's VUG and VTV to separate the market into growth and value segments and likely outperform the broader market. You'll also gain flexibility because VUG and VTV allow you to efficiently overweight a particular style without worrying about fund overlap. In addition, I confirmed how VV's fundamentals land almost perfectly between VUG and VTV, suggesting the two are polar opposite funds based on numerous metrics, including those not screened for by their respective CRSP Indexes.
I also determined that frequent rebalancing was unnecessary with this strategy. An annual rebalancing schedule was optimal, but even if you're late, my fundamental analysis revealed how even a 60/40 portfolio is reasonably close to the target 50/50 portfolio. Remember that after-tax returns are what counts, so try to avoid rebalancing just to satisfy an arbitrary policy.
Thank you for reading. I hope you found this analysis helpful, and if you have any questions or suggestions on other two-ETF solutions, please let me know in the comments section below.
For further details see:
VUG And VTV: How To Beat The Market With Vanguard's Growth And Value ETFs