CNM - Vulcan Value Partners Q1 2023 Letter
2023-05-18 02:35:00 ET
Summary
- Vulcan Value Partners are value investors - business analysts with a long-term time horizon focused on purchasing publicly traded companies that are competitively entrenched at significant discounts to intrinsic worth.
- All five of our strategies produced positive absolute returns and outperformed their respective benchmarks during the first quarter.
- We have made and will continue to make decisions that could negatively impact short-term performance when we think we can improve our prospective long-term returns and lower risk.
- We are pleased with how our businesses are responding to a more challenging economic environment.
Portfolio Review
General
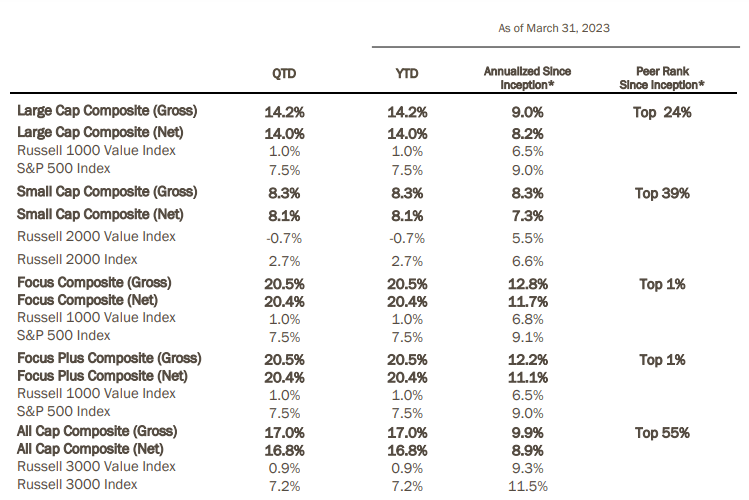
All five of our strategies produced positive absolute returns and outperformed their respective benchmarks during the first quarter. As we have often said, we place no weight on short-term results, good or bad. In fact, we have made and will continue to make decisions that could negatively impact short-term performance when we think we can improve our prospective long-term returns and lower risk. These results are detailed in the table below. Please reference additional performance information for each of the composites in the strategy reviews that follow and important disclosures at the end of this document.
As of March 31, 2023
*Inception date is 3/31/2007 for Large Cap, Small Cap, and Focus Plus Composites. Inception date is 11/30/2007 for Focus Composite. Inception date is 4/1/2011 for All Cap Composite. Past performance is no guarantee of future results. Please see important disclosures at the end of this document.
In the discussion that follows, we generally define material contributors and detractors as companies having a greater than 1% impact on the portfolio and should be viewed in context with the performance information provided. The specific securities identified and described are not representative of all the securities purchased, sold, or recommended for client accounts. It should not be assumed that an investment in the securities identified has or will be profitable. Actual holdings will vary for each client and there is no guarantee that a particular client’s account will hold any or all of the securities listed.
Vulcan Value Partners Large Cap Review
| As of March 31, 2023 |
| Investment Strategy |
| QTD |
| YTD |
| Annualized |
| 1 year |
| 3 year |
| 5 year |
| 10 year |
| Since Inception* |
| VVP Large Cap (Gross) |
| 14.2% |
| 14.2% |
| -17.6% |
| 11.2% |
| 5.4% |
| 9.0% |
| 9.0% |
| VVP Large Cap (Net) |
| 14.0% |
| 14.0% |
| -18.1% |
| 10.5% |
| 4.8% |
| 8.3% |
| 8.2% |
| Russell 1000 Value Index |
| 1.0% |
| 1.0% |
| -5.9% |
| 17.9% |
| 7.5% |
| 9.1% |
| 6.5% |
| S&P 500 Index |
| 7.5% |
| 7.5% |
| -7.7% |
| 18.6% |
| 11.2% |
| 12.2% |
| 9.0% |
*Inception Date March 31, 2007
We purchased two new positions: InterContinental Hotels Group plc ( IHG ) and United Parcel Service Inc. ( UPS ).
We exited one position during the quarter: GE HealthCare Technologies Inc. ( GEHC ).
There were seven material contributors to performance: Salesforce Inc. ( CRM ), General Electric Company ( GE ), Microsoft Corp. ( MSFT ), Skyworks Solutions Inc. ( SWKS ), Amazon.com Inc. ( AMZN ), TransDigm Group Inc. ( TDG ), and Applied Materials Inc. ( AMAT ).
There were no material detractors.
During the quarter, we purchased InterContinental Hotels Group, a company we have owned in the past. IHG is the world’s third largest hotel chain with more than 6,000 hotels in more than 100 countries across 18 brands, including Holiday Inn & Holiday Inn Express, InterContinental, and Crowne Plaza. IHG has strong brand recognition, the industry’s third largest loyalty program, and global scale. Growth in net rooms is driven by a long-term trend of consolidation around large hotel brands. We admire its asset-light business model where 99% of profits are derived from its managed and franchised hotels, while less than 1% of profits come from its owned and leased hotels portfolio. Long-term revenue per available room (RevPAR) growth is being driven by a rising global middle class with a desire to travel. IHG has a robust pipeline of approximately 280,000 rooms of which 40% are currently under construction. We had the opportunity to purchase IHG again as concerns around a macroeconomic downturn and a long-term impairment of business travel have negatively impacted the company’s stock price. Even after taking these headwinds into account, we believe we own the company with a margin of safety.
We purchased United Parcel Service ( UPS ) during the quarter. UPS is a global parcel shipment and logistics company which competes in a global oligopoly with high barriers to entry. UPS’ integrated network is more efficient than its closest peer, as evidenced by its margin profile, free cash flow conversion, and returns on invested capital. The company’s management team is focusing on profitable growth through its Better, not Bigger strategy which should improve margins and future opportunities for the company. The stock price was down due to market concerns about customer concentration and Amazon’s potential entry into the parcel delivery and logistics market. Additionally, UPS Teamsters’ labor agreement expires on July 31, 2023. The market fears a potential labor strike, significant wage inflation, and shippers moving volume to competitors due to concerns around potential service disruptions. We have incorporated these risks into our value, and we believe its stock price is still discounted.
We sold GE HealthCare Technologies during the quarter. GE HealthCare is a recent spin-off from General Electric Company and provides imaging, ultrasound, patient care solutions and pharmaceutical diagnostics to customers around the world. The company is a leader in a global oligopoly and has a massive installed base. Half of the company’s revenue is recurring, margins are stable to rising, and it generates significant free cash flow. As a recent operating unit inside of GE, we believe the market has been undervaluing this asset. Although the spin price reflected this under-valuation, after the spin-off, its stock price rose to meet our estimate of its intrinsic value, and we sold the position. GE HealthCare remains on our MVP list.
Salesforce was a material contributor during the quarter. The company has taken numerous positive steps to increase profitability more quickly than expected. Salesforce also improved its corporate governance by recommending three new board members. The company is focused on improving margins, deemphasizing acquisitions, and has expanded its stock buyback plan from $10 billion to $20 billion. We believe Salesforce can pursue these opportunities while continuing to increase its competitive position.
General Electric was a material contributor during the quarter. With the successful spin-off of GE HealthCare in early January, the company operates in two major markets: GE Aerospace and GE Vernova. GE Aerospace powers three out of every four commercial flights. GE Vernova helps generate 30% of the world’s electricity and has a meaningful role to play in the energy transition. The company’s service activities, which are higher margin and more resilient, represent approximately 60% of revenue and 85% of its backlog. The company reported strong fourth quarter 2022 results and management’s 2023 outlook is positive.
Microsoft was a material contributor during the quarter. Microsoft came in at the top of revenue guidance within its Intelligent Cloud and Productivity and Business Processes segments, whereas its More Personal Computing segment revenue fell short of guidance. The company guided to continued weakness in More Personal Computing next quarter. Azure’s growth decelerated in this quarter, and the company guided Azure to decelerate further next quarter. To offset some of these headwinds, the company is focused on managing expenses to preserve margins. We think an underappreciated strength of Microsoft’s business model is that not only are its products designed to work together, it is more economical for the customer when multiple products are bundled together, which is appealing to customers during economic troubles. We think this bundling approach positions Microsoft well to gain share at the expense of less well positioned competitors during times of economic stress. In addition to the macro environment and the company’s operating results, during the quarter there were announcements around ChatGPT and OpenAI, including Microsoft’s partnership with and investment in OpenAI. This is a complex and rapidly developing opportunity for Microsoft. Overall, what we think this quarter shows is the competitive advantages of Microsoft’s deep competencies in its existing businesses and its optionality from future opportunities.
Applied Materials was a material contributor during the quarter. Despite a difficult environment, equipment revenue increased double digits. The company’s growth was supported by a nearly $20 billion backlog and strength in their lagging edge portfolio, driven by growth in semiconductor content for automotive, communications, sensors, and Internet of Things (IoT) end markets. Applied Materials also announced the promising new Centura Sculpa patterning system. This equipment will allow its customers to reduce their reliance on expensive EUV “double patterning”, which we believe will allow Applied Materials to gain share of the overall wafer fab equipment market. While we expect 2023 will be a down year for semiconductor capital equipment, we expect Applied Materials to return to growth in 2024. Overall, we feel positive about the company’s long-term outlook.
Additionally, Skyworks Solutions, Amazon, and TransDigm Group were all material contributors during the quarter. We have discussed these companies at length in prior letters. Skyworks Solutions has been successful at utilizing its advancement in cellular connectivity in other end markets such as the Internet of Things. Despite slowing growth and macro headwinds, Amazon experienced revenue growth in all three segments: AWS, Advertising, and Retail. Amazon is also addressing its cost structure to better align with its slower growth rates. We believe Amazon is a dominant, world-class company with powerful secular tailwinds. TransDigm Group reported strong results during the quarter including an increase in revenue, and the company positively revised its outlook for the year. All three of these companies are executing well, their theses are intact, and we are pleased to own them at a discount to our estimate of intrinsic value.
Vulcan Value Partners Small Cap Review
| As of March 31, 2023 |
| Investment Strategy |
| QTD |
| YTD |
| Annualized |
| 1 year |
| 3 year |
| 5 year |
| 10 year |
| Since Inception* |
| VVP Small Cap (Gross) |
| 8.3% |
| 8.3% |
| -23.1% |
| 15.2% |
| 1.0% |
| 6.3% |
| 8.3% |
| VVP Small Cap (Net) |
| 8.1% |
| 8.1% |
| -23.8% |
| 14.2% |
| 0.1% |
| 5.4% |
| 7.3% |
| Russell 2000 Value Index |
| -0.7% |
| -0.7% |
| -13.0% |
| 21.0% |
| 4.5% |
| 7.2% |
| 5.5% |
| Russell 2000 Index |
| 2.7% |
| 2.7% |
| -11.6% |
| 17.5% |
| 4.7% |
| 8.0% |
| 6.6% |
*Inception Date March 31, 2007
We purchased four new positions during the quarter: Curtiss-Wright Corp. ( CW ), Acuity Brands Inc. ( AYI ), Core & Main Inc. ( CNM ), and Sealed Air Corp. ( SEE ).
We exited one position during the quarter: Sleep Number Corp. ( SNBR ).
There was one material contributor to performance: Littelfuse Inc. ( LFUS ).
There were no material detractors.
We purchased Curtiss-Wright, a company we have owned a number of times over the last decade. The company is a leading provider of highly engineered and mission critical technologies across aerospace and defense, commercial power, and process and industrial markets. These technologies range from propulsion equipment for nuclear submarines to electronics used on aircraft carriers and commercial planes to sensors used in general industrial applications. We have long been attracted to Curtiss-Wright’s deep technical expertise, where it holds either the number one or number two positions in the industry across the majority of its niche markets. Two-thirds of its end market exposure is in the aerospace and defense market, with the remainder being tied to commercial markets. Within defense, Curtiss-Wright maintains stable positions with long-term visibility on key U.S. platforms such as aircraft carriers, submarines, and fighter jets. These stable positions are reinforced by the fact that over 50% of its defense revenue is derived from sole source positions. In our opinion, strong secular trends continue to provide tailwinds to its defense business as elevated geopolitical risk is driving urgency for global defense spending and strong shipbuilding activity.
Acuity Brands is the leading provider of lighting and building management solutions in North America. The company’s competitive moat is its scale in manufacturing, distribution, product breadth, product innovation, supply chain, customer servicing and some exclusive supply agreements. Acuity has been able to increase prices to pass through cost increases. Gross margins have been stable in the 40% range for several years. Acuity generates significant free cash flow. We believe the management team are good capital allocators, and the company has repurchased 20% of outstanding shares since 2020.
Core & Main is a national distributor of water, wastewater, storm drainage and fire protection products to municipalities and contractors across municipal, residential, and non-residential end markets. It is one of two national distributors in the U.S. operating in an otherwise fragmented market. Core & Main holds market share in the mid-teens while approximately 70% of the market is served by regional and mom-and-pop distributors. The company’s competitive advantages include national scale, buying power, and sticky customer relationships. America’s aging water infrastructure provides a tailwind. The country’s average pipe age is 45 years, up from 25 years in 1970, and it is estimated that the U.S. needs to spend $2.2 trillion over the next 20 years in upgrades. We think the company is well positioned to benefit from these tailwinds.
Sealed Air is a global protective packaging company operating in the food and beverage, industrial, and e-commerce markets. The company sells both packaging equipment and consumable packaging. Sealed Air has a strong market position with leading technology and brands. In the food and beverage market, the Cryovac brand is the gold standard for packaging and shipping fresh, uncooked proteins. Food safety is critically important, and customers are willing to pay for quality and reliability. Additionally, switching costs are high and customer relationships are typically sticky and long term in nature. Sealed Air’s brands in e-commerce and industrial include Bubble Wrap and Instapax, and the competitive advantages in these markets are largely similar.
We sold Sleep Number during the quarter. In late January, Sleep Number announced that the CFO, David Callen, was stepping down to pursue other opportunities. We respected David Callen as a key leader. Sleep Number has an elevated level of debt combined with ongoing supply issues and a likely tough macro environment. The abrupt departure of David Callen within this environment concerned us, and we exited the position.
Littelfuse was a material contributor during the quarter. The company reported favorable results. Margins for the electronics business are elevated compared to the company’s normal targets due to effective price and cost management. Littelfuse’s M&A pipeline is robust, and the company continues to perform well.
Vulcan Value Partners Focus Review
| As of March 31, 2023 |
| Investment Strategy |
| QTD |
| YTD |
| Annualized |
| 1 year |
| 3 year |
| 5 year |
| 10 year |
| Since Inception* |
| VVP Focus (Gross) |
| 20.5% |
| 20.5% |
| -7.6% |
| 21.6% |
| 16.9% |
| 14.5% |
| 12.8% |
| VVP Focus (Net) |
| 20.4% |
| 20.4% |
| -8.0% |
| 21.1% |
| 16.2% |
| 13.7% |
| 11.7% |
| Russell 1000 Value Index |
| 1.0% |
| 1.0% |
| -5.9% |
| 17.9% |
| 7.5% |
| 9.1% |
| 6.8% |
| S&P 500 Index |
| 7.5% |
| 7.5% |
| -7.7% |
| 18.6% |
| 11.2% |
| 12.2% |
| 9.1% |
*Inception Date November 30, 2007
We exited one position during the quarter: GE HealthCare Technologies Inc.
There were eight material contributors to performance: Salesforce, Inc., General Electric Company, Microsoft Corp., Skyworks Solutions Inc., Amazon.com Inc., Alphabet Inc. ( GOOG )( GOOGL ), KKR & Co. Inc. ( KKR ), and TransDigm Group Inc.
There were no material detractors.
We sold GE HealthCare Technologies during the quarter. GE HealthCare is a recent spin-off from General Electric Company and provides imaging, ultrasound, patient care solutions and pharmaceutical diagnostics to customers around the world. The company is a leader in a global oligopoly and has a massive installed base. Half of the company’s revenue is recurring, margins are stable to rising, and it generates significant free cash flow. As a recent operating unit inside of GE, we believe the market has been undervaluing this asset. Although the spin price reflected this under-valuation, after the spin-off, its stock price rose to meet our estimate of its intrinsic value, and we sold the position. GE HealthCare remains on our MVP list.
Salesforce was a material contributor during the quarter. The company has taken numerous positive steps to increase profitability more quickly than expected. Salesforce also improved its corporate governance by recommending three new board members. The company is focused on improving margins, deemphasizing acquisitions, and has expanded its stock buyback plan from $10 billion to $20 billion. We believe Salesforce can pursue these opportunities while continuing to increase its competitive position.
General Electric was a material contributor during the quarter. With the successful spin-off of GE HealthCare in early January, the company operates in two major markets: GE Aerospace and GE Vernova. GE Aerospace powers three out of every four commercial flights. GE Vernova helps generate 30% of the world’s electricity and has a meaningful role to play in the energy transition. The company’s service activities, which are higher margin and more resilient, represent approximately 60% of revenue and 85% of its backlog. The company reported strong fourth quarter 2022 results and management’s 2023 outlook is positive.
Microsoft was a material contributor during the quarter. Microsoft came in at the top of revenue guidance within its Intelligent Cloud and Productivity and Business Processes segments, whereas its More Personal Computing segment revenue fell short of guidance. The company guided to continued weakness in More Personal Computing next quarter. Azure’s growth decelerated in this quarter, and the company guided Azure to decelerate further next quarter. To offset some of these headwinds, the company is focused on managing expenses to preserve margins. We think an underappreciated strength of Microsoft’s business model is that not only are its products designed to work together, it is more economical for the customer when multiple products are bundled together, which is appealing to customers during economic troubles. We think this bundling approach positions Microsoft well to gain share at the expense of less well positioned competitors during times of economic stress. In addition to the macro environment and the company’s operating results, during the quarter there were announcements around ChatGPT and OpenAI, including Microsoft’s partnership with and investment in OpenAI. This is a complex and rapidly developing opportunity for Microsoft. Overall, what we think this quarter shows is the competitive advantages of Microsoft’s deep competencies in its existing businesses and its optionality from future opportunities.
Additionally, Skyworks Solutions, Amazon, Alphabet, KKR & Co., and TransDigm Group were all material contributors during the quarter. We have discussed these companies at length in prior letters. Skyworks Solutions has been successful at utilizing its advancement in cellular connectivity in other end markets such as the Internet of Things. Despite slowing growth and macro headwinds, Amazon experienced revenue growth in all three segments: AWS, Advertising, and Retail. Amazon is also addressing its cost structure to better align with its slower growth rates. We believe Amazon is a dominant, world-class company with powerful secular tailwinds. Alphabet reported mixed results in a tough environment. The company is working to adjust its cost structure in light of the current macroeconomic environment. KKR is a leading alternative asset manager that reported mixed results in a challenging environment. Their breadth of products and flexibility to invest across the capital spectrum should serve them well regardless of the macro environment. TransDigm Group reported strong results during the quarter including an increase in revenue, and the company positively revised its outlook for the year. All of these companies are executing well, their theses are intact, and we are pleased to own them at a discount to our estimate of intrinsic value.
Vulcan Value Partners Focus Plus Review
| As of March 31, 2023 |
| Investment Strategy |
| QTD |
| YTD |
| Annualized |
| 1 year |
| 3 year |
| 5 year |
| 10 year |
| Since Inception* |
| VVP Focus Plus (Gross) |
| 20.5% |
| 20.5% |
| -7.5% |
| 21.8% |
| 17.0% |
| 14.6% |
| 12.2% |
| VVP Focus Plus (Net) |
| 20.4% |
| 20.4% |
| -7.8% |
| 20.8% |
| 16.0% |
| 13.7% |
| 11.1% |
| Russell 1000 Value Index |
| 1.0% |
| 1.0% |
| -5.9% |
| 17.9% |
| 7.5% |
| 9.1% |
| 6.5% |
| S&P 500 Index |
| 7.5% |
| 7.5% |
| -7.7% |
| 18.6% |
| 11.2% |
| 12.2% |
| 9.0% |
*Inception Date March 31, 2007
We did not write any options contracts during the quarter. We use options to lower risk. Equity-like returns are possible when option prices reflect higher levels of implied volatility. If exercised, these options give us the right to purchase stakes in companies we want to own at a lower price than the market price at the time the option was written. We would like for these options to be exercised and set aside cash for that purpose. We employ no leverage. In effect, we are being paid while we wait for lower prices and a corresponding larger margin of safety. We also use options to exit positions. Generally, we write covered calls with the strike price being our estimate of fair value. As with our puts, we are being paid to do something we would do anyway at a given price.
We exited one position during the quarter: GE HealthCare Technologies Inc.
There were eight material contributors to performance: Salesforce, Inc., General Electric Company, Microsoft Corp., Skyworks Solutions Inc., Amazon.com Inc., Alphabet Inc., KKR & Co. Inc., and TransDigm Group Inc.
There were no material detractors.
We sold GE HealthCare Technologies during the quarter. GE HealthCare is a recent spin-off from General Electric Company and provides imaging, ultrasound, patient care solutions and pharmaceutical diagnostics to customers around the world. The company is a leader in a global oligopoly and has a massive installed base. Half of the company’s revenue is recurring, margins are stable to rising, and it generates significant free cash flow. As a recent operating unit inside of GE, we believe the market has been undervaluing this asset. Although the spin price reflected this under-valuation, after the spin-off, its stock price rose to meet our estimate of its intrinsic value, and we sold the position. GE HealthCare remains on our MVP list.
Salesforce was a material contributor during the quarter. The company has taken numerous positive steps to increase profitability more quickly than expected. Salesforce also improved its corporate governance by recommending three new board members. The company is focused on improving margins, deemphasizing acquisitions, and has expanded its stock buyback plan from $10 billion to $20 billion. We believe Salesforce can pursue these opportunities while continuing to increase its competitive position.
General Electric was a material contributor during the quarter. With the successful spin-off of GE HealthCare in early January, the company operates in two major markets: GE Aerospace and GE Vernova. GE Aerospace powers three out of every four commercial flights. GE Vernova helps generate 30% of the world’s electricity and has a meaningful role to play in the energy transition. The company’s service activities, which are higher margin and more resilient, represent approximately 60% of revenue and 85% of its backlog. The company reported strong fourth quarter 2022 results and management’s 2023 outlook is positive.
Microsoft was a material contributor during the quarter. Microsoft came in at the top of revenue guidance within its Intelligent Cloud and Productivity and Business Processes segments, whereas its More Personal Computing segment revenue fell short of guidance. The company guided to continued weakness in More Personal Computing next quarter. Azure’s growth decelerated in this quarter, and the company guided Azure to decelerate further next quarter. To offset some of these headwinds, the company is focused on managing expenses to preserve margins. We think an underappreciated strength of Microsoft’s business model is that not only are its products designed to work together, it is more economical for the customer when multiple products are bundled together, which is appealing to customers during economic troubles. We think this bundling approach positions Microsoft well to gain share at the expense of less well positioned competitors during times of economic stress. In addition to the macro environment and the company’s operating results, during the quarter there were announcements around ChatGPT and OpenAI, including Microsoft’s partnership with and investment in OpenAI. This is a complex and rapidly developing opportunity for Microsoft. Overall, what we think this quarter shows is the competitive advantages of Microsoft’s deep competencies in its existing businesses and its optionality from future opportunities.
Additionally, Skyworks Solutions, Amazon, Alphabet, KKR & Co., and TransDigm Group were all material contributors during the quarter. We have discussed these companies at length in prior letters. Skyworks Solutions has been successful at utilizing its advancement in cellular connectivity in other end markets such as the Internet of Things. Despite slowing growth and macro headwinds, Amazon experienced revenue growth in all three segments: AWS, Advertising, and Retail. Amazon is also addressing its cost structure to better align with its slower growth rates. We believe Amazon is a dominant, world-class company with powerful secular tailwinds. Alphabet reported mixed results in a tough environment. The company is working to adjust its cost structure in light of the current macroeconomic environment. KKR is a leading alternative asset manager that reported mixed results in a challenging environment. Their breadth of products and flexibility to invest across the capital spectrum should serve them well regardless of the macro environment. TransDigm Group reported strong results during the quarter including an increase in revenue, and the company positively revised its outlook for the year. All of these companies are executing well, their theses are intact, and we are pleased to own them at a discount to our estimate of intrinsic value.
Vulcan Value Partners All Cap Review
| As of March 31, 2023 |
| Investment Strategy |
| QTD |
| YTD |
| Annualized |
| 1 year |
| 3 year |
| 5 year |
| 10 year |
| Since Inception* |
| VVP All Cap (Gross) |
| 17.0% |
| 17.0% |
| -20.8% |
| 11.7% |
| 4.3% |
| 8.4% |
| 9.9% |
| VVP All Cap (Net) |
| 16.8% |
| 16.8% |
| -21.4% |
| 10.8% |
| 3.5% |
| 7.5% |
| 8.9% |
| Russell 3000 Value Index |
| 0.9% |
| 0.9% |
| -6.3% |
| 18.1% |
| 7.3% |
| 9.0% |
| 9.3% |
| Russell 3000 Index |
| 7.2% |
| 7.2% |
| -8.6% |
| 18.5% |
| 10.4% |
| 11.7% |
| 11.5% |
*Inception Date April 1, 2011
We purchased one new position during the quarter: Ares Management Corp. ( ARES ).
We exited one position during the quarter: GE HealthCare Technologies Inc.
There were six material contributors to performance: Salesforce, Inc., General Electric Company, Microsoft Corp., Amazon.com Inc., Skyworks Solutions Inc., and TransDigm Group Inc.
There were no material detractors.
Ares Management Corp., is a global, diversified alternative asset manager with a focus on credit and debt funds. Among alternative asset managers, Ares has a leading market share in credit products. These credit products generate fee-related revenue, which we believe translates to stable earnings power. Ares is benefiting from increasing investor demand for private credit assets. According to industry data, the gap between current and target allocations for institutions is wider for private credit than for private equity, implying that private credit has substantial opportunity for growth. Ares has generated strong historical returns in private credit. Demand for private credit funding has increased from private equity sponsors, who are Ares’s primary customers. This increased demand has resulted in market share gains for private credit against the banks and public markets, and we believe that trend will continue. We think that scale and relationships are Ares’ most important competitive advantages and, to the extent these advantages lead to strong returns, this should lead to continued growth in AUM. The alternative asset management space is competitive, but we believe that Ares is well positioned.
We sold GE HealthCare Technologies during the quarter. GE HealthCare is a recent spin-off from General Electric Company and provides imaging, ultrasound, patient care solutions and pharmaceutical diagnostics to customers around the world. The company is a leader in a global oligopoly and has a massive installed base. Half of the company’s revenue is recurring, margins are stable to rising, and it generates significant free cash flow. As a recent operating unit inside of GE, we believe the market has been undervaluing this asset. Although the spin price reflected this under-valuation, after the spin-off, its stock price rose to meet our estimate of its intrinsic value, and we sold the position. GE HealthCare remains on our MVP list.
Salesforce was a material contributor during the quarter. The company has taken numerous positive steps to increase profitability more quickly than expected. Salesforce also improved its corporate governance by recommending three new board members. The company is focused on improving margins, deemphasizing acquisitions, and has expanded its stock buyback plan from $10 billion to $20 billion. We believe Salesforce can pursue these opportunities while continuing to increase its competitive position.
General Electric was a material contributor during the quarter. With the successful spin-off of GE HealthCare in early January, the company operates in two major markets: GE Aerospace and GE Vernova. GE Aerospace powers three out of every four commercial flights. GE Vernova helps generate 30% of the world’s electricity and has a meaningful role to play in the energy transition. The company’s service activities, which are higher margin and more resilient, represent approximately 60% of revenue and 85% of its backlog. The company reported strong fourth quarter 2022 results and management’s 2023 outlook is positive.
Microsoft was a material contributor during the quarter. Microsoft came in at the top of revenue guidance within its Intelligent Cloud and Productivity and Business Processes segments, whereas its More Personal Computing segment revenue fell short of guidance. The company guided to continued weakness in More Personal Computing next quarter. Azure’s growth decelerated in this quarter, and the company guided Azure to decelerate further next quarter. To offset some of these headwinds, the company is focused on managing expenses to preserve margins. We think an underappreciated strength of Microsoft’s business model is that not only are its products designed to work together, it is more economical for the customer when multiple products are bundled together, which is appealing to customers during economic troubles. We think this bundling approach positions Microsoft well to gain share at the expense of less well positioned competitors during times of economic stress. In addition to the macro environment and the company’s operating results, during the quarter there were announcements around ChatGPT and OpenAI, including Microsoft’s partnership with and investment in OpenAI. This is a complex and rapidly developing opportunity for Microsoft. Overall, what we think this quarter shows is the competitive advantages of Microsoft’s deep competencies in its existing businesses and its optionality from future opportunities.
Additionally, Amazon, Skyworks Solutions, and TransDigm Group were all material contributors during the quarter. We have discussed these companies at length in prior letters. Despite slowing growth and macro headwinds, Amazon experienced revenue growth in all three segments: AWS, Advertising, and Retail. Amazon is also addressing its cost structure to better align with its slower growth rates. We believe Amazon is a dominant, world-class company with powerful secular tailwinds. Skyworks Solutions has been successful at utilizing its advancement in cellular connectivity in other end markets such as the Internet of Things. TransDigm Group reported strong results during the quarter including an increase in revenue, and the company positively revised its outlook for the year. All three of these companies are executing well, their theses are intact, and we are pleased to own them at a discount to our estimate of intrinsic value.
Closing
We are pleased with this quarter’s results. We believe that we own a collection of competitively entrenched businesses that can compound their values over our long-term time horizon.
The macroeconomic environment is challenging, and the risk of recession has increased. We are cautious in our own projections, and our values reflect that conservatism. We are pleased with how our businesses are responding to a more challenging economic environment. We own businesses with a margin of safety in terms of price compared to our estimate of intrinsic worth. We have a long-term investment horizon, and short-term headwinds can create opportunities for long-term investors.
Thank you for your partnership and shared long-term time horizon. We look forward to updating you next quarter.
The Vulcan Value Partners Investment Team,
C.T. Fitzpatrick, CFA, McGavock Dunbar, CFA, F. Hampton McFadden, Jr., CFA, Stephen W. Simmons, CFA, Colin Casey
The table below summarizes preliminary peer ranking performance information for Vulcan Composite net returns from the quarter following the relevant composite’s inception through March 31, 2023. This information is paid for by Vulcan and sourced from eVestment as of April 18, 2023. Vulcan Value Partners Large Cap, Focus and Focus Plus Composites are compared to eVestment’s US Large Cap Value Equity Universe (180 observations), Vulcan Value Partners Small Cap Composite is compared to eVestment’s US Small Cap Value Equity Universe (118 observations) and Vulcan Value Partners All Cap Composite is compared to eVestment’s US All Cap Value Equity Universe (63 observations). Past performance is no guarantee of future results. Please see important disclosures at the end of this document.
*Inception date is 3/31/2007 for Large Cap, Small Cap, and Focus Plus Composites. Inception date is 11/30/2007 for Focus Composite. Inception date is 4/1/2011 for All Cap Composite. Past performance is no guarantee of future results. Please see important disclosures at the end of this document.
Disclosures
Vulcan Value Partners LLC is an investment advisor registered with the Securities and Exchange Commission under the Investment Advisers Act of 1940.
Registration does not imply a certain level of skill or training. The performance presented is for our Large Cap Composite, Focus Composite, Focus Plus Composite, Small Cap Composite, and All Cap Composite. The model composite portfolio performance figures reflect the deduction of brokerage or other commissions and the reinvestment of dividends and capital gains. We have presented returns gross and net of fees. Gross of fees returns are calculated gross of management and custodial fees and net of transaction costs. Net of fees returns are calculated net of management fees and transaction costs and gross of custodian fees, taken at the highest applicable fee. The performance figures do not reflect the deduction of any taxes an investor might pay on distributions or redemptions. Our standard fees are presented in Part 2 of our ADV.
Opinions and views expressed constitute the judgment of Vulcan Value Partners as of the date shown and may involve a number of assumptions and estimates which are not guaranteed and subject to change without notice. No representation is being made with respect to their accuracy on any future date. Although the information and any opinions or views given have been obtained from or based on sources believed to be reliable, no warranty or representation is made as to their correctness, completeness or accuracy. Opinions, estimates, forecasts, and statements of financial market trends that are based on current market conditions constitute our judgment and are subject to change without notice, including any forward-looking estimates or statements which are based on certain expectations and assumptions. The views and strategies described may not be suitable for all clients. This document does not identify all the risks (direct or indirect) or other considerations which might be material when entering any financial transaction.
Vulcan focuses on long-term capital appreciation; targeting securities purchases that have a substantial margin of safety in terms of value over price and limiting our investments to companies that we believe have sustainable competitive advantages that will allow them to earn superior returns on capital. Value is our estimate of the intrinsic worth of a company based on our assessment of certain quantitative and qualitative factors. Vulcan defines risk reduction as reducing the portfolio’s price to value ratio by either buying (or adding to existing positions) high quality companies which are trading well below fair value as estimated by Vulcan or selling positions which are trading at or near their fair values.
References to specific securities, asset classes and financial markets are for illustrative purposes only and are not intended to be, and should not be interpreted as, recommendations. There is no assurance that any securities discussed herein will remain in the composite or that the securities sold will not be repurchased. The securities discussed do not represent the composite’s entire portfolio. It should not be assumed that any of the securities transactions or holdings discussed will prove to be profitable, or that the investment recommendations or decisions we make in the future will be profitable or will equal the investment performance of the securities discussed herein. Total return percentage for an individual security is the performance of the security from price at initial purchase date to the price at final sale date. Actual returns for the composites holdings of those securities may differ from total return as the composites rebalanced or changed weights in the individual securities. There may be market or economic conditions which affect our performance, or that of our relevant benchmarks, that may have changed Vulcan Value Partners’ views regarding the prospects of any particular investment. It should not be assumed that recommendations made in the future will be profitable or will equal the performance of the securities discussed in this letter. Vulcan buys concentrated positions for our portfolios, at times averaging 5% in our model portfolios, which may make our performance more volatile than that of our benchmark indices, and our performance may diverge from an index, positively or negatively, as a result. Our focus is on long term capital appreciation, so our clients should consider at least a five year time horizon for an investment with Vulcan.
The S&P 500 Index is an unmanaged index of 500 common stocks chosen for market size, liquidity, and industry group representation. It is a market-value weighted index. The Russell 1000® Value Index measures the performance of the large-cap value segment of the U.S. equity universe. It includes those Russell 1000 companies with lower price-to-book ratios and lower expected growth values. The Russell 2000® Index includes the 2000 firms from the Russell 3000® Index with the smallest market capitalizations. The Russell 2000® Value Index measures the performance of those Russell 2000 companies with lower price-to-book ratios and lower forecasted growth values. Index figures do not reflect deductions for any fees, expenses, or taxes. Investors cannot invest directly in an index.
Vulcan Value Partners claims compliance with the Global Investment Performance Standards (GIPS®). To receive a complete list and description of Vulcan Value Partners’ composites and a presentation that adheres to the GIPS standards, please contact Josh Jones at 205.803.1582 or write Vulcan Value Partners, Three Protective Center, 2801 Highway 280 South, Suite 300, Birmingham, AL 35223.
Large Cap Composite Information : This portfolio strategy invests in companies with larger market capitalizations. Subject to price, any publicly traded company with above average economics that is too large to be included in our small capitalization composite would be a potential investment in this portfolio. A core position is 5% so that theoretically our clients would hold 20 names diversified across various industries. It is very rare that enough companies are sufficiently discounted to warrant this level of concentration so concentration will vary with the price to value ratio. We will invest client assets in positions as small as 1% when price to value ratios are higher. We will not invest client assets in any business that is trading above our estimate of fair value. The composite benchmark is the S&P 500 which is an index of 500 stocks selected based on market size, liquidity, and sector and is designed to provide a broad snapshot of the overall U.S. equity market. New accounts that fit the composite definition are added at the beginning of the first full calendar month for which the account is under management. Closed account data is included in the composite as mandated by the standards in order to eliminate a survivorship bias. The composite was created on March 31, 2007. Portfolios below the minimum asset level of $50,000 are not included in the composite.
Focus Composite Information : This portfolio strategy invests in companies with larger market capitalizations. Subject to price, any publicly traded company with above average economics that is too large to be included in our small capitalization composite would be a potential investment in this portfolio. This is a very concentrated portfolio holding between seven and fourteen positions. We will not invest client assets in any business that is trading above our estimate of fair value. The composite benchmark is the S&P 500 which is an index of 500 stocks selected based on market size, liquidity, and sector and is designed to provide a broad snapshot of the overall U.S. equity market. New accounts that fit the composite definition are added at the beginning of the first full calendar month for which the account is under management. Closed account data is included in the composite as mandated by the standards in order to eliminate a survivorship bias. The composite was created on November 30, 2007. Portfolios below the minimum asset level of $50,000 are not included in the composite.
Focus Plus Composite Information : This portfolio strategy invests in companies with larger market capitalizations. Subject to price, any publicly traded company with above average economics that is too large to be included in our small capitalization composite would be a potential investment in this portfolio. This is a very concentrated portfolio holding between seven and fourteen positions. We will use options instead of limit orders to acquire and/or sell the stock. We do not intend to employ any leverage, but will utilize options to sell volatility when it is expensive and buy volatility when it is cheap. We will focus on options which give our clients the right to buy or sell stock in companies at prices that we would buy or sell anyway, and we will generate revenue through option premiums. Generally, we plan to use options instead of buying stock directly when we can earn double digit returns from selling options. We only intend to purchase options under rare circumstances, and to continue to focus on reducing risk through the purchase of qualifying companies at attractive prices. We will not invest client assets in any business that is trading above our estimate of fair value. The composite benchmark is the S&P 500 which is an index of 500 stocks selected based on market size, liquidity, and sector and is designed to provide a broad snapshot of the overall U.S. equity market. New accounts that fit the composite definition are added at the beginning of the first full calendar month for which the account is under management. Closed account data is included in the composite as mandated by the standards in order to eliminate a survivorship bias. The composite was created on March 31, 2007. Portfolios below the minimum asset level of $50,000 are not included in the composite.
Small Cap Composite Information : This portfolio strategy invests in companies with smaller market capitalizations. Subject to price, any publicly traded company with above average economics that is not “large” would be a potential investment in this portfolio. While we do not have any defined cutoffs, we use the Russell 2000 as a guide to define small cap, and any small publicly traded company with reasonable economics would be a potential investment in this portfolio. A core position is 5% so that theoretically our clients would hold 20 names diversified across various industries. It is very rare that enough companies are sufficiently discounted to warrant this level of concentration so concentration will vary with the price to value ratio. We will invest client assets in positions as small as 1% when price to value ratios are higher. We will not invest client assets in any business that is trading above our estimate of fair value. The composite benchmark is the Russell 2000 Index which measures the performance of the small-cap segment of the U.S. Equity universe and includes approximately 2,000 of the smallest securities based on a combination of their market cap and current index membership. New accounts that fit the composite definition are added at the beginning of the first full calendar month for which the account is under management. Closed account data is included in the composite as mandated by the standards in order to eliminate a survivorship bias. The composite was created on March 31, 2007. Portfolios below the minimum asset level of $50,000 are not included in the composite. In the course of reviewing historical information, we identified that 2014 dispersion was presented for the fourth quarter instead of the annual period. As a result, annual dispersion for 2014 has been updated from 0.58% to 1.26% to reflect dispersion for the relevant period. Additional information regarding this change is available upon request.
All Cap Composite Information : This portfolio strategy invests in companies across all market capitalizations. Generally, positions held in this strategy will also be held in either the Large Cap or Small Cap strategies, though sometimes with differing weights. As with those strategies, a core position in this portfolio is 5% so that theoretically we would hold 20 positions diversified across various industries. Because it is rare that we would find 20 companies meeting our investment guidelines, concentration will vary with the price to value ratios we determine for companies in which we invest. We will invest client assets in positions as small as 1% when price to value ratios are higher. We will not invest client assets in any business that is trading above our estimate of fair value. The composite benchmark is the Russell 3000 Index which measures the performance of the largest 3000 US companies representing approximately 98% of the investable US Equity market. New accounts that fit the composite definition are added at the beginning of the first full calendar month for which the account is under management. Closed account data is included in the composite as mandated by the standards in order to eliminate a survivorship bias. The composite was created on April 1, 2011. Portfolios below the minimum asset level of $50,000 are not included in the composite.
All returns are expressed in US dollars.
| Term |
| Vulcan Definition* |
| Competitive Advantage/Position Moat or Economic Moat |
| A company's ability to maintain competitive advantages over its competitors in order to protect its long-term profits and market share from competing firms. |
| Discount |
| The difference between Vulcan’s estimated intrinsic value and the market price of a company. |
| EBITDA |
| EBITDA is earnings before interest, taxes, depreciation, and amortization. |
| Fair Value/ Intrinsic Value/ Value/ Intrinsic Worth |
| Vulcan’s estimate of the price a willing buyer would pay and a willing seller would accept, assuming neither was compelled to enter into a transaction. |
| Firm Assets |
| Vulcan’s fully discretionary assets under management. |
| Free Cash Flow |
| The amount of cash that a company has left over after a company has paid all of its expenses, including investments. |
| Free Cash Flow Yield (FCF Yield) |
| A company’s free cash flow divided by its market price. |
| High Quality Business |
| A company that meets Vulcan’s standards for investment. |
| Investment Team |
| Vulcan’s Investment Team includes members from both its Research and Trading Teams. |
| Investment Time Horizon |
| Investment holding period considered by Vulcan when evaluating a potential investment. |
| Macro Factors |
| The general economic and business environment. |
| Margin of Safety |
| A favorable difference between the price of a company’s shares and Vulcan’s estimated fair value of those shares. A quantitative Margin of Safety is measured by discount (defined above). Qualitative Margin of Safety is measured by our assessment of the quality of a business. |
| MVP List |
| A proprietary list of qualifying businesses that Vulcan believes have identifiable, sustainable competitive advantages and the ability to consistently produce free cash flow through Vulcan’s five-year investment lens. This list includes Vulcan portfolio companies in addition to others but is not representative of any existing Vulcan client accounts, composites, or funds. |
| Name Turnover |
| The number of companies bought plus the number of companies sold divided by 2 and then divided by the average number of companies in the portfolio during the relevant time period. |
| Portfolio Improvement |
| Overall improvement of the quality of the businesses in the applicable portfolio. |
| Position Size |
| A security’s weight in the applicable portfolio or composite. |
| Price to Value Ratio |
| A calculation that compares the price of a company’s stock to our appraisal of the company’s intrinsic value. |
| Risk Reduction/ Risk Management |
| Reducing the portfolio’s price to value ratio by either buying (or adding to existing positions) high quality companies which are trading well below fair value as estimated by Vulcan or selling positions which are trading at or near their fair values. |
| Stable Value Companies |
| Companies with intrinsic values that Vulcan believes will remain stable over its investment horizon of five years. |
| Total Addressable Market ( TAM ) |
| Also referred to as total available market, is the opportunity that would be available to a product or service if 100% market share was achieved. |
| Value Growth |
| The sum of the growth in a company’s profitability and its free cash flow yield. |
*These definitions should be referenced in the context of Vulcan commentary and do not necessarily represent the meanings that are used in all contexts.
Vulcan Value Partners—Large Cap Composite
1/01/2013 – 12/31/2022
| Year |
| Total Return Gross of Fees % |
| Total Return Net of Fees % |
| Benchmark Return % |
| 3 yr Ex-Post Standard Deviation Composite |
| 3 yr Ex-Post Standard Deviation Benchmark |
| # of Portfolios |
| Dispersion % |
| Total Composite () |
| Total Firm AUM () |
| Percentage of Firm Assets % |
| 2013 |
| 38.22% |
| 37.34% |
| 32.39% |
| 12.44% |
| 11.94% |
| 126 |
| 0.16% |
| $1,392.76 |
| $5,286.17 |
| 26.35% |
| 2014 |
| 15.02% |
| 14.33% |
| 13.69% |
| 10.30% |
| 8.97% |
| 200 |
| 0.25% |
| $3,211.64 |
| $10,180.75 |
| 31.55% |
| 2015 |
| -8.27% |
| -8.77% |
| 1.38% |
| 12.14% |
| 10.47% |
| 285 |
| 0.38% |
| $4,960.57 |
| $12,147.98 |
| 40.83% |
| 2016 |
| 12.63% |
| 12.02% |
| 11.96% |
| 12.22% |
| 10.59% |
| 277 |
| 0.31% |
| $5,457.53 |
| $12,969.39 |
| 42.08% |
| 2017 |
| 18.17% |
| 17.52% |
| 21.83% |
| 11.43% |
| 9.92% |
| 290 |
| 0.48% |
| $6,431.73 |
| $14,562.38 |
| 44.17% |
| 2018 |
| -7.03% |
| -7.55% |
| -4.38% |
| 12.25% |
| 10.80% |
| 296 |
| 0.28% |
| $5,970.69 |
| $12,311.46 |
| 48.50% |
| 2019 |
| 45.93% |
| 45.10% |
| 31.49% |
| 14.72% |
| 11.93% |
| 282 |
| 0.25% |
| $6,147.58 |
| $15,275.12 |
| 40.25% |
| 2020 |
| 12.68% |
| 11.99% |
| 18.40% |
| 23.48% |
| 18.53% |
| 232 |
| 0.49% |
| $6,487.27 |
| $16,719.35 |
| 38.80% |
| 2021 |
| 22.78% |
| 22.06% |
| 28.71% |
| 22.26% |
| 17.17% |
| 218 |
| 0.50% |
| $7,181.06 |
| $20,716.15 |
| 34.66% |
| 2022* |
| -37.34% |
| -37.73% |
| -18.11% |
| 27.78% |
| 20.87% |
| 140 |
| 0.38% |
| $2,714.29 |
| $8,102.48 |
| 33.50% |
*As of 12/31/2022
Firm Information: Vulcan Value Partners is an investment advisor organized as an LLC and registered with the Securities and Exchange Commission under the
Investment Advisers Act of 1940. Vulcan manages long only equity accounts for United States and International clients. The firm’s fee schedule for the Vulcan Large Cap Strategy is as follows: 0.80% for the first $10 million, 0.70% for the next $40 million and 0.60% on the balance in excess of $50 million. Fees are subject to break points on the whole amount managed at the lowest applicable fee when a client deposits a large enough lump sum amount with Vulcan.
Composite Characteristics: This portfolio strategy invests in companies with larger market capitalizations. Subject to price, any publicly traded company with above average economics that is too large be included in our small capitalization composite would be a potential investment in this portfolio. A core position is 5% so that theoretically our clients would hold 20 names diversified across various industries. It is very rare that enough companies are sufficiently discounted to warrant this level of concentration so concentration will vary with the price to value ratio. We will invest client assets in positions as small as 1% when price to value ratios are higher. We will not invest client assets in any business that is trading above our estimate of fair value. The composite benchmark is the S&P 500 which is an index of 500 stocks selected based on market size, liquidity, and sector and is designed to provide a broad snapshot of the overall U.S. equity market. New accounts that fit the composite definition are added at the beginning of the first full calendar month for which the account is under management. Closed account data is included in the composite as mandated by the standards in order to eliminate a survivorship bias. The composite was created on March 31, 2007. Portfolios below the minimum asset level of $50,000 are not included in the composite.
Calculation Methodology: Valuations and returns are computed and stated in U.S. dollars, and individual portfolios are revalued daily. Gross of fees returns are calculated gross of Vulcan’s actual management fee and custodial fees and net of transaction costs. Net of fees returns are calculated net of Vulcan’s actual management fee and transaction costs and gross of custodian fees, taken at each portfolio’s applicable fee. Net of fee returns prior to February 16, 2010 were taken at the highest applicable fee. The composite results portrayed reflect the reinvestment of dividends, capital gains, and other earnings when appropriate. Accruals for equity securities are included in calculations. The dispersion measure is the asset-weighted standard deviation of accounts in the composite for the entire year. The dispersion statistic is not presented for 2007 because the composite was incepted during 2007 and 12 months of data is not available. Dispersion and Standard Deviations are not shown intra-year as they are neither statistically meaningful nor relevant prior to year-end.
Other Disclosures: Vulcan Value Partners claims compliance with the Global Investment Performance Standards (GIPS®) and has prepared and presented this report in compliance with the GIPS Standards. Vulcan Value Partners has been independently verified for the periods April 1, 2007 – December 31, 2022 by ACA Performance Services. The verification report is available upon request. A firm that claims compliance with the GIPS standards must establish policies and procedures for complying with all the applicable requirements of the GIPS standards. Verification provides assurance on whether the firm's policies and procedures related to composite and pooled fund maintenance, as well as the calculation, presentation, and distribution of performance, have been designed in compliance with the GIPS standards and have been implemented on a firm-wide basis. Verification does not provide assurance on the accuracy of any specific performance report. A complete list and description of all composites, limited distribution pooled funds, and broad distribution pooled funds is available upon request. Past performance does not guarantee future results. This performance report should not be construed as a recommendation to purchase or sell any particular securities held in composite accounts. Market conditions can vary widely over time and can result in a loss of portfolio value. Additional information regarding policies for valuing investments, calculating performance, and preparing GIPS Reports are available upon request. GIPS® is a registered trademark of CFA Institute. CFA Institute does not endorse or promote this organization, nor does it warrant the accuracy or quality of the content contained herein.
Vulcan Value Partners—Small Cap Composite
1/01/2013 – 12/31/2022
| Year |
| Total Return Gross of Fees % |
| Total Return Net of Fees % |
| Benchmark Return % |
| 3 yr Ex-Post Standard Deviation Composite |
| 3 yr Ex-Post Standard Deviation Benchmark |
| # of Portfolios |
| Dispersion % |
| Total Composite AUM () |
| Total Firm AUM () |
| Percentage of Firm Assets % |
| 2013 |
| 42.69% |
| 41.65% |
| 38.82% |
| 13.37% |
| 16.45% |
| 53 |
| 0.74% |
| $576.73 |
| $5,286.17 |
| 10.91% |
| 2014 |
| 4.29% |
| 3.41% |
| 4.89% |
| 10.87% |
| 13.12% |
| 59 |
| 1.26% |
| $780.81 |
| $10,180.75 |
| 7.67% |
| 2015 |
| -3.26% |
| -4.09% |
| -4.41% |
| 12.48% |
| 13.96% |
| 58 |
| 0.39% |
| $772.81 |
| $12,147.98 |
| 6.36% |
| 2016 |
| 21.18% |
| 20.12% |
| 21.31% |
| 13.37% |
| 15.76% |
| 58 |
| 0.80% |
| $897.31 |
| $12,969.39 |
| 6.92% |
| 2017 |
| 13.37% |
| 12.40% |
| 14.65% |
| 12.17% |
| 13.91% |
| 54 |
| 1.65% |
| $829.68 |
| $14,562.38 |
| 5.70% |
| 2018 |
| -11.66% |
| -12.42% |
| -11.01% |
| 12.78% |
| 15.79% |
| 31 |
| 1.30% |
| $612.60 |
| $12,311.46 |
| 4.98% |
| 2019 |
| 37.55% |
| 36.40% |
| 25.52% |
| 16.47% |
| 15.71% |
| 29 |
| 1.59% |
| $559.95 |
| $15,275.12 |
| 3.67% |
| 2020 |
| -1.64% |
| -2.50% |
| 19.96% |
| 30.87% |
| 25.27% |
| 23 |
| 1.02% |
| $532.73 |
| $16,719.35 |
| 3.19% |
| 2021 |
| 47.96% |
| 46.77% |
| 14.82% |
| 31.30% |
| 23.35% |
| 21 |
| 1.61% |
| $590.52 |
| $20,716.15 |
| 2.85% |
| 2022* |
| -43.61% |
| -44.08% |
| -20.44% |
| 35.69% |
| 26.02% |
| 20 |
| 0.23% |
| $383.24 |
| $8,102.48 |
| 4.73% |
*As of 12/31/2022
Firm Information: Vulcan Value Partners is an investment advisor organized as an LLC and registered with the Securities and Exchange Commission under the
Investment Advisers Act of 1940. Vulcan manages long only equity accounts for United States and International clients. The firm’s fee schedule for the Vulcan Small Cap Strategy is as follows: 1.00% for the first $10 million, 0.85% for the next $40 million and 0.75% on the balance in excess of $50 million. Fees are subject to break points on the whole amount managed at the lowest applicable fee when a client deposits a large enough lump sum amount with Vulcan.
Composite Characteristics: This portfolio strategy invests in companies with smaller market capitalizations. Subject to price, any publicly traded company with above average economics that is not “large” would be a potential investment in this portfolio. While we do not have any defined cutoffs we use the Russell 2000 as a guide to define small cap, and any small publicly traded company with reasonable economics would be a potential investment in this portfolio. A core position is 5% so that theoretically our clients would hold 20 names diversified across various industries. It is very rare that enough companies are sufficiently discounted to warrant this level of concentration so concentration will vary with the price to value ratio. We will invest client assets in positions as small as 1% when price to value ratios are higher. We will not invest client assets in any business that is trading above our estimate of fair value. The composite benchmark is the Russell 2000 Index which measures the performance of the small-cap segment of the U.S. Equity universe and includes approximately 2,000 of the smallest securities based on a combination of their market cap and current index membership. New accounts that fit the composite definition are added at the beginning of the first full calendar month for which the account is under management. Closed account data is included in the composite as mandated by the standards in order to eliminate a survivorship bias. The composite was created on March 31, 2007. Portfolios below the minimum asset level of $50,000 are not included in the composite.
Calculation Methodology: Valuations and returns are computed and stated in U.S. dollars, and individual portfolios are revalued daily. Gross of fees returns are calculated gross of Vulcan’s actual management fee and custodial fees and net of transaction costs. Net of fees returns are calculated net of Vulcan’s actual management fee and transaction costs and gross of custodian fees, taken at each portfolio’s applicable fee. Net of fee returns prior to February 16, 2010 were taken at the highest applicable fee. The composite results portrayed reflect the reinvestment of dividends, capital gains, and other earnings when appropriate. Accruals for equity securities are included in calculations. The dispersion measure is the asset-weighted standard deviation of accounts in the composite for the entire year. The dispersion statistic is not presented for 2007 because the composite was incepted during 2007 and 12 months of data is not available. The dispersion statistic is not presented for 2007 because the composite was incepted during 2007 and 12 months of data is not available. Dispersion and Standard Deviations are not shown intra-year as they are neither statistically meaningful nor relevant prior to year-end.
Other Disclosures: Vulcan Value Partners claims compliance with the Global Investment Performance Standards (GIPS®) and has prepared and presented this report in compliance with the GIPS Standards. Vulcan Value Partners has been independently verified for the periods April 1, 2007 – December 31, 2022 by ACA Performance Services. The verification report is available upon request. A firm that claims compliance with the GIPS standards must establish policies and procedures for complying with all the applicable requirements of the GIPS standards. Verification provides assurance on whether the firm's policies and procedures related to composite and pooled fund maintenance, as well as the calculation, presentation, and distribution of performance, have been designed in compliance with the GIPS standards and have been implemented on a firm-wide basis. Verification does not provide assurance on the accuracy of any specific performance report. A complete list and description of all composites, limited distribution pooled funds, and broad distribution pooled funds is available upon request. Past performance does not guarantee future results. This performance report should not be construed as a recommendation to purchase or sell any particular securities held in composite accounts. Market conditions can vary widely over time and can result in a loss of portfolio value. Additional information regarding policies for valuing investments, calculating performance, and preparing GIPS Reports are available upon request. GIPS® is a registered trademark of CFA Institute. CFA Institute does not endorse or promote this organization, nor does it warrant the accuracy or quality of the content contained herein.
Vulcan Value Partners—Focus Composite
1/01/2013 – 12/31/2022
| Year |
| Total Return Gross of Fees % |
| Total Return Net of Fees % |
| Benchmark Return % |
| 3 yr Ex-Post Standard Deviation Composite |
| 3 yr Ex-Post Standard Deviation Benchmark |
| # of Portfolios |
| Dispersion % |
| Total Composite AUM () |
| Total Firm AUM () |
| Percentage of Firm Assets % |
| 2013 |
| 41.25% |
| 39.85% |
| 32.39% |
| 13.39% |
| 11.94% |
| 10 |
| 0.20% |
| $44.04 |
| $5,286.17 |
| 0.83% |
| 2014 |
| 13.45% |
| 12.62% |
| 13.69% |
| 11.94% |
| 8.97% |
| 18 |
| 0.13% |
| $248.59 |
| $10,180.75 |
| 2.44% |
| 2015 |
| -8.27% |
| -8.96% |
| 1.38% |
| 14.37% |
| 10.47% |
| 21 |
| 0.13% |
| $333.22 |
| $12,147.98 |
| 2.74% |
| 2016 |
| 9.04% |
| 8.19% |
| 11.96% |
| 14.39% |
| 10.59% |
| 18 |
| 0.07% |
| $266.80 |
| $12,969.39 |
| 2.06% |
| 2017 |
| 22.66% |
| 21.71% |
| 21.83% |
| 13.41% |
| 9.92% |
| 14 |
| 0.06% |
| $247.47 |
| $14,562.38 |
| 1.70% |
| 2018 |
| -2.25% |
| -3.16% |
| -4.38% |
| 13.29% |
| 10.80% |
| 13 |
| 0.23% |
| $110.29 |
| $12,311.46 |
| 0.90% |
| 2019 |
| 57.98% |
| 56.78% |
| 31.49% |
| 14.90% |
| 11.93% |
| 18 |
| 0.44% |
| $555.44 |
| 15,275.12 |
| 3.64% |
| 2020 |
| 26.43% |
| 25.93% |
| 18.40% |
| 22.98% |
| 18.53% |
| 20 |
| 0.33% |
| $1,664.54 |
| $16,719.35 |
| 9.96% |
| 2021 |
| 29.33% |
| 28.82% |
| 28.71% |
| 21.58% |
| 17.17% |
| 23 |
| 0.71% |
| $2,137.76 |
| $20.716.15 |
| 10.32% |
| 2022* |
| -29.03% |
| -29.35% |
| -18.11% |
| 27.04% |
| 20.87% |
| 31 |
| 0.18% |
| $1,187.58 |
| $8,102.48 |
| 14.66% |
*As of 12/31/2022
Firm Information: Vulcan Value Partners is an investment advisor organized as an LLC and registered with the Securities and Exchange Commission under the
Investment Advisers Act of 1940. Vulcan manages long only equity accounts for United States and International clients. The firm's fee schedule for the Vulcan Value Partners Focus Strategy was updated on October 1, 2022 as follows: 0.75% for the first $50 million, 0.65% for the next $200 million and 0.55% on the balance in excess of $250 million. Fees are subject to break points on the whole amount managed at the lowest applicable fee when a client deposits a large enough lump sum amount with Vulcan.
Composite Characteristics: This portfolio strategy invests in companies with larger market capitalizations. Subject to price, any publicly traded company with above average economics that is too large be included in our small capitalization composite would be a potential investment in this portfolio. This is a very concentrated portfolio holding between seven and fourteen positions. We will not invest client assets in any business that is trading above our estimate of fair value. The composite benchmark is the S&P 500 which is an index of 500 stocks selected based on market size, liquidity, and sector and is designed to provide a broad snapshot of the overall U.S. equity market. New accounts that fit the composite definition are added at the beginning of the first full calendar month for which the account is under management. Closed account data is included in the composite as mandated by the standards in order to eliminate a survivorship bias. The composite was created on November 30, 2007. Portfolios below the minimum asset level of $50,000 are not included in the composite.
Calculation Methodology: Valuations and returns are computed and stated in U.S. dollars, and individual portfolios are revalued daily. Gross of fees returns are calculated gross of Vulcan’s actual management fee and custodial fees and net of transaction costs. Net of fees returns are calculated net of Vulcan’s actual management fee and transaction costs and gross of custodian fees, taken at each portfolio’s applicable fee. Net of fee returns prior to February 16, 2010 were taken at the highest applicable fee. The composite results portrayed reflect the reinvestment of dividends, capital gains, and other earnings when appropriate. Accruals for equity securities are included in calculations. The dispersion measure is the asset-weighted standard deviation of accounts in the composite for the entire year. The dispersion statistic is not presented for 2007 because the composite was incepted during 2007 and 12 months of data is not available. Dispersion and Standard Deviations are not shown intra-year as they are neither statistically meaningful nor relevant prior to year-end.
Other Disclosures: Vulcan Value Partners claims compliance with the Global Investment Performance Standards (GIPS®) and has prepared and presented this report in compliance with the GIPS Standards. Vulcan Value Partners has been independently verified for the periods April 1, 2007 – December 31, 2022 by ACA Performance Services. The verification report is available upon request. A firm that claims compliance with the GIPS standards must establish policies and procedures for complying with all the applicable requirements of the GIPS standards. Verification provides assurance on whether the firm's policies and procedures related to composite and pooled fund maintenance, as well as the calculation, presentation, and distribution of performance, have been designed in compliance with the GIPS standards and have been implemented on a firm-wide basis. Verification does not provide assurance on the accuracy of any specific performance report. A complete list and description of all composites, limited distribution pooled funds, and broad distribution pooled funds is available upon request. Past performance does not guarantee future results. This performance report should not be construed as a recommendation to purchase or sell any particular securities held in composite accounts. Market conditions can vary widely over time and can result in a loss of portfolio value. Additional information regarding policies for valuing investments, calculating performance, and preparing GIPS Reports are available upon request. GIPS® is a registered trademark of CFA Institute. CFA Institute does not endorse or promote this organization, nor does it warrant the accuracy or quality of the content contained herein.
Vulcan Value Partners—Focus Plus Composite
1/01/2013 – 12/31/2022
| Year |
| Total Return Gross of Fees % |
| Total Return Net of Fees % |
| Benchmark Return % |
| 3 yr Ex- Post Standard Deviation Composite |
| 3 yr Ex-Post Standard Deviation Benchmark |
| # of Portfolios |
| Dispersion % |
| Total Composite AUM () |
| Total Firm AUM () |
| Percentage of Firm Assets % |
| 2013 |
| 42.32% |
| 40.59% |
| 32.39% |
| 13.67% |
| 11.94% |
| 14 |
| 0.10% |
| $43.96 |
| $5,286.17 |
| 0.83% |
| 2014 |
| 13.17% |
| 12.24% |
| 13.69% |
| 11.76% |
| 8.97% |
| 12 |
| 0.12% |
| $125.11 |
| $10,180.75 |
| 1.23% |
| 2015 |
| -8.03% |
| -8.54% |
| 1.38% |
| 14.39% |
| 10.47% |
| 12 |
| 0.23% |
| $127.65 |
| $12,147.98 |
| 1.05% |
| 2016 |
| 9.04% |
| 8.31% |
| 11.96% |
| 14.40% |
| 10.59% |
| 12 |
| 0.33% |
| $124.05 |
| $12,969.39 |
| 0.96% |
| 2017 |
| 22.85% |
| 22.05% |
| 21.83% |
| 13.40% |
| 9.92% |
| 12 |
| 0.18% |
| $151.30 |
| $14,562.38 |
| 1.04% |
| 2018 |
| -2.40% |
| -3.03% |
| -4.38% |
| 13.27% |
| 10.80% |
| 12 |
| 0.13% |
| $148.45 |
| $12,311.46 |
| 1.21% |
| 2019 |
| 58.52% |
| 56.80% |
| 31.49% |
| 14.88% |
| 11.93% |
| 12 |
| 0.50% |
| $643.86 |
| $15,275.12 |
| 4.22% |
| 2020 |
| 26.73% |
| 25.23% |
| 18.40% |
| 23.01% |
| 18.53% |
| 12 |
| 0.27% |
| $715.83 |
| $16,719.35 |
| 4.28% |
| 2021 |
| 29.25% |
| 27.93% |
| 28.71% |
| 21.62% |
| 17.17% |
| 12 |
| 0.65% |
| $699.86 |
| $20,716.15 |
| 3.38% |
| 2022* |
| -28.95% |
| -29.25% |
| -18.11% |
| 27.11% |
| 20.87% |
| 8 |
| 0.09% |
| $296.45 |
| $8,102.48 |
| 3.66% |
*As of 12/31/2022
Firm Information: Vulcan Value Partners is an investment advisor organized as an LLC and registered with the Securities and Exchange Commission under the
Investment Advisers Act of 1940. Vulcan manages long only equity accounts for United States and International clients. The firm's fee schedule for the Vulcan Value Partners Focus Strategy was updated on October 1, 2022 as follows: 0.75% for the first $50 million, 0.65% for the next $200 million and 0.55% on the balance in excess of $250 million. Fees are subject to break points on the whole amount managed at the lowest applicable fee when a client deposits a large enough lump sum amount with Vulcan.
Composite Characteristics: This portfolio strategy invests in companies with larger market capitalizations. Subject to price, any publicly traded company with above average economics that is too large to be included in our small capitalization composite would be a potential investment in this portfolio. The portfolio is typically invested in between seven and fourteen names. We will use options instead of limit orders to acquire and/or sell the stock. We do not intend to employ any leverage, but will utilize options to sell volatility when it is expensive and buy volatility when it is cheap. We will focus on options which give our clients the right to buy or sell stock in companies at prices that we would buy or sell anyway, and we will generate revenue through option premiums. Generally, we plan to use options instead of buying stock directly when we can earn double digit returns from selling options. We only intend purchase options under rare circumstances, and to continue to focus on reducing risk through the purchase of qualifying companies at attractive prices. We will not invest client assets in any business that is trading above our estimate of fair value. The composite benchmark is the S&P 500 which is an index of 500 stocks selected based on market size, liquidity, and sector and is designed to provide a broad snapshot of the overall U.S. equity market. New accounts that fit the composite definition are added at the beginning of the first full calendar month for which the account is under management. Closed account data is included in the composite as mandated by the standards in order to eliminate a survivorship bias. The composite was created on March 31, 2007. Portfolios below the minimum asset level of $50,000 are not included in the composite.
Calculation Methodology: Valuations and returns are computed and stated in U.S. dollars, and individual portfolios are revalued daily. Gross of fees returns are calculated gross of Vulcan’s actual management fee and custodial fees and net of transaction costs. Net of fees returns are calculated net of Vulcan’s actual management fee and transaction costs and gross of custodian fees, taken at each portfolio’s applicable fee. Net of fee returns prior to February 16, 2010 were taken at the highest applicable fee. The composite results portrayed reflect the reinvestment of dividends, capital gains, and other earnings when appropriate. Accruals for equity securities are included in calculations. The dispersion measure is the asset-weighted standard deviation of accounts in the composite for the entire year. The dispersion statistic is not presented for 2007 because the composite was incepted during 2007 and 12 months of data is not available. Dispersion and Standard Deviations are not shown intra-year as they are neither statistically meaningful nor relevant prior to year-end.
Other Disclosures: Vulcan Value Partners claims compliance with the Global Investment Performance Standards (GIPS®) and has prepared and presented this report in compliance with the GIPS Standards. Vulcan Value Partners has been independently verified for the periods April 1, 2007 – December 31, 2022 by ACA Performance Services. The verification report is available upon request. A firm that claims compliance with the GIPS standards must establish policies and procedures for complying with all the applicable requirements of the GIPS standards. Verification provides assurance on whether the firm's policies and procedures related to composite and pooled fund maintenance, as well as the calculation, presentation, and distribution of performance, have been designed in compliance with the GIPS standards and have been implemented on a firm-wide basis. Verification does not provide assurance on the accuracy of any specific performance report. A complete list and description of all composites, limited distribution pooled funds, and broad distribution pooled funds is available upon request. Past performance does not guarantee future results. This performance report should not be construed as a recommendation to purchase or sell any particular securities held in composite accounts. Market conditions can vary widely over time and can result in a loss of portfolio value. Additional information regarding policies for valuing investments, calculating performance, and preparing GIPS Reports are available upon request. GIPS® is a registered trademark of CFA Institute. CFA Institute does not endorse or promote this organization, nor does it warrant the accuracy or quality of the content contained herein.
Vulcan Value Partners—All Cap Composite
1/01/2013 – 12/31/2022
| Year |
| Total Return Gross of Fees % |
| Total Return Net of Fees % |
| Benchmark Return % |
| 3 yr Ex-Post Standard Deviation Composite |
| 3 yr Ex-Post Standard Deviation Benchmark |
| # of Portfolios |
| Dispersion % |
| Total Composite AUM () |
| Total Firm AUM () |
| Percentage of Firm Assets % |
| 2013 |
| 40.90% |
| 39.65% |
| 33.55% |
| NA |
| NA |
| 62 |
| 0.34% |
| $550.19 |
| $5,286.17 |
| 10.41% |
| 2014 |
| 10.89% |
| 9.98% |
| 12.56% |
| 10.37% |
| 9.29% |
| 97 |
| 0.66% |
| $975.06 |
| $10,180.75 |
| 9.58% |
| 2015 |
| -6.91% |
| -7.70% |
| 0.48% |
| 12.18% |
| 10.58% |
| 104 |
| 0.42% |
| $929.15 |
| $12,147.98 |
| 7.65% |
| 2016 |
| 14.32% |
| 13.36% |
| 12.74% |
| 12.91% |
| 10.88% |
| 90 |
| 0.56% |
| $1,015.44 |
| $12,969.39 |
| 7.82% |
| 2017 |
| 17.99% |
| 17.00% |
| 21.13% |
| 12.22% |
| 10.09% |
| 91 |
| 0.24% |
| $1,155.23 |
| $14,562.38 |
| 7.93% |
| 2018 |
| -6.07% |
| -6.86% |
| -5.24% |
| 12.75% |
| 11.18% |
| 96 |
| 0.53% |
| $1,168.82 |
| $12,311.46 |
| 9.49% |
| 2019 |
| 46.03% |
| 44.85% |
| 31.02% |
| 16.38% |
| 12.21% |
| 82 |
| 0.82% |
| $1,230.56 |
| $15,275.12 |
| 8.06% |
| 2020 |
| 5.35% |
| 4.48% |
| 20.89% |
| 26.07% |
| 19.41% |
| 81 |
| 0.79% |
| $1,419.41 |
| $16,719.35 |
| 8.49% |
| 2021 |
| 30.81% |
| 29.78% |
| 25.66% |
| 25.18% |
| 17.94% |
| 78 |
| 1.16% |
| $1,629.68 |
| $20,716.15 |
| 7.87% |
| 2022* |
| -41.50% |
| -41.99% |
| -19.21% |
| 29.46% |
| 21.48% |
| 43 |
| 0.39% |
| $805.49 |
| $8,102.48 |
| 9.94% |
*As of 12/31/2022
Firm Information: Vulcan Value Partners is an investment advisor organized as an LLC and registered with the Securities and Exchange Commission under the Investment Advisers Act of 1940. Vulcan manages long only equity accounts for United States and International clients. The firm’s fee schedule for the Vulcan All Cap Strategy is as follows: 1.00% for the first $10 million, 0.85% for the next $40 million and 0.75% on the balance in excess of $50 million. Fees are subject to break points on the whole amount managed at the lowest applicable fee when a client deposits a large enough lump sum amount with Vulcan.
Composite Characteristics: This portfolio strategy invests in companies across all market capitalizations. Generally, positions held in this strategy will also be held in either the Large Cap or Small Cap strategies, though with sometimes differing weights. As with those strategies, a core position in this portfolio is 5% so that theoretically we would hold 20 positions diversified across various industries. Because it is rare that we would find 20 companies meeting our investment guidelines, concentration will vary with the price to value ratios we determine for companies in which we invest. We will invest client assets in positions as small as 1% when price to value ratios are higher. We will not invest client assets in any business that is trading above our estimate of fair value. The composite benchmark is the Russell 3000 Index which measures the performance of the largest 3000 US companies representing approximately 98% of the investable US Equity market. New accounts that fit the composite definition are added at the beginning of the first full calendar month for which the account is under management. Closed account data is included in the composite as mandated by the standards in order to eliminate a survivorship bias. The composite was created on April 1, 2011. Portfolios below the minimum asset level of $50,000 are not included in the composite.
Calculation Methodology: Valuations and returns are computed and stated in U.S. dollars, and individual portfolios are revalued daily. Gross of fees returns are calculated gross of Vulcan’s actual management fee and custodial fees and net of transaction costs. Net of fees returns are calculated net of Vulcan’s actual management fee and transaction costs and gross of custodian fees and third party management and administrative fees. The composite results portrayed reflect the reinvestment of dividends, capital gains, and other earnings when appropriate. Accruals for equity securities are included in calculations. The dispersion measure is the asset-weighted standard deviation of accounts in the composite for the entire year. Dispersion and Standard Deviations are not shown intra-year as they are neither statistically meaningful nor relevant prior to year-end.
Other Disclosures:
Vulcan Value Partners claims compliance with the Global Investment Performance Standards (GIPS®) and has prepared and presented this report in compliance with the GIPS Standards. Vulcan Value Partners has been independently verified for the periods April 1, 2007 – December 31, 2022 by ACA Performance Services. The verification report is available upon request. A firm that claims compliance with the GIPS standards must establish policies and procedures for complying with all the applicable requirements of the GIPS standards. Verification provides assurance on whether the firm's policies and procedures related to composite and pooled fund maintenance, as well as the calculation, presentation, and distribution of performance, have been designed in compliance with the GIPS standards and have been implemented on a firm-wide basis. Verification does not provide assurance on the accuracy of any specific performance report. A complete list and description of all composites, limited distribution pooled funds, and broad distribution pooled funds is available upon request. Past performance does not guarantee future results. This performance report should not be construed as a recommendation to purchase or sell any particular securities held in composite accounts. Market conditions can vary widely over time and can result in a loss of portfolio value. Additional information regarding policies for valuing investments, calculating performance, and preparing GIPS Reports are available upon request. GIPS® is a registered trademark of CFA Institute. CFA Institute does not endorse or promote this organization, nor does it warrant the accuracy or quality of the content contained herein.
Editor's Note: The summary bullets for this article were chosen by Seeking Alpha editors.
For further details see:
Vulcan Value Partners Q1 2023 Letter