VYM - VYM: Is This 3.26% Yielding Dividend ETF Workhorse Priced Well?
2023-05-19 00:54:31 ET
Summary
- VYM is a well-diversified, low-fee dividend ETF expected to yield 3.26%. Long-term results are solid, but readers may be concerned that VYM has lagged SPY by 13% YTD.
- I cautioned about this possibility when I downgraded VYM in March. I did the same with SCHD based on Wall Street analysts no longer favoring high-dividend stocks like in 2022.
- Still, recent price action suggests VYM is relatively undervalued. Its constituents delivered a 7.02% earnings surprise last quarter, yet doesn't have any price gains to show for it.
- I still favor the more growth-oriented VIG as I await next quarter's earnings results. However, this appears to be a nice entry point for income investors looking to lock in a solid yield.
Investment Thesis
The Vanguard High Dividend Yield ETF ( VYM ) is poised to deliver a solid 3.26% yield, making it a good candidate for dividend investors seeking low-cost exposure to a well-diversified fund. However, my multi-factor approach to analyzing ETFs identified some potential weaknesses in March, leading to a downgrade. Specifically, Wall Street analysts were less optimistic about VYM's holdings than others, like the Vanguard Dividend Appreciation ETF ( VIG ) and the SPDR S&P 500 ETF ( SPY ). Even the reliable Schwab U.S. Dividend Equity ETF ( SCHD ) scored poorly on numerous factors, so I reasoned the high-dividend funds that succeeded in 2022 might not do so well in 2023. That's been the case so far, at least. VYM is now trailing SPY by 13% YTD.
Nevertheless, the past is the past, and I want readers today to consider the possibility that VYM's recent price weakness represents an opportunity. To assess, I will use the same multi-factor approach as before by comparing it with the three ETFs above, and in the end, I hope you'll agree that the chances VYM will bounce back soon are above average. Or, at the very least, it deserves a spot on your watchlist. I hope you enjoy the analysis.
VYM Overview
Strategy and Performance History
VYM tracks a proprietary Index derived from the FTSE Global Equity Index series. This parent Index represents nearly the entire U.S. investable equity universe except those with unique structures like REITs. Selections are based on forecasted dividend yields, and reconstitutions occur annually with low turnover a priority. VYM's fee is category-leading at just 0.06%.
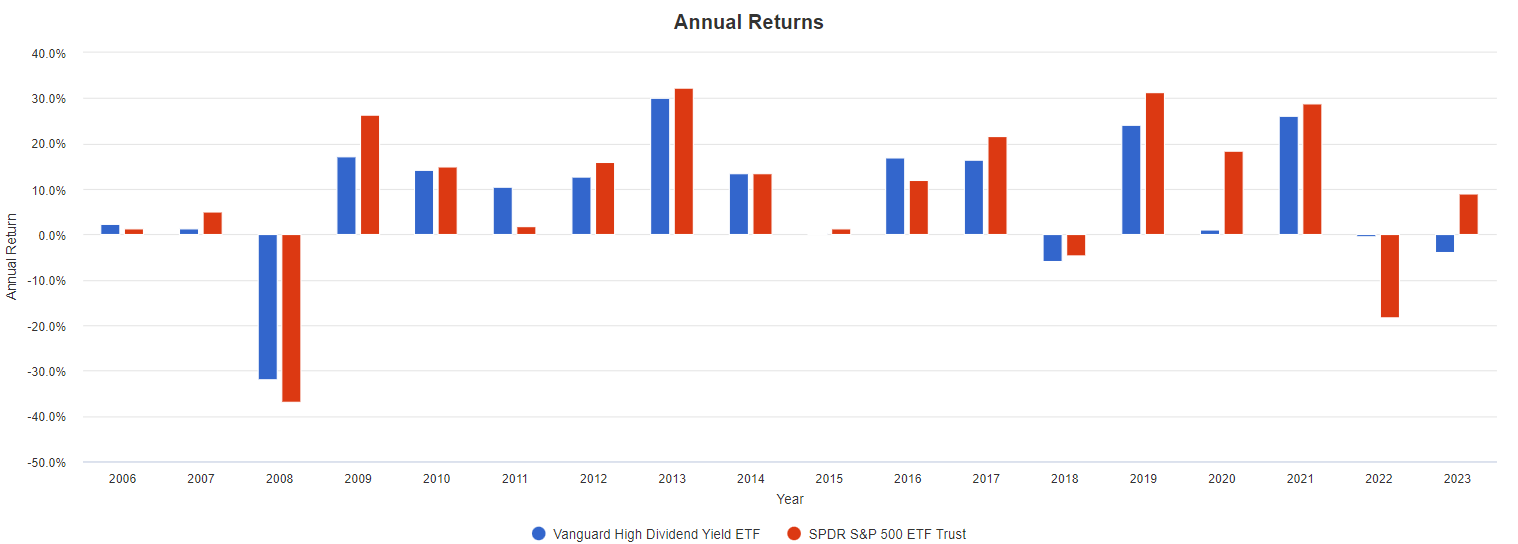
VYM launched in November 2006 and delivered an annualized 7.69% gain compared to 8.90% for SPY, assuming you reinvested dividends. However, it outperformed in the two most significant drawdowns in 2008 and 2022.
The largest risk is holding VYM when market sentiment is positive, which may be the case today. VYM is lagging SPY by 13% YTD. It also trailed by 9% and 17% in 2009 and 2020, two years where earnings surprises were substantial.
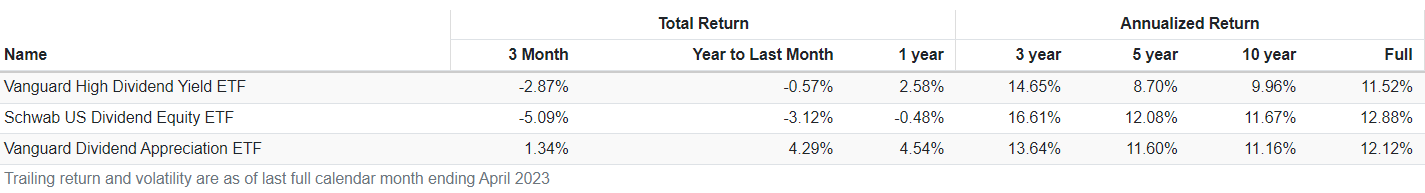
VYM's 9.96% ten-year returns also trail SCHD and VIG. VIG is for a different investor who prefers dividend growth over yield. However, I include it in today's analysis because it doesn't have the same earnings problem as VYM and SCHD.
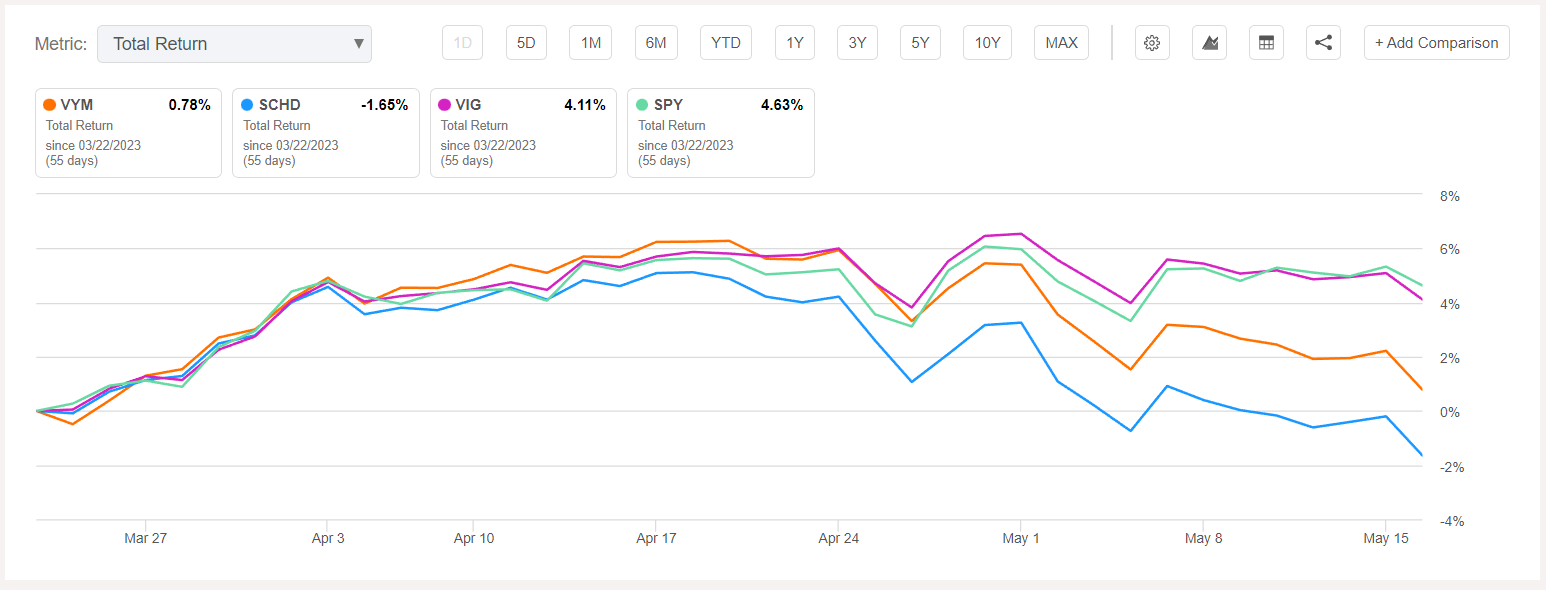
After over a year of criticism, I changed my rating on VIG to a buy in March. In November 2021, I cautioned readers about its relatively high valuation as market sentiment declined. Now, sentiment and earnings surprises are trending upward again, so the market has more appetite for VIG's riskier holdings. This understanding of sentiment can help you identify which ETF to buy next. Since my rating change, VIG outperformed VYM and SCHD by 3-6%.
Sector Exposures and Top Ten Holdings
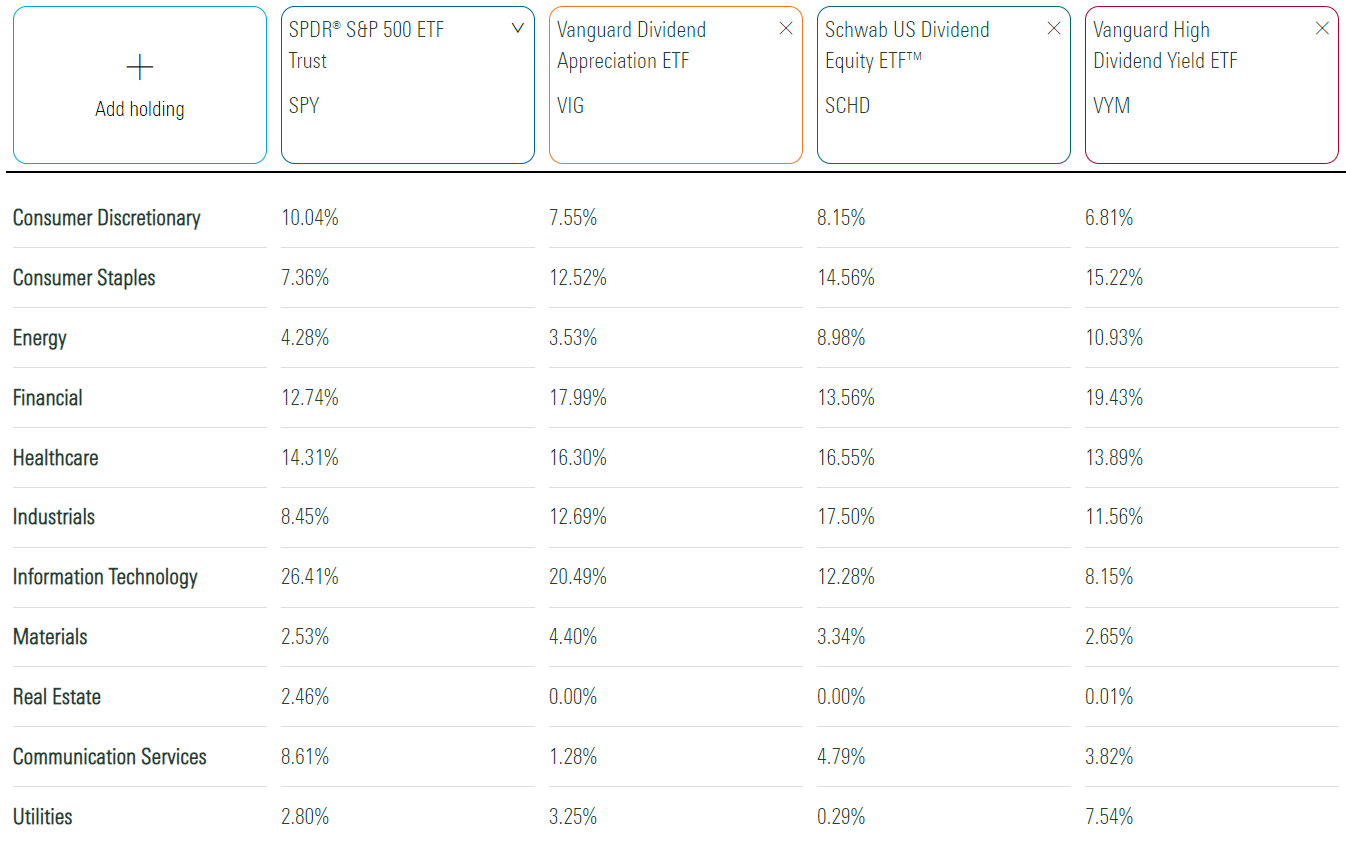
The following table highlights sector exposures for SPY, VIG, SCHD, and VYM. The latter two are most similar, but VYM overweights Financials and Utilities by 6% and 7%, with offsets primarily in Industrials and Technology.
VIG is closer to SPY and, thus, inappropriate for income investors. It has 20% exposure to Technology now, after March's addition of Apple ( AAPL ). Even so, it still overweights some low-beta sectors like Consumer Staples and Financials to a lesser extent.
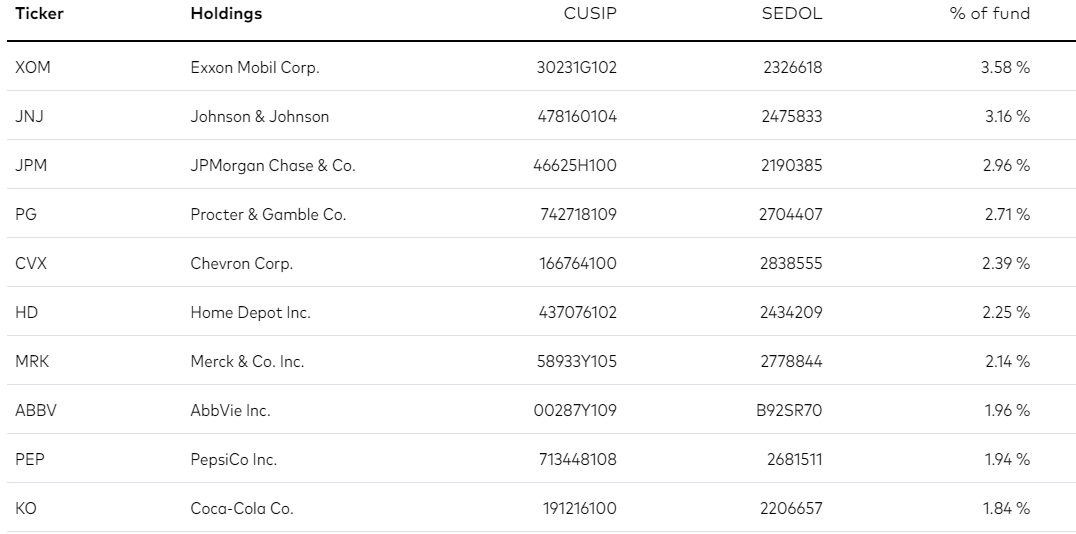
VYM's top ten holdings are below, totaling 25% of the portfolio. All are household names, including Energy giants Exxon Mobil ( XOM ) and Chevron ( CVX ), as well as several Health Care and Consumer Staples stocks like Johnson & Johnson ( JNJ ) and Procter & Gamble ( PG ).
VYM Analysis
Dividends
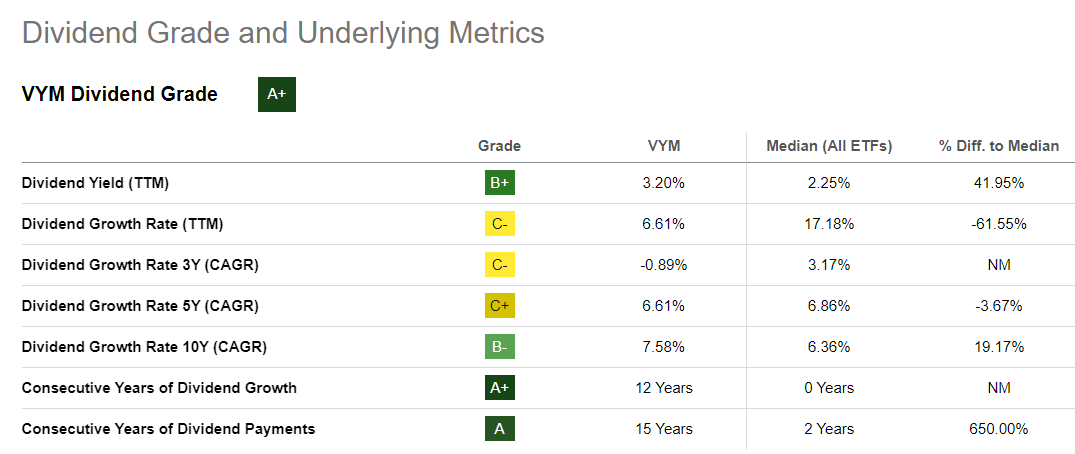
VYM earns a perfect "A+" Dividend Grade on Seeking Alpha, primarily due to 12 years of consecutive dividend growth and a 3.20% trailing dividend yield. However, its 6.61% five-year dividend growth rate is 9% less than SCHD and 3% less than VIG. I think of VYM primarily as an income play with modest capital appreciation potential.
You might wonder why an income investor would choose VYM over SCHD. After all, SCHD has a higher dividend yield, superior dividend growth, a better long-term track record, and the same low 0.06% expense ratio. The argument makes sense but doesn't consider the fundamentals of each ETF's current holdings and ignores today's market environment. As I will demonstrate, both ETFs are sufficiently profitable and have identical valuations. However, VYM has a slight edge on earnings growth, earnings surprises, and earnings revisions. These metrics impact future dividend growth, and since there isn't a clear winner right now, I don't see a problem with selecting both. VYM should at least make an income investor's shortlist.
VYM Company Fundamentals
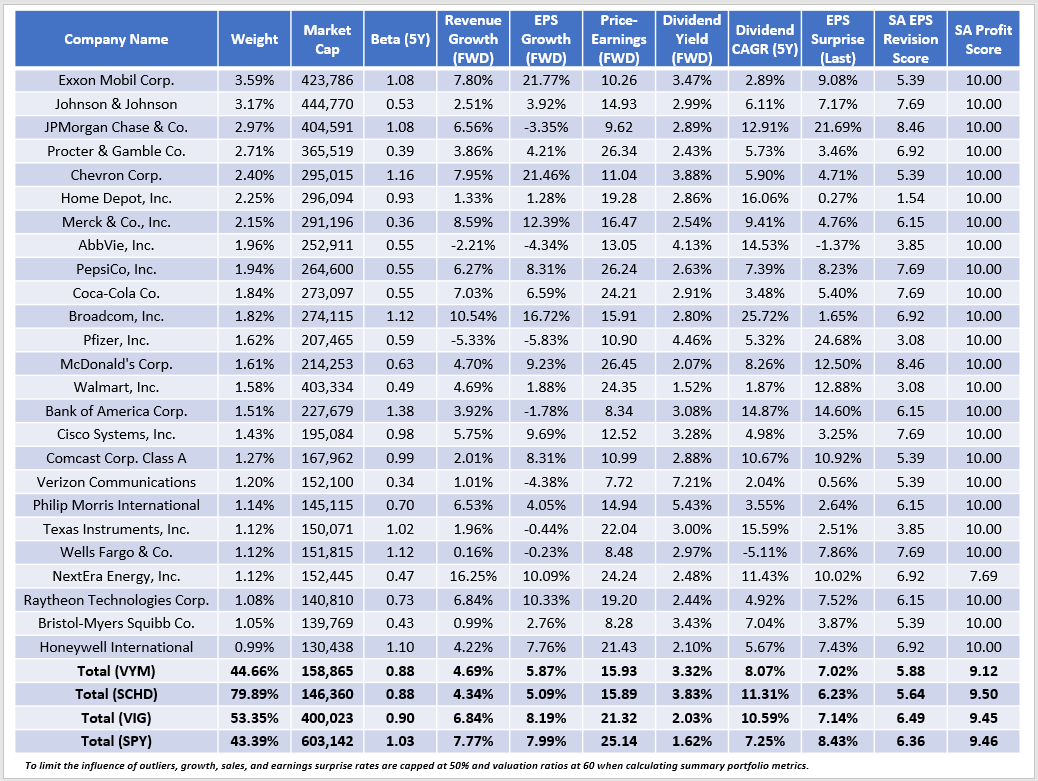
The following table highlights selected fundamental metrics for VYM's top 25 holdings. The table also includes summary metrics for SCHD, VIG, and SPY. As a reminder, SCHD is closest to VYM by yield, while VIG is more appropriate when market sentiment is high.
Based on concentration in the top 25, VYM is about the same as SPY. Meanwhile, SCHD is the outlier at 80%. It's a market-cap-weighted fund of 100 securities and excludes some key sectors like Real Estate and Utilities, so it's not diversified enough by itself. However, the concentration issue disappears as you add more ETFs to your portfolio, so it doesn't impact my opinion on either fund today.
I closely examine beta, profitability, and valuation to assess downside protection. VYM, SCHD, and VIG are all similar, though VYM trails on profitability. Nearly all its top 25 holdings are household names with "A+" Seeking Alpha Profitability Grades, but it's the smaller holdings you may not know about that drag its score down. Consider VYM's allocations and weighted average profitability scores for four industries:
- Electric Utilities (4.69%): 7.56/10
- Regional Banks (2.71%): 7.31/10
- Multi-Utilities (2.17%): 6.75/10
- Investment Banking & Brokerage (1.83%): 5.56/10
These add up to 11.41% of VYM, and besides low profitability, all have low estimated earnings growth rates and performed below average in Q1. Still, despite SCHD having only 3.86% exposure to these industries, VYM has the better total earnings growth rate (5.87% vs. 5.09%), most recent earnings surprise (7.02% vs. 6.23%), and EPS Revisions Score (5.88/10 vs. 5.64/10).
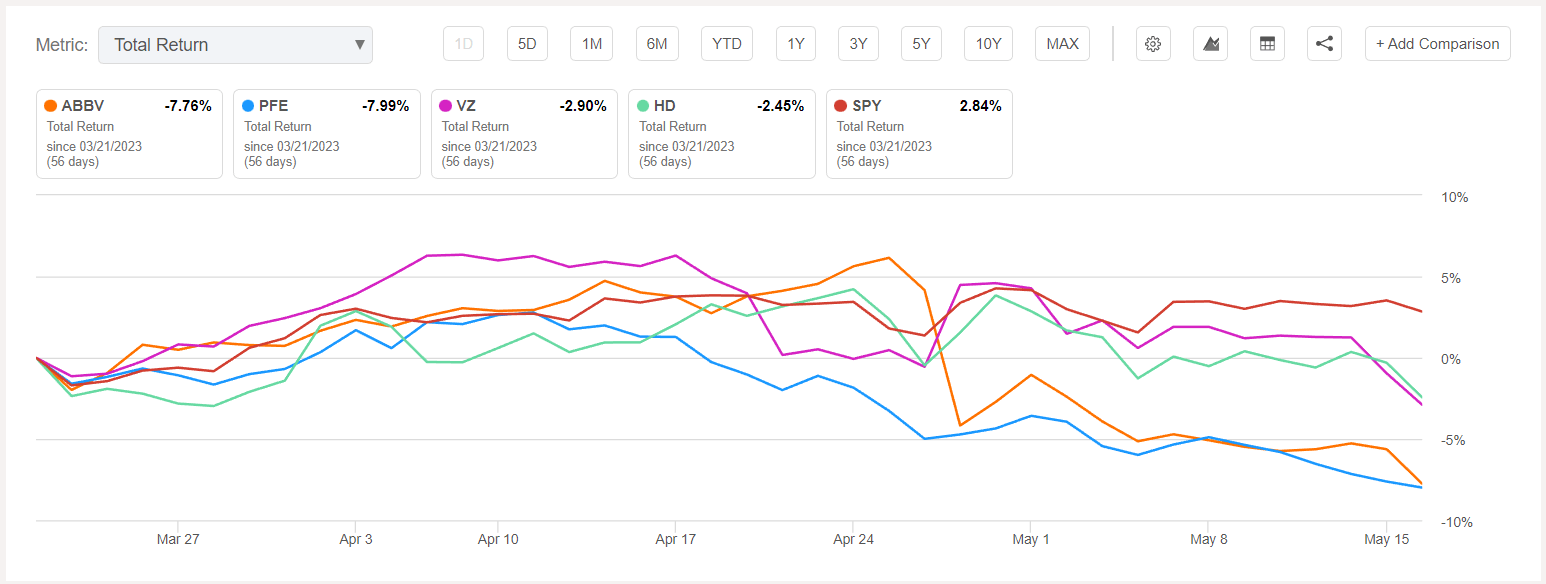
SCHD also has some problems. Recall from my annual reconstitution update how I identified AbbVie ( ABBV ), Pfizer ( PFE ), Verizon Communications ( VZ ), and Home Depot ( HD ) as "key culprits" of the weak EPS Revision Score. Here's how they have performed since:
As shown, all lag SPY. It's one example of how we can use Seeking Alpha's EPS Revision Grades to indirectly gauge what Wall Street thinks about an ETF.
VYM Earnings Surprises: Do They Jive With Returns?
The table above provided the latest earnings surprise figures for VYM's top 25 holdings, with the weighted average for the ETF at 7.02%. This result was between SCHD and VIG, but all three trail SPY's 8.43% figure. My calculation is close to what Yardeni Research reports in aggregate (7.1%).
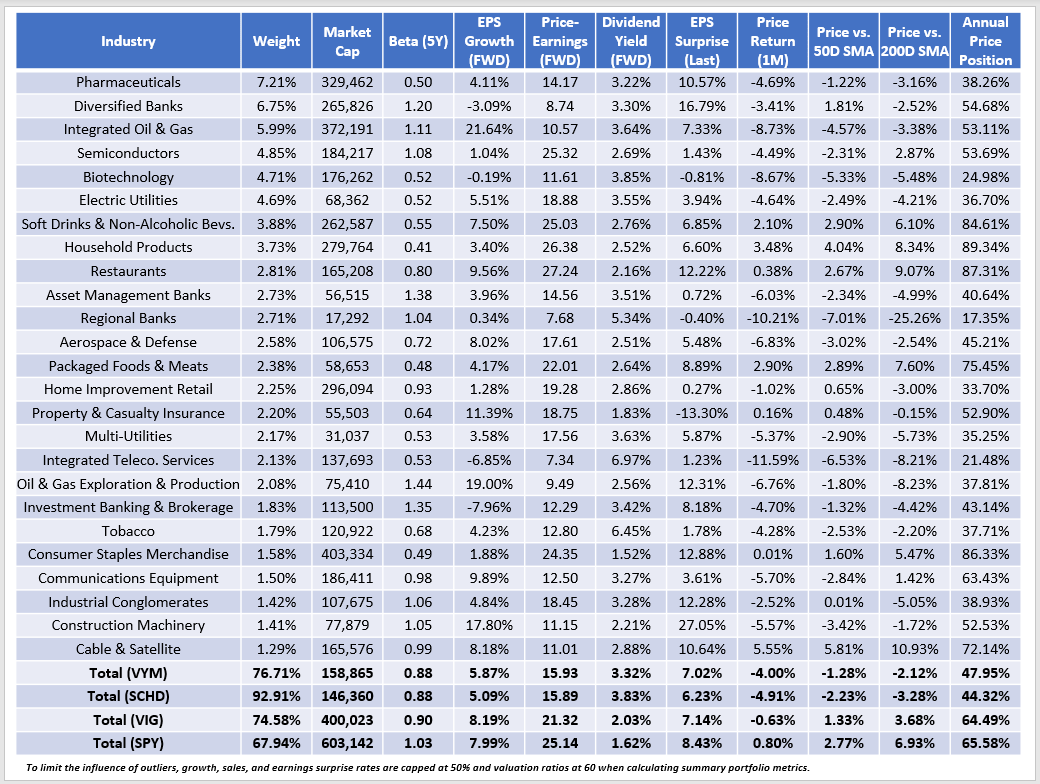
Still, the results are close but don't align with recent price performance. Consider the industry-level look at VYM in the following table. Constituent prices are down by 4% in the last month based on current weightings. Meanwhile, VIG is off by just 0.63%, and SPY is up by 0.80%.
All six of VYM's top industries experienced price declines over the last month, yet only Biotechnology missed earnings expectations. I think that's an overreaction. While I still prefer VIG, it's reasonable to buy VYM now too. It trades at just 16x forward earnings, is positioned closer to its 52-week low price, and offers a decent 3.26% expected dividend yield (3.32% gross). Hopefully, the gap will close, and if the markets decline, its cheaper valuation should prove beneficial.
Investment Recommendation
I expect VYM to yield 3.26% and produce moderate dividend growth. There may be a small buying opportunity today because VYM's solid 7.02% earnings surprise figure is not yet reflected in recent returns. Furthermore, VYM has a slight advantage in earnings growth and revisions compared to SCHD. However, I remain cautious because market sentiment seemingly turned positive this quarter, meaning defensive funds like VYM could substantially underperform. I'm more comfortable leaning toward VIG to capture the upside, even if that means sacrificing some protection. Thank you for reading, and I look forward to continuing the discussion in the comments section below.
For further details see:
VYM: Is This 3.26% Yielding Dividend ETF Workhorse Priced Well?