AFMC - Wall Street And The Energy Transition
2023-03-11 04:02:26 ET
Summary
- The Energy transition from fluids to hard assets will present major opportunities and major disruptions for years to come.
- Despite the ongoing transition, "traditional Energy" is the only sector in a Bull market now.
- This is a time period to be cautious about stocks all due to a bullish view of rising interest rates.
- The Fed once again reiterates their "Higher for Longer" stance.
"Always something new, always something I didn't expect, and sometimes it isn't horrible." - Robert Jordan
Each Week I present a capsule summary of the markets that highlights the weekly market action but I also try to incorporate a view that is slanted toward the MACRO scene. At the end of the day, an investor must have a grasp of the longer-term view before they can deal with the short-term noise. An investor will struggle if they have the general investment environment incorrect. Looking around today, we are no longer investing in a low-interest rate backdrop, nor are we investing in a pro-business environment.
In addition, there are other changes to the Macro scene that have the wherewithal to impact investors for a long time. So I'll start this presentation with a perspective that will be impacting the market for not just months but for YEARS.
We can't speak to the Macro scene without discussing the impacts that will be felt during the "energy transition" that has been set in motion. I invite everyone to take a look at a presentation that discusses a change that is really about a transition from fluids (Oil and Gas) to hard assets (Minerals). The latter will be in demand at levels never seen in the world's history. The discussion presents an unbiased view into the reality of what this transition will require to pursue and complete the de-carbonization effort.
This isn't about taking a Pro or Con stance on the green new deal. It's about the reality of what is going to have to transpire to achieve any decarbonization goals. I will let everyone decide for themselves, but I happen to agree with the conclusion. There are physical and potentially serious economic limitations inherent to this transition that suggest it cannot be achieved as planned and forecasted. I'm not insinuating it won't be done, but I'm convinced a serious change in approach must be taken to implement ANY change. When the CEO of the world's largest producer of renewable energy raises doubts about the plan, people should sit up and take notice.
One thing everyone can agree on is the Cost of this endeavor. It will be measured in trillions of dollars. As the initial steps were taken, the global economy has already been subject to a man-made energy crisis. We can expect more "upset" and associated economic impacts along the way as this plays out. They are going to be very different from what we have witnessed before because a transition of this size has never been done before.
To encourage the green transition, governments will have to reduce fossil fuel subsidies and introduce policies that decrease the incentive for companies to add new '"supply". (That process has been started). On top of that, we have seen social pressure which will further discourage fossil fuel producers, and that will continue. As these firms cut back on investment in exploration and extraction, the supply of oil and gas will likely decline more quickly than demand, putting upward pressure on prices. There is already evidence of this happening, as major oil and gas companies begin to shift their focus toward renewables as well. Yet despite the continued criticism and harassment, energy companies are spending billion on renewables. Chevron (CVX) has pledged a $10 billion investment by 2028. Over the next six years, Exxon (XOM) will be investing $15 billion.
Inflation Pressures?
As supply decreases, prices in the traditional oil and gas energy sources will at the very least remain resilient and at worst rise significantly. While that is already occurring, the demand for "everything green" in the form of the metals and minerals needed will push up the prices of these supplies too. One example, the IEA estimates that demand for lithium alone could rise 40 times over the next two decades as battery use increases. Keep in mind that is but One hard asset that is needed to make the transition viable.
Since these demands will be unprecedented, we can at the very least expect prices to also rise to unprecedented levels. That's not an opinion, the simple laws of supply and demand tell us that. Especially if that demand occurs as quickly as the Green plan is dictating. In essence, all input costs to produce energy will be rising at the same time. As we have already seen energy costs feed into any inflationary cycle. As this MACRO issue evolves, flexibility will have to be introduced into the equation to avoid what could be a very unsettling global economy. However, we've yet to see anything other than a "full speed ahead", "nothing is stopping this train" mentality. Perhaps the "reality" of the situation brought to light in the video analysis highlighted earlier will eventually shift that mindset. Whether we like it or not we may also see the physical realities that present limitations to eventually slow this train down. Global mining capabilities to extract the hard assets required will be one such physical limitation.
This endeavor comes with plenty of ironies attached to it. If handled correctly this energy transition can be an exciting time that can fuel growth in economies for a long time, it also can bring about global calamity the likes of which has never been seen before. The most dangerous outcome occurs if global policymakers remain on the path they have initially chosen. One which has already caused global economic issues. The trump card that can save the day is as always - private enterprise. They alone will determine the pace at which this transition occurs and possibly avoid as many pitfalls as possible. Technology advances and manufacturing efficiencies will eventually make the transition a viable one. The real issue is always the same -- Reality. Those advances do not come overnight, or in months, or a year or two. History has shown anything that comes close to this type of secular transformation of society and the economy will take decades to achieve.
Transition = Opportunity
From an investment perspective, plenty of opportunities will be presented to investors as this process plays out. Some of them will be Huge. We have already seen the evidence in the Energy (fossil fuels trade) in the last two-plus years. That trend will remain in place and then we will witness mining, metals, and minerals be in huge demand.
As is always the case, there will be many "ups and downs" in the opportunities that will be presented. So it's incumbent for an investor to realize that despite the lofty goals to achieve this transition in short order, it will take patience as we watch these cycles and trends mature. The same will transpire for the stocks of the companies that will be involved. There will be periods of strong momentum driving the stocks higher followed by cooling-off periods that could be disappointing and frustrating. Adopt a mindset that these are long-term cycle trends because, over the long run, these situations will remain in a Bull market for a very long time. Rest assured this transition will be a Major economic influence (Good and Bad) in the years to come.
Mixed Signals In The Near Term
Let's take one step back to a view that is still MACRO-oriented but is concerned with an outlook that is concentrated on the next few months to a year or so. We have discussed all of the historical signals (and there are many) that suggest the S&P will rebound sharply in '23. Breadth thrusts that have proven reliable indicators also suggest a buoyant stock market.
There's a ton of debate over whether or not the S&P 500's 2022 closing low in October marked the start of a new bull market (20%+ rally on a closing basis without a 20% decline in between) or was just a pause in what is likely to be another leg lower. From the bear's perspective, the tepidness of the rally off those October lows stands out. Already more than four months past those lows, the S&P 500 is only up ~8%, and its maximum gains were ~16%. It's often said, that bottoms tend to be so short-lived that the market gives investors a narrow window to get in near the lows, but here we are ~160 days removed from that October low, and the S&P 500 still hasn't reached the 20% threshold for a bull market.
Bespoke Investment Group;
To put that in perspective, to find a bull market where it took the S&P 500 longer to reach the 20% bull market threshold, you have to go back to 1962; the ten bull markets between then and now all reached the 20% point faster and the average number of days that elapsed from the closing low to +20% was 57 days.
The market's rally off the October lows has been relatively muted, sector leadership since those lows has been made up of the areas of the market that were the most beaten down last year.
That is another example of why I've stated that this is not indicative of a new Bull market. The confusing part of this backdrop is that stocks aren't necessarily following a recessionary backdrop.
What may be more important is this subtle historical fact. This should force us to step back and reassess the situation, from a different viewpoint. During a Bear market, the S&P has never established The low before the 2-year treasury yield has peaked. With the 2-year hitting a cycle high of 5% this week, that suggests the October low for the indices was Not The low .
Unless This time is different.
The Week On Wall Street
The indices opened on a positive note as the prior week's momentum carried over into the early trading. With Chair Powell scheduled to report to Congress and a Friday Jobs report looming, a more cautious tone took over and the early gains vanished.
On Tuesday it wasn't about gains it was all about across-the-board losses in all of the major indices. Chair Powell told Congress what some have recognized and known for months. It will be "higher for longer" as the Fed will continue to do what is necessary to quell inflation. That caught the economic cheerleaders calling for end-of-year 'pivots' off guard and the rout was on. The two headwinds for stocks reacted strongly, adding more fuel to the sellers. The US dollar index surged 1.17%, and the 2-year treasury briefly traded above 5% and did close at that level.
The indices meandered around the flatline until Thursday afternoon when a choppy session turned into another big sell-off. Every index and every sector was sold off aggressively. Selling picked up on Friday, sending all the indices and sectors to weekly losses. The Russell 2000 led the way with a loss of 7.8%. The NASDAQ was down 4.8%, followed by the S&P (-4.5%) and the DJIA (-4.4%), The Dow 30 has given up all of its yearly gains, down 3.7%.
The Economy
The Bad news; President Biden proposed an array of tax hikes in his annual budget request to Congress that would dramatically raise the rates paid by corporations and wealthy Americans.
- The budget proposed raising the top personal income tax rate to 39.6%, from 37%,
- Raise the federal capital gains tax rate to 39.6% from 20% for households earning more than $1 million.
- Increase the 3.8% Obamacare tax to 5% for those earning at least $400,000
- A 25% minimum tax rate for U.S. households worth more than $100 million
- Quadruple the 1% levy on corporate stock buybacks that was added to the tax code last year.
- Lift the corporate tax rate to 28% from 21%. The measure also calls to increase taxes U.S. companies owe on their foreign earnings to 21% - nearly double the current 10.5% rate.
- Scrap oil and gas industry subsidies
The Good news is the proposals are unlikely to garner support in a deeply divided Congress and face almost certain rejection from Republicans who are in control of the House.
It's not whether or not this package of taxes will eventually be enacted, it confirms the mindset in place today. One that is set with an anti-business backdrop. That isn't just my opinion, it's the facts highlighted in the proposals. The proposal suggests it will cut the deficit by 3 Trillion. However, in the last two years, ~ 6 trillion of debt has been added.
The proponents of the proposals will tout that only a small percentage of individuals' taxes will be increased. However, the group that is being targeted already pays ~42% of all the federal taxes and pays more tax than the bottom 90% combined. Wealthy individuals create opportunities and jobs. Add more taxes to a corporation's balance sheet and they will find a way to cut other expenses and the first way to do that is to eliminate jobs. It's a fairy tale to believe hiking taxes on corporate America will not have ramifications for all.
If enacted as proposed, the US will once again be disadvantaged in the global marketplace. We'll have one of the highest corporate tax rates in the world, and individuals will pay the highest capital gains tax on the planet. Here again, these are the simple facts. So when we step back what investors are looking at are tax hikes being proposed in a rising interest rate backdrop to fight high inflation in a slowing economy. I urge everyone to read that last sentence again.
That should tell investors all they need to know while also realizing this narrative is entirely backward. The problem isn't about raising more income - it's about lowering Federal Spending.
Federal tax collections hit a record high of $4.9 trillion in nominal dollars for the fiscal year (FY) 2022 that ended September 30, which is $850 billion more than last year's $4.05 trillion in collections (also a record ).
As a share of GDP, federal tax collections are at a multi-decade high of about 19.6 percent in FY 2022, up from 17.9 percent last fiscal year and approaching the last peak of 20 percent set during the dot-com bubble in FY 2000.
Finally, with a global energy situation where the supply of fossil fuels has to be encouraged, the removal of subsidies and threatening an excess profits tax is another effort to stifle the industry. We've seen the same efforts play out in the Eurozone.
However, for many governments, keeping consumer energy prices affordable is the top priority. That's why numerous countries, ranging from Japan to Brazil, last year imposed or increased subsidies to cushion consumers from skyrocketing prices.
If enacted this package would have serious negative ramifications on the economy and the stock market.
Employment Scene
The latest JOLTS report showed job openings declined 410k to 10,824k in January after jumping 488k to 11,234k in December. Openings were at 11,487 a year ago which compares to the all-time high of 12,027k from last March. There are 1.9 openings for every unemployed, down slightly from 2 to 1 in December which matched the record high.
A light week in economic data came to an end with the nonfarm payrolls report which showed an increase of 311k in February, above expectations. However, that follows gains of 504k in January and 239k in December for a net.
Below the surface, the Unemployment rate was higher (3.6%) than expected, average hourly earnings were lower than expected, and average weekly hours were also lower than expected. Overall, the report will spur the debate on how the Fed will view this data in deciding the size of the rate increase scheduled for March 22.
The Global Scene
German factory order volumes are starting to rebound, up for a second-straight month and confirming PMI pickups.
German Factory (www.bespokepremium.com)
Within that data, Germany's battery boom is mostly thanks to domestic rather than foreign demand.
Geopolitical Scene
A coincidence? Not likely
Mr. Putin is a lot of things, but one thing is for sure he isn't stupid, and he likes high oil prices. Back in 2008, oil spiked to over $100 bbl and he embarked on the Russo/Georgia war . Russia invades and then annexes Crimea in 2014 when oil moved to ~120 bbl. Fast forward to 2022, oil once again spikes and Russia invades Ukraine.
Russia wants and needs high oil prices to finance these wars. From where I sit the stage was set nicely when the global leaders decided they were going to limit fossil fuels to go green. That coordinated effort had an effect and got oil prices moving and now maintaining oil at higher prices.
The rhetoric about what the war in Ukraine has done to oil supplies is noise. Considering that Russian oil exports remain at 10 million barrels a day the argument that the invasion killed supply is and has been one immense false narrative from the beginning. What killed supply is the global energy policy that is anti-fossil fuels.
It's the war on energy that will keep oil prices high and why the sector should continue to be a part of every investor's portfolio. Unfortunately, that can keep Russia's ability to fund the war for a long time. That view is bolstered when we look at other facts that never make the light of day. Since the beginning of the 2022-23 season in July through to December, Russia exported 24.9 million tonnes of wheat , 3.2 million tonnes more than a year ago at the same stage.
What this entire situation has brought to the investment scene is far different from the perceptions that have been forged. The facts bear out the notion that the rhetoric blaming the war in Ukraine as the cause of any global disruptions in supply has been a false narrative from Day One. However, the geopolitical scene is rapidly changing when one considers that trade between China and Russia set a record last year .
The world stage is being transformed and it portends a very uncertain future that can have major ramifications on the US and other global economies.
Valuations
Stocks have discounted a lot of earnings weakness already, but I am not convinced that a mild recession has been fully priced in. We also do not have the luxury of a Fed coming to the rescue as they did coming out of the market lows in 2018 (trade war) and 2020 (Covid shutdown), due to their fight against high inflation. As I have mentioned before, the result is a bottoming and recovery process that is likely more elongated in this cycle.
As investors gain clarity on inflation, Fed policy, and ultimately the economy, we can expect a better investing environment that eventually yields positive returns. But that clarity will also take time.
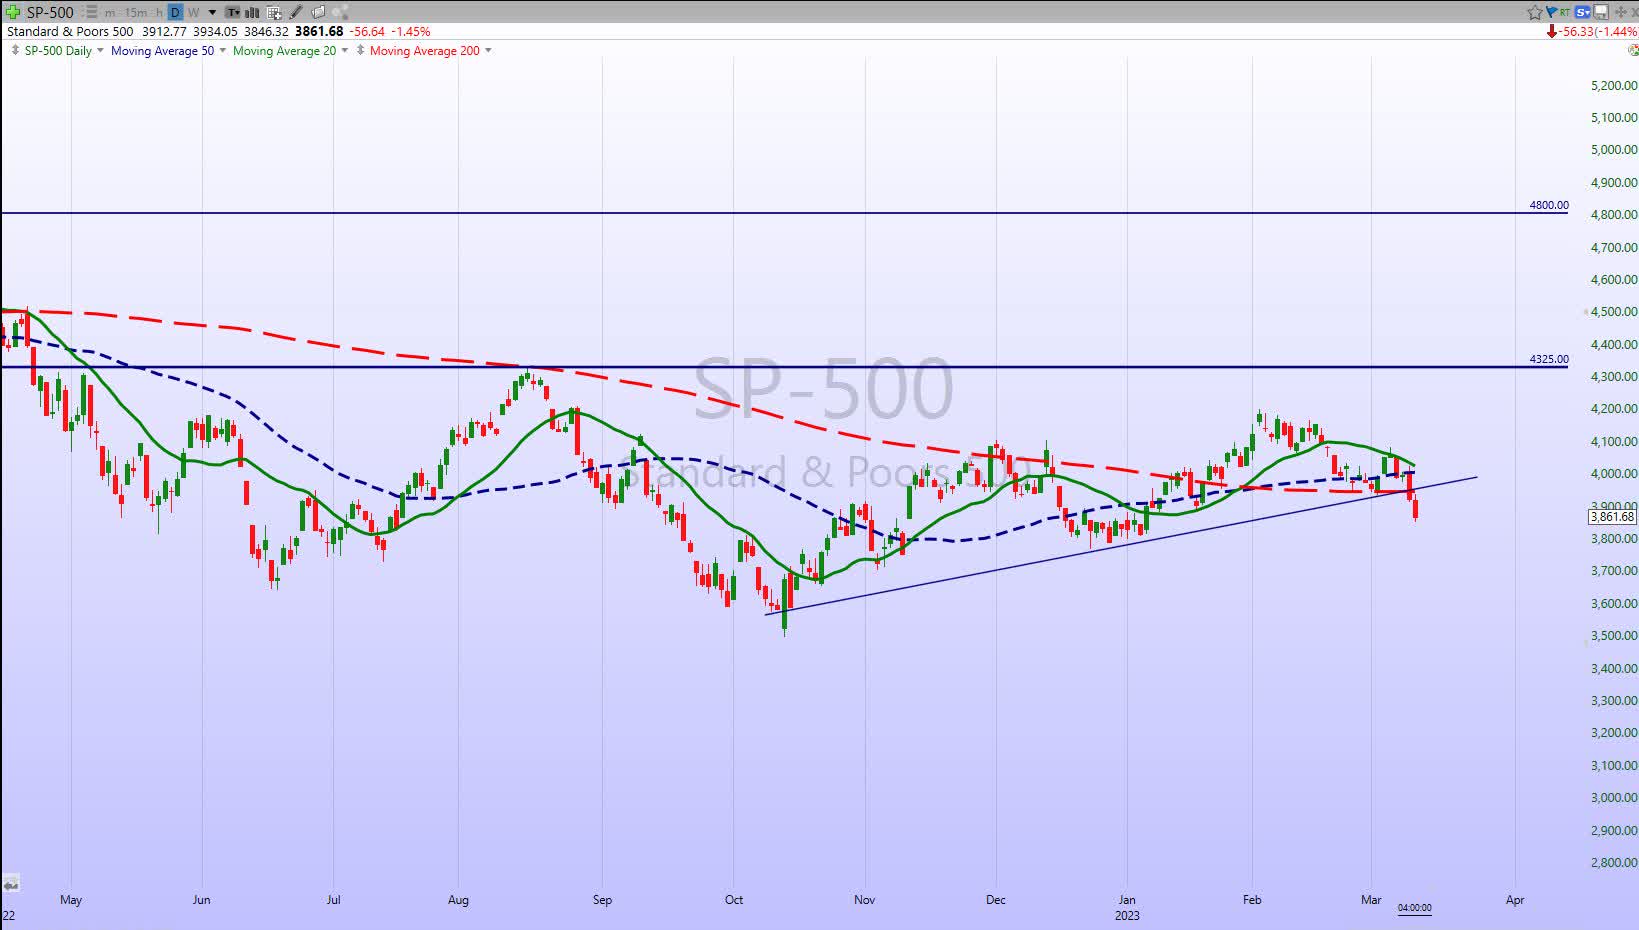
The Daily chart of the S&P 500 ( SPY )
The S&P 500 began this week in a promising fashion, continuing the rally from the prior week and briefly climbing above the ~4060 level. That seemed to be signaling the index was about to break back above all short-term resistance levels. However, the index was not able to hold above that resistance level into Monday's close and followed that up by reversing hard. Looking at the DAILY chart now shows that it was a short-term failure that set the stage for more declines.
S&P 500 (www.FreeStockCharts.com)
The resulting price action turned ugly which then resulted in a total breakdown. Analysts and pundits will look for excuses and wind up blaming any number of circumstances for this decline. When an index fails at resistance in a Bear market, it does not take much to turn a 'dip" into another leg down. The primary trend is Bearish which is still in place today.
Investment Backdrop
History tells us we are entering one of the better periods for the stock market. March has tended to be a positive month, but performance has been backend loaded. Since 1983, the S&P 500 has only been modestly positive midway through the month on an average basis with most of the gains coming after the first two weeks of trading. Looking more closely at just the last ten years, average returns have been more volatile, but that's largely a function of the extreme volatility in March 2020 at the height of the COVID crash. That had an exaggerated impact on the smaller sample size. If we don't include 2020, performance over the last ten years looks much more like a long-term pattern.
Seasonality (www.bespokepremium.com)
Finally, when the S&P 500 was up YTD (like today), performance in March was much steadier versus years when it was down YTD.
As trading ended this week the S&P 500 sits in the middle of the trading range it has carved out since last September. The index is trading where it was in May of '22, and in January 2021. The stock market as measured by the S&P 500 has gone nowhere for 26 months. In between, it has been a roller coaster to new highs and then a new Bear market low. So if you feel somewhat whipsawed and beaten up, you have a right to be. Congratulations, you have now experienced what the end of a Bull market and the start of a Bear market feels like.
It seems many are wishing and hoping this backdrop will turn around and we'll start to experience an 'easier' market. Some have already called this a new Bull market. These calls are out of touch with reality, and they may be in for a long wait for the next Bull market scene. Make no mistake this is still a Bear market. We can expect more challenges ahead that should last until we finally get some clarity on the issues that ended the Bull market. That will take time, and in the interim, it is more "churn and burn". The market volatility has burned both Bulls and Bears in the last 6 months.
While many remain focused on the positive indicators that have surfaced, I can't dismiss an indicator that has a pretty good track record of forecasting. Long-time readers likely know I don't focus much on the Dow, but this is one indicator that I have used time and time again.
The "December Low" indicator implies that a violation of the December low bodes ill for the rest of the year. It has an excellent history and the last time it was triggered was the start of this Bear market last year. It was one of many signals that I used to declare the change in trend had arrived.
Recently, the Dow Jones Industrial Average closed at its lowest point (32,656) since last November, thereby marginally violating the December '22 low (32,757) on a closing basis. This week's low went another step further with the DJIA closing at 31,909. Does it mean the rest of the year is likely to be bad? Perhaps, but in keeping an open mind, it's nothing I am going to get worked up about right now. While we have to be aware of the many historical indicators that have shown to be reliable, we also have to realize we shouldn't overreact to any One signal. However, if the bulk of evidence starts to align with this signal it is best to take note and respect that, and now is a time to be extra vigilant.
The bottom line: Conflicting signals and crosscurrents everywhere make for a very confusing scene. For most investors, an uncertain confusing scene leads to a loss in capital. This is no time to be listening to the gurus that are calling for S&P 3200, nor is it time to be listening to the analyst that says S&P 4300 is next.
Instead, do what Savvy Investors are taught to do. Listen to the market, and position accordingly.
The 2023 Playbook
Right now it is all about stocks in Bull uptrends, and it is undergoing a facelift. Energy is the Only sector in a Bull market trend. The sub-sector of Defense and Aerospace ( ITA ) is also in a positive trend and is worthy of new investment.
That leaves investors looking for near-term "long" opportunities with a very limited playing field.
Sectors
Energy
Oil prices continue to churn around in the mid-high 70s which is a range is has been stuck around for more than two months. The low $70s has been a price floor since early December while the low $80s has been a ceiling.
Barring any break to lower prices, energy stocks should remain a sector of interest. The recent weakness in the group that has some of the highest dividend payouts in the S&P 500 is an opportunity to add exposure.
We've already seen how owning Oil and Gas stocks has paid off handsomely in the last 12 months. In the last two months, we've seen the Energy ETF ( XLE ) get rejected at resistance, tumble to support, chopped around in the middle of its trading range, and once again at support. A wild ride, all within the context of a BULLISH trend. No other sector can make that claim.
Liquefied Natural Gas
US LNG exports are being "limited by a lack of offtake deals"; in other words, prenegotiated contracts are relatively scarce, making finding a destination for US LNG cargoes a challenge. Given the near-permanent switch to LNG supplies for Europe, it seems inevitable that long-term contracts will be struck, but for now, the US is effectively a wildcat export operation.
As for US exports, volumes are not yet at new highs, but the reopening of the Freeport facility damaged last year and the addition of new export capacity mean a new record level of LNG export volumes is inevitable.
Cheniere Energy ( LNG ) is my preferred play in this space.
Financials
The Financial ETF ( XLF ) is another group that was caught in a trading range until it completely broke down this week. On the back of the SVB Financial collapse, Thursday was one of the worst days for bank stocks in years.
A couple of weeks ago the Bulls were wondering if the Banks would emerge as leaders of the rally. At the close on Friday, they are contemplating the group leading the entire market lower. ( XLF ) lost 8.7% this week, while the regional Bank Index ( KRE ) is now at 52-week lows, after suffering its worst week since 2020.
Healthcare
The Healthcare ETF ( XLV ) continued its slide as it broke to new lows this week. The sector is now down 10+% from its recent high on December 14th. The continued weakness has disrupted the longer-term Bull trend and that represents another concern for the Bull story. I suspect this sector will get back on its feet, but in the meantime, this "haven" for the Bulls is gone.
Biotech
There was solid support in and around the $78-$80 range for the biotech ETF ( XBI ), and that range was tested and it failed. The Bear to Bull reversal pattern looks to be over. With near-term support eliminated, this could turn into a total rout for the group. That takes away another area that looked promising and turned it into a question mark.
Gold, Silver, and Uranium
The Gold ( GLD ) and Silver ( SLV ) ETFs broke down recently and are searching for support. However, the late-week action did show signs of stabilization. GLD remains in a long-term Bullish pattern so I'm more inclined to delve into trades there rather than in the Silver ETF.
The chart of Uranium shows the same broken-down picture. However, I view ( URA ) as a long-term holding that plays a role in the global energy transition, so for now, I'll HOLD.
Technology
The S&P 500 Tech sector ( XLK ) finished the first day of March with its 50-Day moving average moving back above its 200-Day moving average ( A Golden Cross) for the first time in nearly a year. Given both moving averages were trending higher, that made for the sector's first golden cross since the spring of 2020.
You might remember that I've stated that I don't pay too much attention to these "crosses" as there is plenty of historical evidence to indicate the results after these events are "mixed".
Bespoke Investment Group;
Regarding the Technology sector (XLK), going back to 1990, there have been 20 other upside crosses of the 50-DMA, 13 of which were golden crosses. While this pattern is typically considered a bullish signal, historically performance has been mixed.
Returns have been consistently positive, save for one month later which has only seen the sector higher around half the time, but that positivity rate is only significantly larger than the norm for the one-week and one-year periods.
Additionally, one week and one year out are the only times in which the average or median gains have been considerably larger than what has been typical since 1990. To sum up, golden crosses for the Technology sector haven't been a wildly bullish development on a historical basis, but they've also been far from bearish."
Up until this week, the NASDAQ Composite ( QQQ ) held up fairly well, despite it being mired in a deep Bear market trend. The Daily chart now indicates the rally is over as the uptrend has completely broken down.
Semiconductors Sub-Sector
While the broader market has been under pressure the last several weeks, relatively speaking semiconductors have been holding up pretty well. The uptrend from last year's low remains intact, and the Philadelphia Semiconductor Index ( SOX ) is still trying to hold above support at its highs from late 2022 as well.
Given their leading nature for the market, strength in the semis usually translates to strength for the broader market. Perhaps the Bulls will look to this group to save the day. However, if near-term support breaks it sends another negative signal to the health of the overall market.
International Markets
China
After rallying 59% from the lows in late October and making recent highs right before the Lunar New Year break, MSCI China has corrected 9% in the past month (vs. -3% for Emerging markets and +2% for Developed markets), prompting investor questions about the durability of the reopening-led rally and potential catalysts that could drive the market higher.
I view the recent action as a "pause" after a quick strong move. The principal theme in the Chinese markets will gradually shift from reopening to recovery, with the driver of the potential gains likely rotating from multiple expansions to earnings growth/delivery, reminiscent of a transition from the Hope to Growth phase in a typical equity cycle. The equity cycle can then transit to a Growth phase where earnings are typically the primary driver of returns
Investor positioning is conveying the same message: Hedge fund investors have substantially re-risked in Chinese stocks, predominantly in Offshore equities ( FXI ). For mutual fund mandates, while fund managers have also net-bought Chinese stocks in this upsurge, they are still meaningfully "underweight" China in their allocations.
With valuations returning close to mid-cycle, equilibrium territory, we can expect earnings growth realization and upgrades to take over to drive further equity gains. Unlike other markets where earnings are flat and/or declining Chinese EPS growth expectation stands at 17%, putting China as one of the fastest-growing markets in the region this year.
There is a strong case to be made for the onshore A-share market ( ASHR ) to narrow the underperformance gap vis-a-vis Offshore equities in the coming quarters. ASHR and the KraneShares ETF ( KWEB ) which is concentrated in technology has been part of my Playbook for a while. For those that can look past the "issues with China", they are both at attractive entry points now.
Cryptocurrency
It's been another up-and-down couple of weeks for crypto markets. The news slate recently further tarnished the crypto reputation as major crypto lender bank Silvergate ( SI ) is undercapitalized. The Wall Street Journal published an article detailing how Tether and Bitfinex used falsified documents to acquire bank access.
As for cryptos themselves, performance has been weaker. Most of the largest cryptos have fallen back below their 50-Day moving averages. Outside of the two largest currencies, Bitcoin and Ethereum, a number of these largest cryptos are trading in or near extreme oversold territory.
From a technical perspective, even though Bitcoin has broken down below its 50-DMA, the rough uptrend formed over the past couple of months is for the time being still intact. If that uptrend were to be breached, that would leave the lows from a month ago and the mid-January lows as the next support to watch.
But further below that would be a no man's land until the 200-DMA.
Final Thoughts
There will always be inherent uncertainty built into investing in the markets, and we have an inordinate amount of that now. Any short-term plan revolves around creating a mental framework for what we believe will play out. Then it's time to observe and adjust over time as new information is presented and the markets either follow or diverge from our initial thoughts. The first problem with this backdrop is the changes are occurring much more rapidly than we have faced before. The second is something I've discussed in the past. There is no playbook, no historical precedent that can be counted on to provide an investor with a game plan.
Highlighting the speed of the market reversals lies in the price action in the last couple of weeks. The positive action we saw on March 2nd and 3rd, can now be viewed as a Bull trap. Just like the breakdown on March 1st that trapped the Bears. Now, another Bull trap occurred last Monday when the S&P traded up to 4078. That's been the norm lately, a quick strong move that gets everyone bullish, followed by an equally quick strong move that gets everyone bearish.
One day investors cheer about what they believe will be the end of the rate hiking cycle, the next, inflation, and a higher Fed terminal rate are part of the conversation. I suggest investors need to take a data-dependent approach. Avoid cheerleading, and look at the data. Right now, there is One outcome that has a High probability of occurring. A higher Fed terminal rate, a rate that will stay in place for a lot longer than the consensus is forecasting today.
When the data changes, my viewpoint will change. Invest accordingly.
Thanks to all of the readers that contribute to this forum to make these articles a better experience for everyone.
Best of Luck to Everyone!
For further details see:
Wall Street And The Energy Transition