NFLX - Warner Bros. Discovery: Undervalued Against Peers As Earnings Are Poised To Rise
2023-11-03 04:39:40 ET
Summary
- WBD continues to show net loss since the merger, but this scenario will soon change. It is generating FCF and Earnings will follow.
- Compared to its peers, WBD is significantly undervalued and the market is failing to capture the potential upside of its streaming services even when considering the decline of Networks.
- By adjusting WBD's Net Income for Intangibles Amortization, Restructuring efficiencies and a combination of gains in DTC and loss in Networks, I believe WBD has significant upside.
- I deem WBD a buy.
Warner Bros. Discovery (WBD) is the curious case of the company that has no earnings but a positive cash flow. Investors are used to the contrary: companies that showcase stellar earnings but fail to generate any meaningful cash flow to reinvest, pay dividends or buy back stock. Earnings higher than Cash Flow is the rule, that's why there is a Cash Conversion Ratio to highlight how much of the earnings is turning into actual Cash Flow. These two metrics can't be too far apart as FCF, without unusual items, would usually be composed of: Net Income + Depreciation - Change in Working Capital - CapEx. In the case of WBD, either Net Income should rise to be more in line to FCF or FCF should drop. This article will reason that Net Income is poised to rise significantly over the coming years due to improved Direct-To-Consumer ((DTC)) profitability and accounting rules related to intangibles amortization.
WBD and its Peers
Before diving into WBD financials, let's review how WBD compares to Disney ( DIS ) and Netflix ( NFLX ) - note that I recently wrote an article about Disney on why I think its valuation is too rich. I chose these two companies because my understanding is that WBD, in relation to Disney, has an IP equivalent (or even better) than its rival and is also facing challenges in its Linear Networks segment, and, in relation to Netflix, because streaming is the major piece in WBD's strategy for the future.
Below I have built a comparison between the P&Ls of these three companies by using the last twelve months of data - WBD until Q2'23, Netflix until Q2'23 and Disney until Q3'23. As you can see, despite all three generating similar FCF in the timeframe used, WBD is worth 1/6 of Netflix and almost 1/8 of Disney. There could be several reasons why Netflix and Disney should be more valuable than WBD: Netflix has 2.5x the number of subscribers, it has 1.5x the ARPU and generates a low double-digit Net Income, while Disney has double the revenue, has a lower Debt to Capital Ratio and 1.5x the number of subscribers, all in comparison to WBD.
P&L Comparison, in millions except Market Cap (Disney IR, Netflix IR, WBD IR, Author)
However, $24 billion is too little for WBD even when discounting all good things that Disney and Netflix have. In my opinion, the market is giving such a low valuation to WBD primarily because: 1) it is still in the red for Net Income and 2) it is a much leveraged company than its peers. In the next section, I'll show why profitability for WBD is just around the corner and the company's debt shouldn't be as scary as it looks.
WBD Financials and Valuation
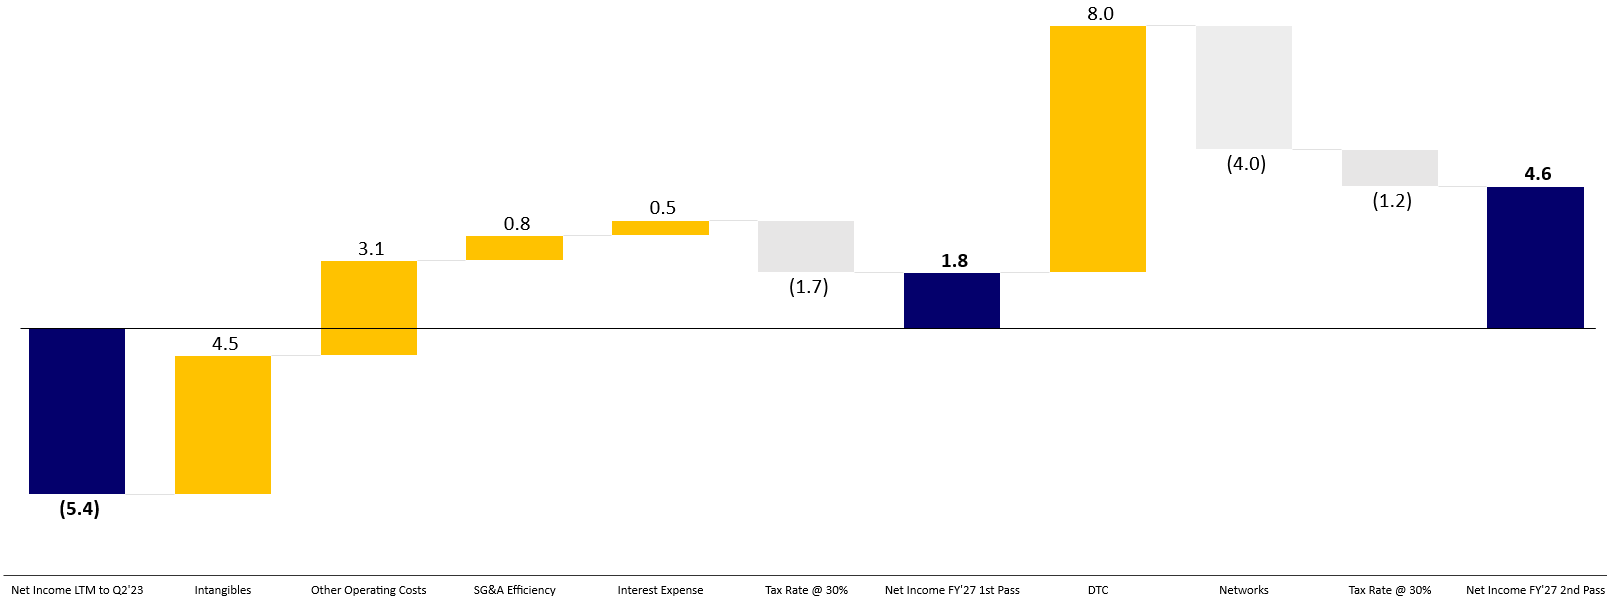
Similar to my article about Disney, I'll start by sharing a walk to highlight where I believe WBD's Net Income is going and what are the levers that will bring it there. The reason why I'm forecasting until FY'27 will be clear when I explain the Intangible Assets amortization, but by no means I expect that the market will recognize WBD's value only in FY'27.
WBD's Net Income Walk to FY'27, in billions (WBD IR, Author)
Net Income 1st Pass
As you can see from the walk, my first Net Income estimate (called 1st Pass) is close to the middle of the walk and assumes only the almost certain movements that will happen during the following years. I arrive at $1.7 billion with a very conservative approach.
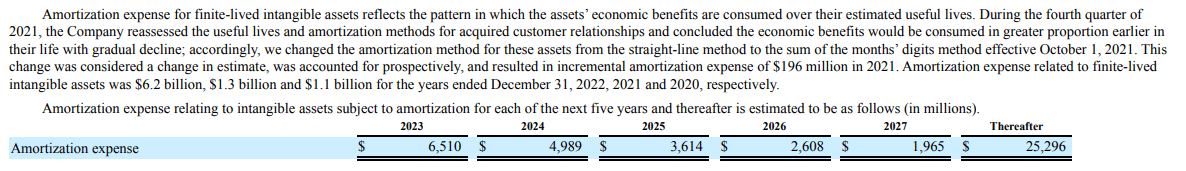
Intangibles: You can find the following table in page 86 of WBD's 10K. It highlights the expected amortization of Intangibles Assets from FY'23 to FY'27 and onwards. Note that it is expected to decline by $4.5 billion until FY'27, same amount I considered in the Net Income Walk. The reason why amortization is so accelerated in the earlier years comes from the adoption of the sum of the months' digits method for amortization instead of straight-line method. The reason could be simply that they do expect to extract more value earlier in the period than later, but this also has the effect of paying less taxes in the short-term. After FY'27 it is likely to be around $1 billion, so that amount would be added back to Net Income if you want to forecast FCF.
Expected Amortization Schedule of Intangibles Assets (WBD IR)
Other Operating Costs and SG&A Efficiency: On page 33 of the same 10K you can also find WBD's plans about the ongoing restructuring and that they expect it to be finalized by the end of FY'24. The amount spent has significantly decreased since Q4'22, so those $3.1 Billion in the P&L LTM will soon be a thing of the past as well.
WBD's Restructuring Plans (WBD IR)
Now if a company restructures, they should expect to achieve an efficiency in terms of SG&A. Here my $0.8 billion assumption is very conservative because I'm expecting SG&A as % of Sales to drop to only 22% (versus 20% of Netflix and 18% of Disney). A $0.8 billion SG&A Efficiency means that it would take 4 years to recover a $3.1 billion investment. Again, I prefer to go on the conservative side as restructuring usually do not capture everything that the management expects, so let's consider a bonus everything that comes above those $0.8 billion.
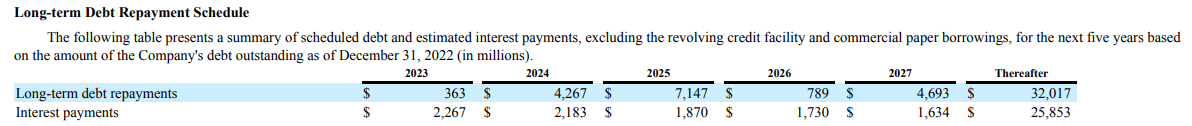
Interest Expense: Again from WBD's 10K (page 95), we can see the debt maturity for the next years and the related interest expense.
Debt Repayment Schedule and Interest Expense by Year (WBD IR)
Remember that I mentioned debt leverage as one of the main concerns for WBD investors. Using the schedule from the 10K and a simple FCF Forecast, we can see that WBD is expected to generate enough cash to pay down debt that will come due between FY'24 and FY'27, thus reducing Interest Expense from $2.3 billion in FY'23 to $1.6 billion in FY'27. That is pretty much the variance that I have included in the walk, but again a little more conservative as part of that $17 billion debt will likely just be refinanced and not completely paid down.
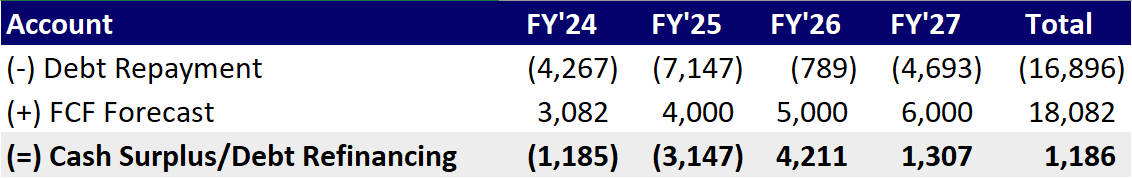
FCF Forecast versus Debt Repayment Schedule, FY'24-FY'27, in millions (WBD IR, Author)
The FCF Forecast for FY'27 is based on the $4.6 billion called Net Income 2nd Pass in the Net Income Walk, plus $0.6 billion for Depreciation related to Capex, plus $2.0 billion for Intangible Amortization and minus $1.2 billion for Capex. FY'25 and FY'26 are assumed as a progression towards that $6 billion in FY'27.
Tax Rate: Given that WBD had a beneficial $1 billion in Tax Expense for the last twelve months, if it starts to generate $2.4 billion in Net Income I'm assuming it will pay 30% in Tax Expense, which amounts to $0.7 billion. The $1.7 billion the Walk is the variance between the beneficial $1 billion and the future tax expense of $0.7 billion.
Net Income 2nd Pass
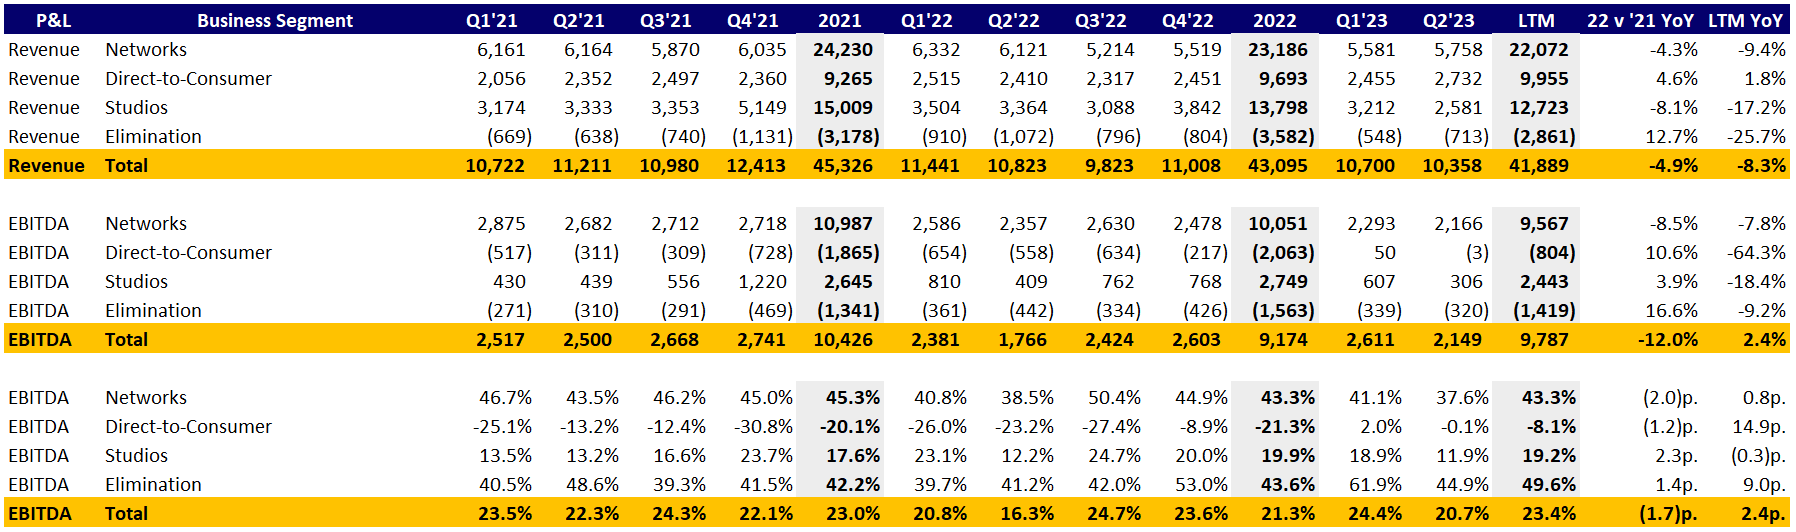
In this section comes the most uncertain piece of WBD's business. The questions of how much Net Income will it lose from Linear Networks and how much it will gain from DTC are key to our valuation. The data below shows Revenue and EBITDA for each of WBD's segments. It is a pro-forma statement provided by WBD and it considers as if the merger had occurred in Jan 1st of 2021, so it helps us see the quarterly trend for each segment. I'll use EBITDA as a proxy for Net Income since we are addressing Interest, Taxes, Depreciation and Amortization in the 1st Pass. I'll also ignore Studios and Elimination and hold them constant at LTM figures.
Revenue and EBITDA by Segment (WBD IR)
By looking at the quarterly trend, it seems obvious that Networks has only one direction in both revenue and EBITDA: down. Today, Networks generates almost $10 Billion in EBITDA for WBD, which is pretty much all of WBD's EBITDA when you consider the other segments and Elimination. However, it likely won't be zero. According to Insider Intelligence , 2023 is the year that the non-pay TV households will surpass the pay TV households in the US, but note that it is expected to somewhat lose momentum in the future. If we assume that Networks EBITDA is proportional to the number of US households with cable, then a loss of $4.0 billion (40% of total) as highlighted in the Net Income walk is equivalent to the subscribers falling from 66 million to less than 40 million (down 26 million, or 40% of the 66 million). Again, I don't believe that subscribers will go down to zero, so 40 million in the medium-term looks reasonable. Needless to say that inside the Networks segment there is some international revenue, but the cord-cutting trend exists worldwide.
For DTC, Zaslav himself confirmed the strategy of higher profitability during the Q2 earnings call :
We said we were going to build a strong, sustainable direct-to-consumer strategy focused on profitable growth as opposed to chasing subs at any cost, and we are.
While Netflix has had its streaming product pretty much in the same format for more than 10 years, WBD is only now launching its Max product which will combine all brands they own. As of the end of Q2'23, WBD had 95.8 million subscribers with an ARPU of $7.71, while Netflix had 238.4 million subscribers with an ARPU of 11.54. I do not expect WBD to achieve the same number of subscribers as Netflix, but it could command similar or even better ARPU once Max receives all the features planned and is distributed worldwide.
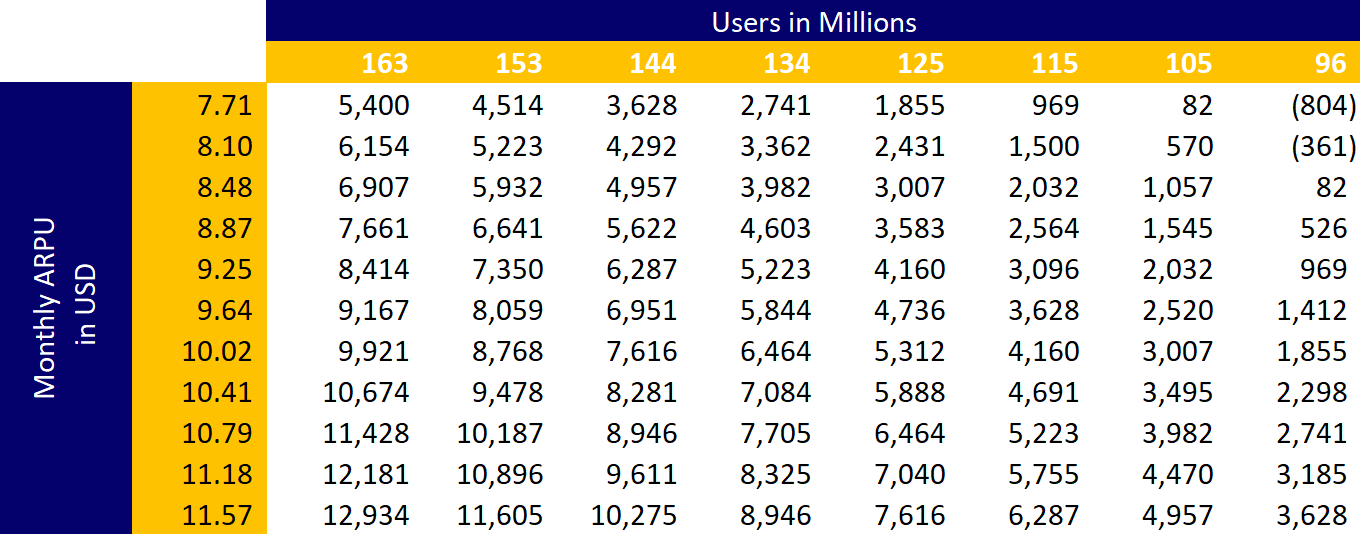
By running a sensitivity analysis of DTC's EBITDA for subscribers and ARPU, it's possible to see that WBD doesn't need the same amount of subscribers or ARPU of Netflix to achieve the $8.0 billion I forecasted in the Net Income walk. My bet would be that WBD will achieve EBITDA growth through higher ARPU rather than increase in subscribers, mainly because the Max product is still in its early days. How will WBD include offerings like news and sports and how they will monetize it needs to be closely followed by the investor, but to my thesis to hold I'll place much more emphasis on ARPU growing to achieve +$10 than on subscribers growth. Numbers in the white space are the EBITDA generated by the combination of Subscribers (columns) and ARPU (rows), while the top-right $804 million EBITDA is the actual LTM number.
DTC EBITDA Sensitivity Analysis (WBD IR, Author)
Finally, by combining the DTC EBITDA sensitivity analysis and the number of US cable subscribers, the reader can also create his own forecast and replace my estimate of $4 billion gain in the Net Income Walk ($8 billion gain from DTC and $4 billion loss from Networks). Any combination you may find more credible than mine, you can add on top of the $1.7 billion that I presented as Net Income 1st Pass. Important to always remove 30% of this amount as Tax Expense (I considered $1.2 billion over the $4 billion).
Given a current Market Cap of $24 billion, that $1.7 billion in 1st Pass means WBD trades at 14 forward P/E ratio (compared to Disney's 22x and Netflix's 34x). If we add the $4 billion I estimated, than WBD could potentially be valued at $80 billion (more than 3x its current valuation) using a 14 P/E or $114 billion (almost 5x) using a P/E of 20.
Final Thoughts
WBD is about to report Q3 earnings and while this article was being written the company jumped almost 10% without any significant news. I expect some short-term volatility in this stock to continue as earnings could still be a mixed bag due to Max's ramp-up and investor sentiment will be split between those who believe that the company won't be able to generate enough cash and those who do. My focus with this article is to highlight a more medium to long-term opportunity in price appreciation given that WBD trades at an undemanding 14 P/E ratio based on very conservative assumptions of its future Net Income.
The main risk the investor needs to assess is how much WBD stands to lose from Networks in the future and how much it will gain from its streaming business. Based on the cord-cutting trend and on the sensitivity analysis for the DTC segment, I believe that WBD has significantly more upside than downside. Investors need to closely monitor these two segments, with a special eye towards evolution of ARPU.
For further details see:
Warner Bros. Discovery: Undervalued Against Peers As Earnings Are Poised To Rise