BILS - Watch For A Spike In Volatility: Short Term T-Bills And CDs Recommended
2023-11-02 10:14:36 ET
Summary
- The Volatility Index is used by investors to track the short-term direction of the stock market.
- The VIX has shown a correlation with the S&P 500 during past recessions, but its effectiveness as a forward indicator is uncertain.
- Factors such as rising Treasury yields, increasing government debt, and the dumping of US bonds by adversaries and allies pose risks to the market.
- Investors can shelter their portfolios in short-term Treasuries and CDs, which can protect assets while allowing enough fluidity to take advantage of higher rates or lower stock prices in the future.
Tracking the Markets Using the VIX as a Tool
While Wall Street shudders from a blizzard of bad news, many investors keep their eyes on the Volatility Index seeking clues as to where markets are headed in the short term. The Cboe (Chicago Board Options Exchange, pronounced CEE-boe) introduced the Volatility Index ( VIX ) in 1990. The index measures volatility in the stock market by monitoring the accelerating and decelerating demand for 30-day call and put options on the S&P 500. Added to this information is put/call ratios that indicate whether investors have an optimistic or pessimistic view of where markets will be in one month. If calls outnumber puts, this would be an overall optimistic view, but the reverse would indicate a pessimistic view.
As the theory goes, because the VIX tracks 30-day options on the S&P 500, the index’s plotted numbers represent a financial forecast of 30 days into the future. Investors use these numbers as an indicator of what is on the market horizon. How well does it work? The graphs below indicate there is absolutely a correlation between the VIX and the stock market. Whether a VIX spike offers enough lead time to be considered a forward indicator is an open question. But knowing the Volatility Index practically always moves in the opposite direction of the S&P 500 during a sharp sell-off can be useful.
Fig. 1
Fig. 2
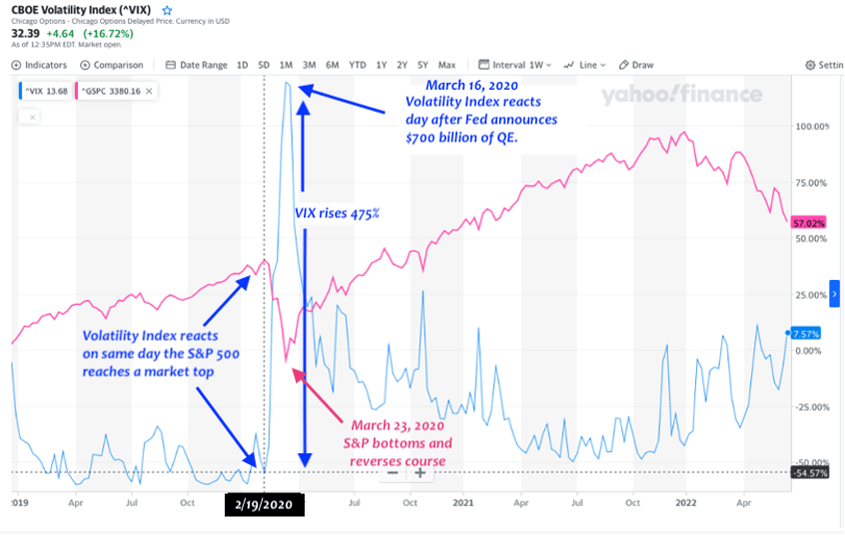
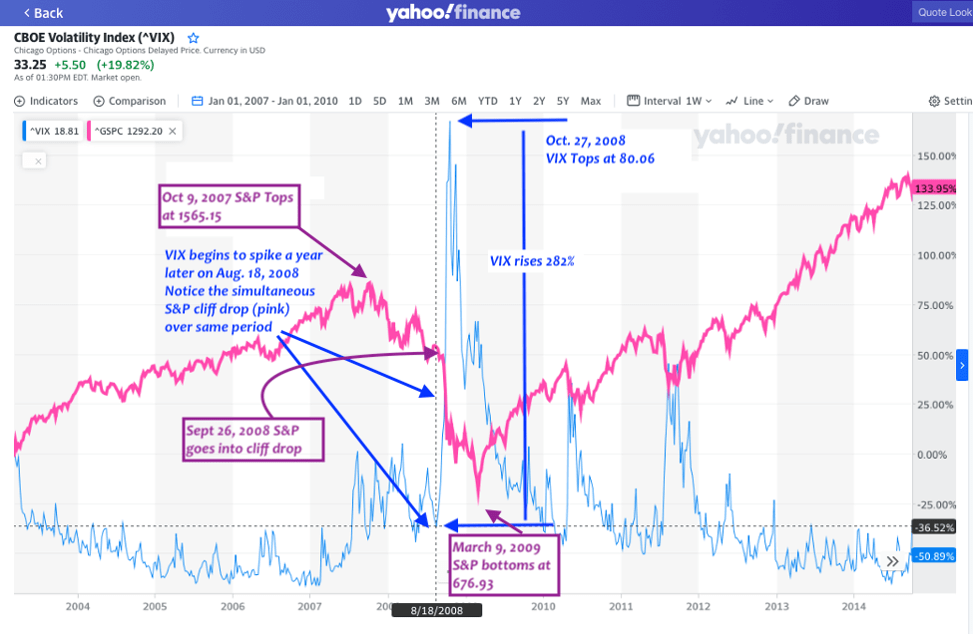
Notice that the S&P 500 and the VIX line charts mirror each other during both the 2020 Recession and the Great Recession of 2008-09. This is why some investors keep an eye on the Volatility Index when markets signal an approaching recession.
Of these two recessions, only at the onset of the 2008-09 Great Recession did the VIX act as a forward indicator, going into a dramatic rise beginning Aug. 18, 2008 (Fig. 2). At this point, the S&P 500 dropped just slightly and went sideways for one month before going into a dead drop. This is exactly how the VIX is supposed to work, and this time around it did.
However, at the onset of the 2020 COVID Recession, as you can see from the dotted line in Fig. 1, the Volatility Index went on a sharp incline the very same day the S&P 500 went into a sharp decline, Feb. 19, 2020. In this case the VIX provided no advanced warning, perhaps because the COVID pandemic was a massive black swan that arrived abruptly. Even though the COVID shutdown was not activated until March 16, 2020 , the S&P and the VIX reacted quickly, in tandem, one month ahead.
Ironically, once the VIX reached a top in the 2008 chart (Fig. 2), it preceded an S&P bottom by a leisurely 5 months, so far ahead it wasn’t particularly helpful as an indicator. Then, in 2020, the VIX top preceded the S&P bottom by just one week. So even though that information may have been useful if it was a consistent indicator, the inconsistency of the VIX/S&P relationship makes it a foggy indicator at best. But interesting and useful to watch, insofar a cause-and-effect relationship is apparent in the charts.
Market Indicators Signal a Recession is Near
A series of factors are coming together to create a bleak picture for both US and global markets. Some have been on the horizon for a while, some are new.
US Treasury yields are soaring
When the Fed raises the federal funds rate, which collectively lifts all other interest rates, investors tend to shun secondary Treasury bonds with low yields in favor of newly issued bonds with much higher yields. Unfortunately, banks and corporations are compelled to liquidate long term bonds into the secondary market for routine business needs. But when bond holders sell into a market of rising rates, they are forced to accept steep discounts. That drives the price of Treasuries even lower, sending rates higher. Now that nations around the world are dumping US Treasuries (more on this below) , rising bond rates are accelerating.
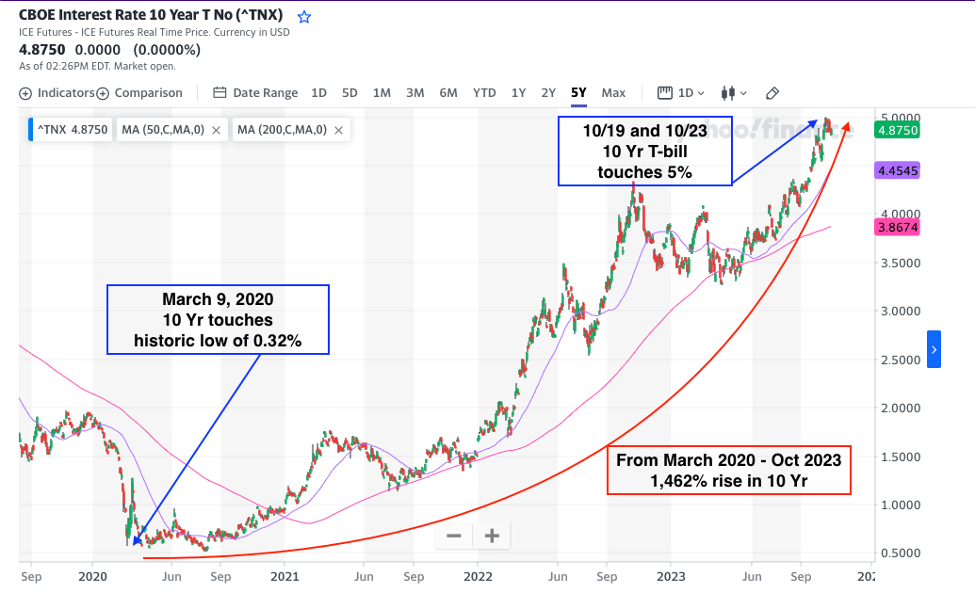
Treasury rates have been on the move since March 9, 2020, when the interest rate on the 10 Year was at a record low of 0.32%, rates not seen since the Great Depression era. Since then, the rates have risen a scorching 1,462% to 5% in late October. They are currently hovering just below that watermark.
Fig. 3
While 5.0% is still 88 bps lower than the historical average of 5.88% , the sharp and sudden rise could conceivably cause turmoil in the markets. This indicates the 10 Year Treasury has higher to climb. If it over-corrects, which is possible insofar quantitative easing was an unnatural manipulation of the economy, it could go considerably higher than the average. In 1981, the 10 Year Treasury soared to over 15%.
Rising Rates Could Exacerbate Increasing Government Debt Load
Soaring rates have turned US government debt into a runaway train. US total public debt stood at $33 trillion in September of this year. Just one month later the government added another $640 billion . Meanwhile, the deficit effectively doubled from fiscal year 2022 to 2023 from $1 trillion to $2 trillion.
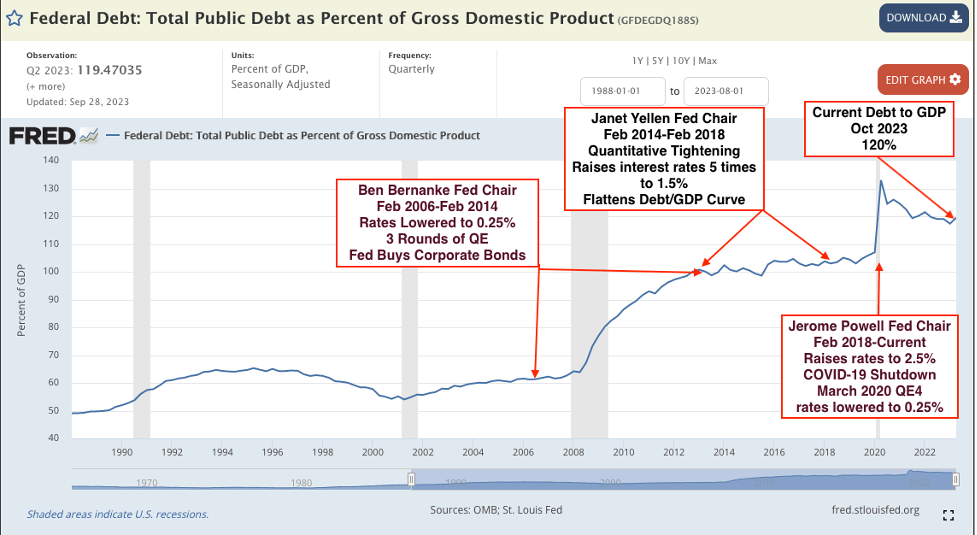
In the second quarter of 2020 the US debt to GDP soared to an all-time record of 133%. It has since come down to 120%, which is still considerably higher than the last time the US debt to GDP set a record of 113% in 1945 in the aftermath of WWII.
Add these numbers to the soaring interest rate, and the outlook for the US’s financial future is grim.
Another Round of Quantitative Easing Very Unlikely
Many investors assume that if markets begin to tumble, as they did in 2008 and again in 2020, the Fed will rush to the rescue with another round of QE. The problem with that scenario is that the Fed is no longer setting the rates on US Treasuries—the global marketplace is.
If the Fed did conjure trillions of dollars to buy up a load of Treasuries to drive interest rates down, such an artificial maneuver, while bond rates are soaring, could send inflation through the roof. When Prime Minister Liz Truss and her financial czar, Kwasi Kwarteng, conjured nearly $50 billion in government bonds to finance a tax cut for Britain’s top earners, the move sent the pound sterling into a tail spin. Prime Minister Truss's successor raced to undo her financial policies.
The Russian Alliance a Lingering Threat to the US Petrodollar
The Fed is likely to choose the sanctity of the US dollar over Wall Street due to the current threat posed by an alliance of nations, both large and small, gathered together by Russia.
The group of nations known as the BRICS (Brazil, Russia, India, China, and South Africa) first gathered together for a financial summit in Russia in 2009. Since then, the group—now devoted to avoiding the US petrodollar by conducting international trade in their own currencies—has been joined by thirty-three additional nations, including Cuba, Egypt, Iran, Saudi Arabia, Indonesia, and over a dozen other countries, most of them African.
While some of these nations may be trying to topple the petrodollar for the sake of global politics, others may simply be onboard for the sake of financial convenience.
Considering all this, it is extremely doubtful the Fed—whose primary reason for existence is protecting the integrity of US currency—would allow the dollar to crash while financial vultures are circling. Far more likely, Wall Street will be on its own to deal with the fallout of a recession while the Fed scrambles to save the dollar.
Adversaries and Allies Alike are Dumping US Bonds
The House Speaker impasse that gripped Congress for weeks occurred on the heels of a credit downgrade of US sovereign debt from AAA to AA+ by credit rating agency Fitch this past August. If wrangling over government debt continues—along with white knuckle rides toward shutdowns with last second reprieves—there could be more credit downgrades in the offing.
Even before the downgrade, there were already signs of trouble in the US sovereign bond markets. In the 16 months between March 2022 and July 2023 China reduced their T-bill stockpile by $191.4 billion. In the same period Japan, Ireland, and Brazil likewise reduced their holdings: Japan by $116.5 billion, Ireland by $44.4 billion, and Brazil by $8.6 billion.
According to Japanese officials , the reason for unloading Treasuries is to shore up their flagging currency by freeing up money to purchase their own government bonds.
Considering the haphazard condition of the global economy, this trend could continue for quite some time.
Yield Curve Inversions
Yield curves for US Treasuries have been inverted so deeply for so long, investors seem to have screened out this information, even as yield curve inversions are among the most accurate predictors of recessions.
The yield on long-term bonds tend to go down before the onset of a recession because fund managers re-balance their bond portfolios when they sense a market downturn in the offing. Fund managers sell off equities and invest in more long-term bonds to keep their assets safe from the ravages of a recession. It took the S&P 500 seven years to recover from the Recession of 2000, peak-to-peak. It took six years for markets to recover in the wake of the 2008 Recession, and that was with a prodigious amount of quantitative easing from the Fed. This is why institutional investors favor 10 Year Treasuries when sheltering their assets from a recession.
Institutional demand for longer-term bonds bids up the price of the 10 Year Treasury, which sends the rate lower (rate is inverse to price). This is how and why the yield of the 10 Year dips below the 2 Year in the lead up to a recession in what's known as a yield curve inversion .
However, if the yield curve de-inverts because the long-term rates rise rapidly and overtake the short-term rates (as opposed to short-term rates dropping to reverse the curve) that indicates that the global marketplace is shunning long-term bonds, which drives down the price and sends rates upward.
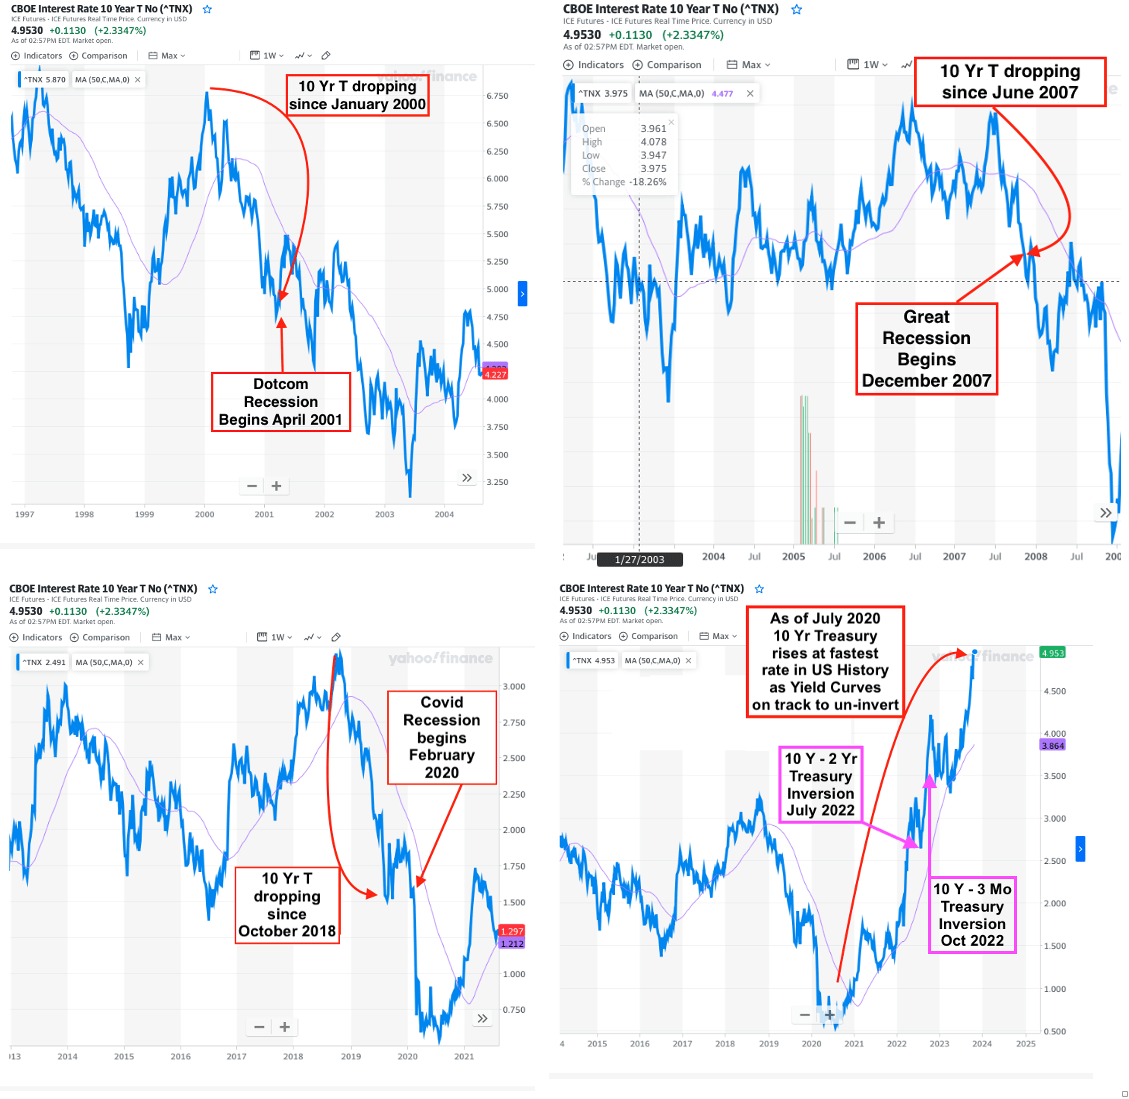
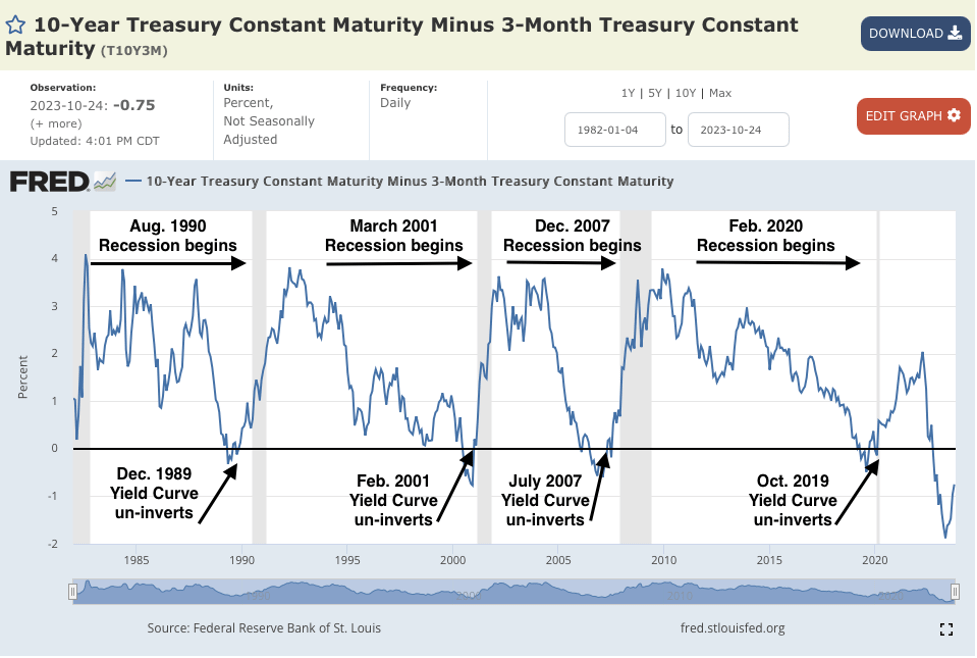
In 2023, the threat of yield curve inversions and de-inversions is particularly perilous. In the past three recessions, there was a steep drop in the 10 Year Treasury just before the recessions began (Fig. 4). But as of now, the US 10 Year has been rising the fastest ever in US history, even as yield curves are de-inverting, signaling a recession on the horizon.
This is due to a phenomenon known as bear steepening . This happens when the yield curve de-inverts, not because short-term bond rates are falling due to an increase in demand, rather long-term bonds are rising due to a sudden decrease in demand.
Fig. 4
In the graph below, notice how the yield curve comes back above the line shortly before the official start of a recession. During the past year, the yield curve has become much more deeply inverted as compared to inversions of the past. This indicates the next recession might be deeper and longer than usual.
Fig. 5
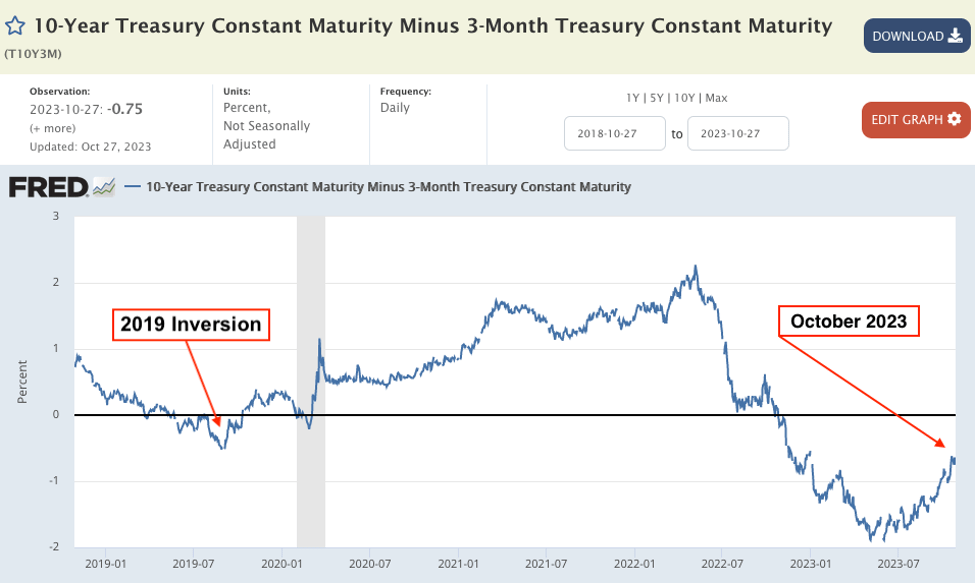
Judging from the close up of the same graph below, if the 10 Year minus 3 Month Treasury curve follows its natural trajectory, it is on track to de-invert around the end of this December. A recession will likely start a month or two after, which would be toward the end of February 2024. However, rapidly rising bond rates may act as an accelerator. So, it’s a good idea to watch the markets closely during this time, especially the Volatility Index.
Fig. 6
US Public Debt to GDP is at Historic High
While the Debt to GDP—now standing at 120%—has relaxed a bit after hitting an all-time high of 130% during the COVID Recession in 2020, it is still much higher than the last historic high of 113%, reached in 1945 in the aftermath of WWII. This unusually high Debt to GDP is in part the result of the Fed’s long-standing QE policy added to the COVID pandemic relief package. This is a very uncomfortable position to be in as the US government is now financing an increasing number of war fronts—Ukraine, Israel, Syria, Iraq, and possibly Iran. All of this while interest payments on the national debt are now higher than the entire military budget .
Fig. 7
US Consumer Debt at Historic High
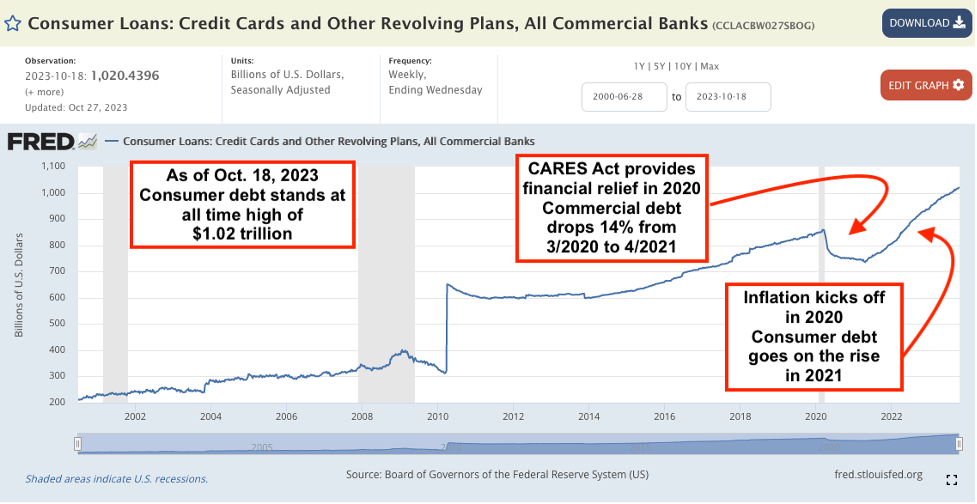
Americans were able to pay down their credit cards and other consumer debts during the COVID pandemic thanks to grants from the CARES Act (Coronavirus Aid, Relief, and Economic Security). From March 11, 2020, to April 21, 2021 consumer debt dropped from a record high of $858 billion to $736 billion, a significant 14% reduction in just a year.
But as inflation took hold in the years to come, families relied on credit cards to bridge the gap between their living expenses and the dwindling buying power of the dollar. This caused consumer debt to soar to an unprecedented high of one trillion dollars as of October 18, an increase of 35% since the recent low of April 2021.
Fig. 8
Most economists agree that a significant rise in household debt is often an indicator of a looming recession. American consumer debt has seen a dramatic uptick in the past two years.
High-Yield Corporate “Junk” Bond Rout May Be Imminent
Fed rate hikes mean that corporations with high-yield bonds will have a hard time refinancing them. If the bonds cannot be paid, defaults are automatic.
Fitch Ratings claims the default rate of high yield bonds (aka junk bonds) is on track to reach or exceed 5% by the end of 2023. This is nearly twice the default rate in June of this year when it stood at 2.6%.
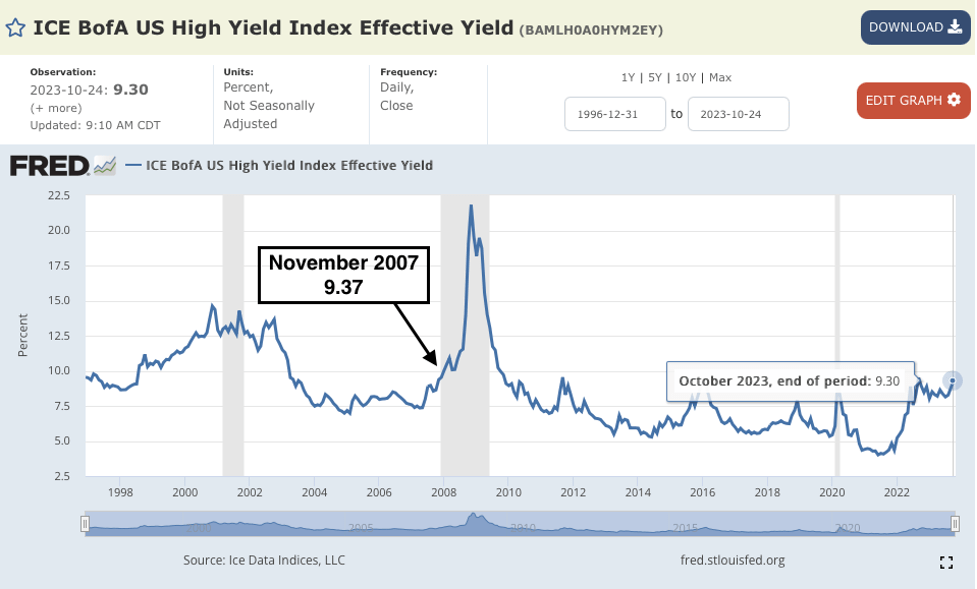
Throughout the quantitative easing years, the interest rates offered on junk bond debt were pushed to artificial lows of 4% and lower. As of October, they now stand at 9.3%, more than double where it was as recently June 2021.
Notice in the chart below that the average yield on junk bonds, or ‘High Yield Bonds’ has risen to 9.3%, just seven bps below where it stood at the onset of the Great Recession.
Fig. 9
Short-Term Treasuries and CDs Provide Safe Harbor
Rising bond rates are creating silver-lining opportunities to earn safe, guaranteed interest at rates upward of 5% and higher.
The advantage of short-term Treasuries (3-12 months) in lieu of long-term Treasuries is fluidity. Short term bonds allow investors to take advantage of higher rates in the future.
An argument to invest in long-term Treasuries with terms longer than 2-years is an argument that rates will do a U-turn in that time span and go back down. Considering the macro-economic circumstances cited above, it is far more likely rates will continue their climb into the near future.
The historical average interest on a 10 Year Treasury is 5.88%. As of now, 10 Year Treasuries are hovering just below 5%. But even before the 10 Year rates have returned to their historic average, the floor beneath high-yield corporate bonds is crumbling as companies scramble to roll over their bonds but fail to qualify for the higher interest rates. It’s unlikely rates will reverse course until these defaulting corporate bonds wash out of the system.
Another reason to prefer short term bonds is investment opportunities that arise during a steep market correction. Short term bonds allow investors to quickly free up cash to take advantage of stock market bargains once the markets correct.
Caveats:
When buying CDs from a financial institution, make sure they are insured by the FDIC (not all financial institutions are, so please check). Also, do some research to make sure your selected financial institution is standing on firm financial ground. Even with FDIC protection, if your bank goes bankrupt, getting your money back could turn into a bureaucratic headache.
If you are a DIY type, you can go to TreasuryDirect.gov to buy US Savings Bonds directly from the government.
Another thing to bear in mind, if you buy a short-term CD or Treasury and the interest rates go down, you will have missed an opportunity to lock in that higher rate for a longer period of time.
Summing It Up
There are so many red flags over global markets, now seems like a good time for investors to step away from Wall Street’s wall of worry and start thinking in terms of wealth preservation. The most secure investments have always been CDs and US Treasuries. Considering the generous rates you can get today versus the amount of risk building up in the stock market, every portfolio should have a significant portion invested in these fixed-income securities.
Keep your eye on the VIX. A spike generally signals a sharp market drop. While these signals are too inconsistent to create a solidly dependable forward indicator, the VIX tends to mirror the S&P 500 in some form or fashion, especially during a market meltdown.
For further details see:
Watch For A Spike In Volatility: Short Term T-Bills And CDs Recommended