SVOL - Watch Your VIX Shorts - Volatility Back On The Table SVOL At Risk
2023-04-26 14:12:53 ET
Summary
- The VIX futures curve suggests rocky times ahead this summer.
- SVOL is a net-short volatility ETF that generates a high yield by selling VIX derivatives premium.
- I'm a seller of SVOL here based on a currently low VIX ahead of some possible bearish event catalysts in the coming months.
- Buy a dip when the VIX spikes to the mid-20s is a more prudent play versus buying today.
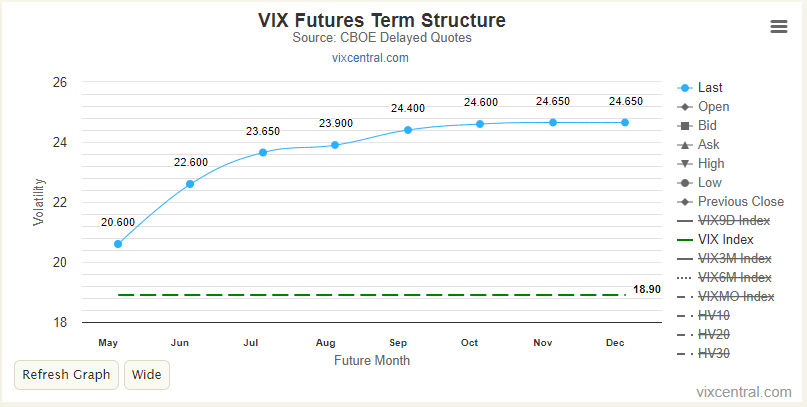
Is volatility set to soar? Tuesday's market plunge included a jump in the CBOE Volatility Index ( VIX ). Moreover, with a looming debt ceiling crisis on the doorstep, volatility traders appear to expect higher volatility in the broad market over the coming months, according to data gathered by VIX Central .
The VIX futures curve points to the chance of a mid-20s VIX as we venture into Q3. If that is the case, investors may want to take caution with short volatility plays. I have a sell rating on SVOL - I like the yield play but am not optimistic that the VIX will hold under 20 for very long. I would be a tactical buyer on VIX spikes into the mid-20s over the coming months.
VIX Future Curve Suggests Higher Volatility Ahead
The credit default swap market sees increasing chances of a U.S. debt default. The 1-year CDS is now priced at a cycle high of more than 150 basis points.
US CDS Implies Risks Ahead
Zero Hedge, Bloomberg
Meanwhile, the alligator jaws between Treasury volatility (MOVE index) and the VIX continues to be massive.
Stock & Bond Volatility Differ
Refinitiv, Wei Li (BlackRock)
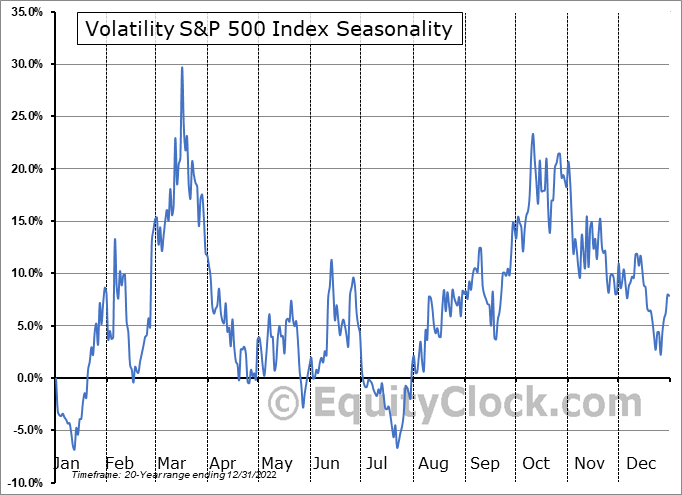
Historically, late April is not a bad time to begin layering back on VIX long positions, according to seasonal data from Equity Clock .
Late April: Opportune Time To Get Long Volatility
According to the issuer, the Simplify Volatility Premium ETF ( SVOL ) seeks to provide investment results, before fees and expenses, that correspond to approximately one-fifth to three-tenths (-0.2x to -0.3x) the inverse of the performance of the CBOE Volatility Index short-term futures index while also seeking to mitigate extreme volatility.
SVOL should primarily be used for income generation, asset class diversification, and as a tactical vehicle to express views of a lower anticipated VIX. In general, the fund will likely perform poorly when the S&P 500 falls big (which often coincides with a higher VIX).
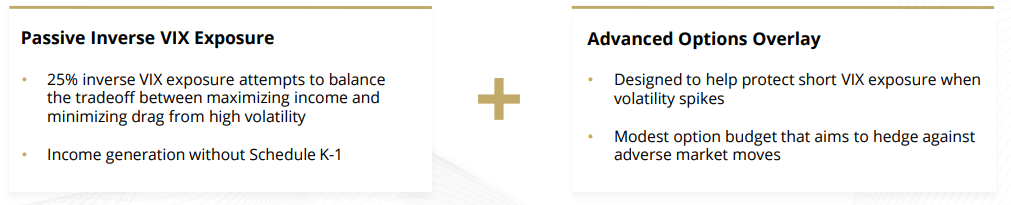
SVOL offers investors a modest short position in S&P 500 implied volatility along with a high yield. It essentially monetizes premium in the VIX futures market. A long position in VIX call options then partially hedges the short play to craft the fractional net short volatility portfolio.
SVOL Portfolio Strategies
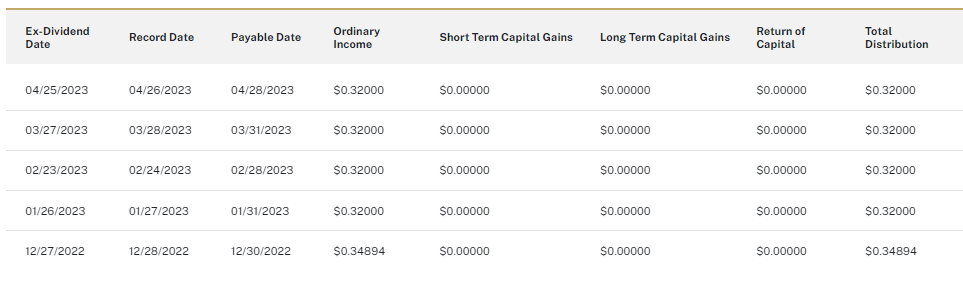
With a gross annual expense ratio of 0.66%, it is on the expensive side, but considering the complexity of the positions (that must also be rolled out periodically), the price to pay is actually not that high. Dividends are paid monthly on SVOL, and the current distribution yield (as of April 25, 2023) is 17.67%, according to Simplify ETFs.
The fund is nearing its 2-year anniversary, and so far, it has been a success considering the average daily volume of more than 170,000 shares over the last three months. Net assets are now more than $200 million.
SVOL Distribution History
Traders still must be cautious when entering orders with SVOL - the 30-day median bid/ask spread is listed at 9 basis points, but that is likely higher near the market open and around other periods of light market liquidity.
The ETF currently trades at an 8-cent premium to its NAV, so that is something to monitor should market stress strike - the premium could invert, hurting an investor's overall return. In 2022, the fund traded at a discount in 86 trading days while selling at a premium in 165 days.
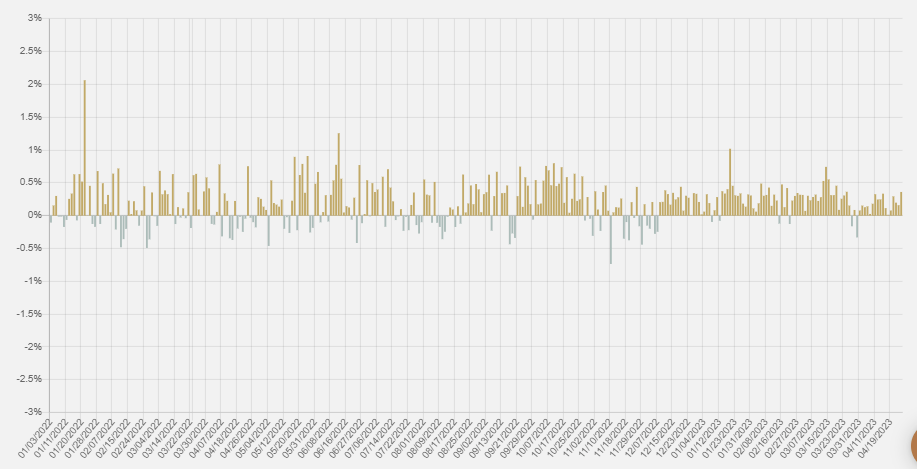
SVOL Premium/Discount To NAV History
SVOL Premium/Discount To NAV History
The Technical Take
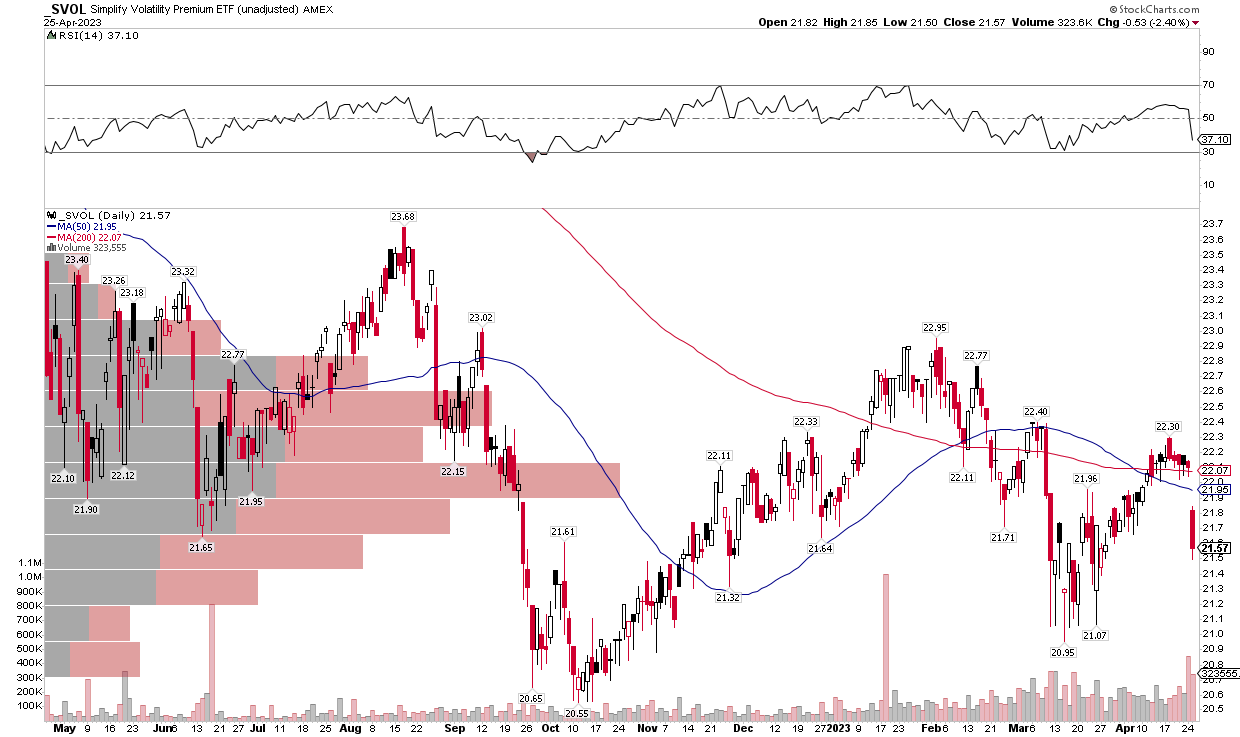
If we scope the SVOL chart, we will find that the trend is clearly lower. A near-term peak was put in around the S&P 500 short-term high on Groundhog Day, and you can see the damage done on Tuesday, April 25 on one of the S&P 500's worst days since mid-March.
With a downward-sloping 200-day moving average, the bears are clearly in control. Lower highs and lower lows over the last year-plus buttress that argument.
SVOL: Trending Lower Technically
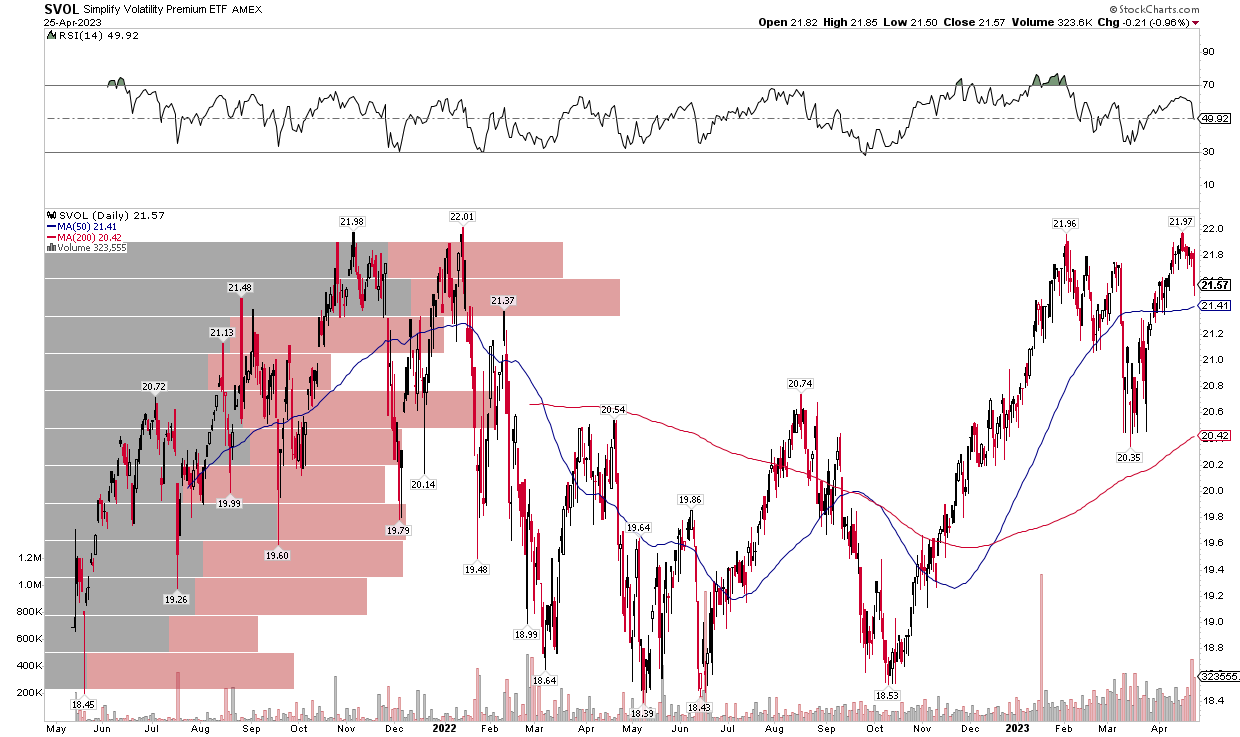
But we should be mindful of the ETF's high yield. If we peak at the total return chart (price plus dividends) we get a different picture on the total holding period return since the inception of SVOL in May 2021.
The strategy has proved profitable over several timeframes - particularly if you bought around spikes in volatility (near market lows). While the total return chart is not useful for plotting technicals and price levels that would be key support and resistance areas, it is a good look for income investors to get a sense of how the fund performs.
SVOL Total Return Chart Since Inception
The Bottom Line
In my view, the VIX is quite low right now, and we are embarking on a tougher stretch of the calendar with a looming D.C. battle. What's more, market valuations are on the pricey side, so I would err on the side of being long volatility, thus I'd avoid SVOL for now.
For further details see:
Watch Your VIX Shorts - Volatility Back On The Table, SVOL At Risk