WAT - Waters Corp.: Now Best Price-Positioned Medical Services Stock
Summary
- Risk~reward tradeoffs and net payoffs offered by this group are better than those of most S&P 500 Index stocks and of most other Market-Maker [MM] forecast securities.
- They also outdo the prospects of many stocks widely-held by Seeking Alpha readers, contributors, and commenters.
- For investment in portfolios where wealth-building is a principal objective, evolving sciences frequently make medical services stocks leading candidates.
Investment Thesis
The rapid advances of technology in natural sciences create frequent opportunities in uneven market pricing among medical supply stocks. That makes regular reviews of these (numerous) issues usually a productive field for near-term capital gain profits.
Among the best potentials at present is Waters Corporation. ( WAT ).
Company description
“Waters Corporation, a specialty measurement company, provides analytical workflow solutions in Asia, the Americas, and Europe.. The company designs, manufactures, sells, and services high and ultra-performance liquid chromatography, as well as mass spectrometry ((MS)) technology systems and support products. Its MS technology instruments are used in drug discovery and development comprising clinical trial testing, the analysis of proteins in disease processes, nutritional safety analysis, and environmental testing. Its products are used by life science, pharmaceutical, biochemical, industrial, nutritional safety, environmental, academic, and governmental customers working in research and development, quality assurance, and other laboratory applications. Waters Corporation was founded in 1958 and is headquartered in Milford, Massachusetts.”
Source: Yahoo Finance
Yahoo Finance
The big picture: Competitors’ Risks vs. Rewards
Figure 1
blockdesk.com (used with permission)
The tradeoffs here are between near-term upside price gains (green horizontal scale) seen worth protecting against by Market-makers with short positions in each of the stocks, and the prior actual price drawdowns experienced during holdings of those stocks (red vertical scale). Both scales are of percent change from zero to 25%.
The intersection of those coordinates by the numbered positions are identified by the stock symbols in the blue field to the right.
The dotted diagonal line marks the points of equal upside price change forecasts derived from Market-Maker [MM] hedging actions, and the actual worst-case price drawdowns from positions that could have been taken following prior MM forecasts like today’s.
Our principal interest is in WAT at location [15]. A “market index” norm of Reward~Risk tradeoffs is offered by SPY at [22]. Other stocks on the reward~risk tradeoff “frontier” are MTD at [7], ILMN at [2] and SYNH at [10].
Those forecasts are implied by the self-protective behaviors of MMs who must usually put firm capital at temporary risk to balance buyer and seller interests in helping big-money portfolio managers make volume adjustments to multi-billion-dollar portfolios. Their protective actions define daily the extent of likely expected price changes for thousands of stocks and ETFs.
This map is a good starting point, but it can only cover some of the investment characteristics that often should influence an investor’s choice of where to put his/her capital to work. The table in Figure 2 covers the above considerations and several others.
Comparing Alternative Investments
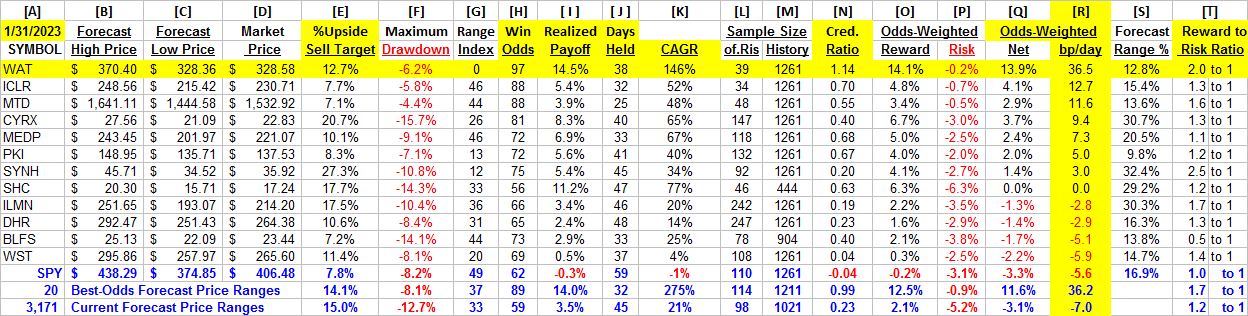
Figure 2
The price-range forecast limits of columns [B] and [C] get defined by MM hedging actions to protect firm capital required to be put at risk of price changes from volume trade orders placed by big-$ “institutional” clients.
[E] measures potential upside risks for MM short positions created to fill such orders, and reward potentials for the buy-side positions so created. The buy-side risks actually encountered from prior forecasts like the present are in [F], as the most severe loss moments encountered during holding periods in effort to reach [E] gains. Those are where buyers are most likely to accept losses.
[H] tells what proportion of the [L] sample of prior like forecasts have earned gains by either having price reach its [B] target, or be above its [D] entry cost at the end of a 3-month max-patience holding period limit. [ I ] gives the net gains-losses of those [L] experiences and [N] suggests how credible [E] may be compared to [ I ].
Further Reward~Risk tradeoffs involve using the [H] odds for gains with the 100 – H loss odds as weights for N-conditioned [E] and for [F], for a combined-return score [Q]. The typical position holding period [J] on [Q] provides a figure of merit [ fom ] ranking measure [R] useful in portfolio position preferencing. Figure 2 is row-ranked on R among candidate securities, with WAT in top rank.
Other alternatives, like market-average index ETF SPY currently has abnormally poor coming price range expectations, making WAT’s Reward to Risk ratios (2.0 to 1 vs. 1.0 to 1 by SPY. That is further evidenced in Compound Annual Growth Rates [K] of 146% for WAT and only -1% for SPY.
The other issues in the Figure 2 table are of medical supply stocks frequently inspected by investors when also looking at WAT. On the same standards of comparison the only one of them approaching the fom [R] of WAT is ICLR with Win Odds of 88 and average realized payoffs only 1/3rds the leader’s size.
Among the 20 best-ranked of all 3,171 of today’s MM price-range forecasts, their higher Win Odds (89 of 100) and shorter holding periods (32 days) boost their average CAGRs to 275%. Here WAT still compares favorably on a fom basis at 36.5 basis points per day with the best 20 at 36.2.
Recent MM price-range forecast trends
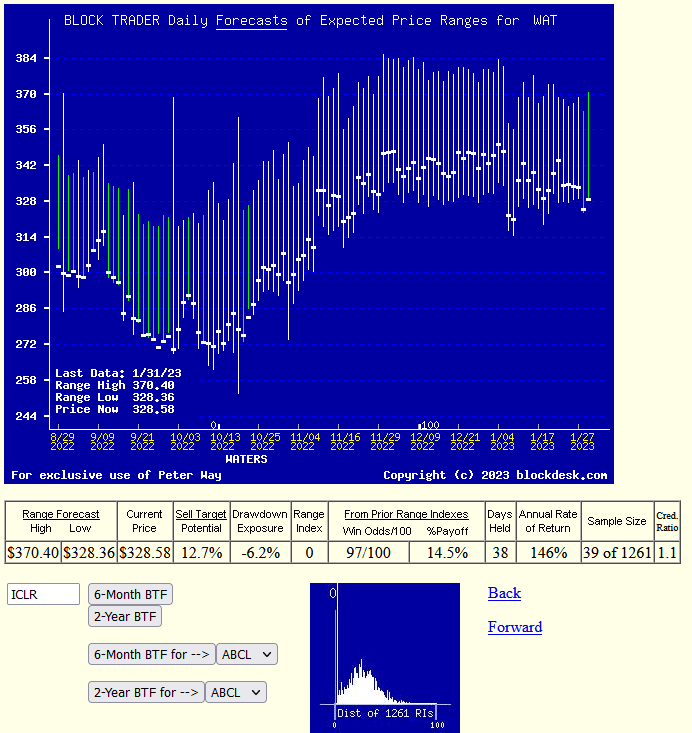
Current pull-backs from early-year high prices provide WAT with improved competitive investment comparisons to alternatives. Figure 3, unlike “technical analysis charts” shows daily forecasts of coming likely price ranges, rather than past actual days prices.
Those forecast price ranges are split into upside and downside prospects by the issue’s closing price of the current-day forecast. The Range Index tells what percentage of that range lies below the current market price.
Figure 3
The “thumbnail” lower picture in Figure 3 shows the distribution of the past 5 years of daily MM forecasts in terms of the market’s then current price quote for WAT relative to its upper and lower limits. The current 0 indicates that all of the full forecast range is to the upside.
The distribution of these Range Indexes [RIs] indicate that higher prices are the norm from prior RI 22 experiences.
Conclusion
Waters Corporation as seen by the market-making community appears to be the currently most attractive Medical Supply Support stock for near-term capital gain among many leading competitors.
For further details see:
Waters Corp.: Now Best Price-Positioned Medical Services Stock