WAT - Waters Corporation: Tactical Buy Seeking Upside Objectives Of $345 $363
Summary
- We are more constructive on Waters Corporation given the trending broad market, improving technicals, and growth forecasts looking ahead.
- Waters Corporation continues to create future value for shareholders.
- We've confirmed future earnings growth and double-digit return on Waters Corporation's investments in this analysis.
- Waters Corporation stock also adds a layer of resiliency to equity portfolios.
- Net-net, we rate Waters Corporation a buy, eyeing price objectives of c.$340 and then $365.
Investment Summary
From the Portfolio Manager's desk
I've added Waters Corporation (NYSE: WAT ) to our equity risk budget with a tactical allocation, as multiple correlating factors now suggest it is a buy. We first considered building WAT into our strategic equity allocation in Feb FY22' as part of a defensive overlay comprised of multiple low-gamma stocks, to clamp equity beta and downside. At the time, the decision was to hold.
We are more constructive on WAT now given the trending broad market, improving technicals, shifting equity premia, and robust fundamentals looking ahead. WAT continues to create future value for shareholders, with sustained earnings growth and double-digit return on its investments. I'm looking to targets of $340–$363, when I'll reassess the position depending on available data. We'll exit the position entirely if the stock pulls back 8% below our entry price.
Investment conclusion
Net-net, we rate WAT a buy, eyeing two price objectives of $340 and then $365. Earnings, market data, fund ownership and fundamentals are each supportive of this valuation. Here, we take a hard-data approach to illustrate WAT's investment value.
Exhibit 1. WAT 12-month price evolution
Data: Updata
WAT incremental value creation down the line
As the cost of capital continues to rise, growth companies with cash flows priced into the future have been punished in FY22.
The shift in discount rate has resulted in a heavy re-rating of equities this year, notwithstanding balance sheet and earnings impacts. Those names creating value above the cost of capital, coupled with earnings growth, are, therefore, attractive in this climate.
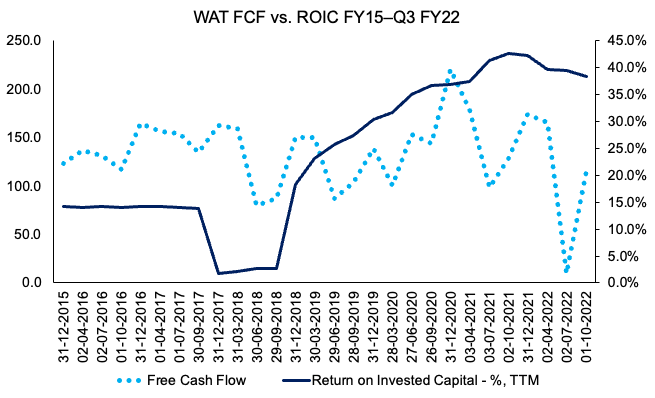
WAT excels in this domain. To illustrate, the company has grown its trailing return on invested capital ("ROIC") off a low base in FY18, to 38.35% in Q3, as seen in Exhibit 2. At the same time, its quarterly free cash flow ("FCF") has pulled back to $116mm, continuing a cyclical downtrend since FY20. Net CFFO remains within longer-term range.
A declining and/or negative FCF is preferred when the ROIC comfortably outpaces the cost of capital. It suggests strong return on a company's investments. As seen, as FCF is reinvested into the capital budgeting cycle, ROIC has continued to drift higher for WAT to date, checking this box.
In terms of future value creation, this is a large plus in the investment debate.
Exhibit 2. As FCF is reinvested into the capital budgeting cycle
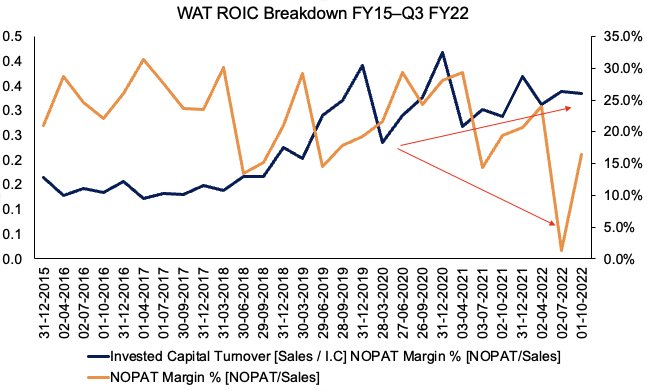
To understand where the growth in WAT's ROIC stems from, we can break it down into its sub-components, NOPAT Margin and Invested capital turnover:
NOPAT Margin = NOPAT/SALES
Invested capital turnover =SALES/INVESTED CAPITAL
The progression of each input is plotted in Exhibit 3 from the period of FY15–date:
- Clearly, it can be seen the divergence in NOPAT margin to invested capital turnover.
- Contrast this to previous times in FY15–18' where the opposite was true.
- This suggests the large uptick from FY20 in ROIC [especially relative to free cash flow] stemmed from management being more active in the capital budgeting cycle, versus greater NOPAT margin.
- Looking ahead, I'd be constantly monitoring this relationship, as it will serve as a good proxy to measure management's impact.
Exhibit 3. Recent upside in ROIC driven by increased turnover of invested capital versus greater NOPAT margin
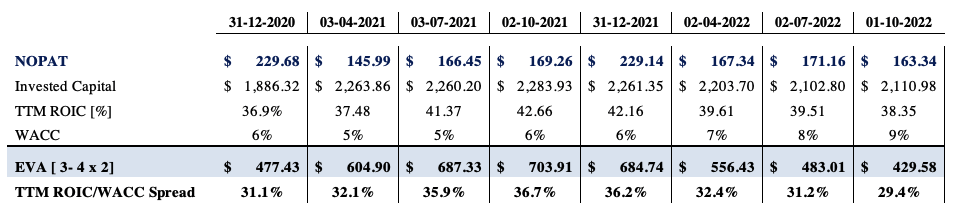
Another way we checked WAT management's impact over time is by calculating the economic value added ("EVA") to date.
As seen in Exhibit 4, WAT continues to build quarterly EVA, although growth has slowed. Nonetheless, the ROIC/WACC spread is still nearly 30 percentage points as of the last quarter, thereby comfortably outpacing the WACC hurdle.
Subsequently, the company has a strong maximum sustainable growth rate at its TTM ROIC of ~38%.
Exhibit 4. EVA from Q4 FY20–date indicates consistent economic profit above cost of capital. Maximum sustainable growth rate = 38%.
Note: The level of ROIC is the maximum supported growth rate of a business, assuming no external financing: [Growth = ROIC x (1 – payout ratio)]. For more see: Mauboussin & Callahan (2022): Return on Invested Capital How to Calculate ROIC and Handle Common Issues, Morgan Stanley Investment Management]. (Data: HB Insights, WAT SEC Filing)
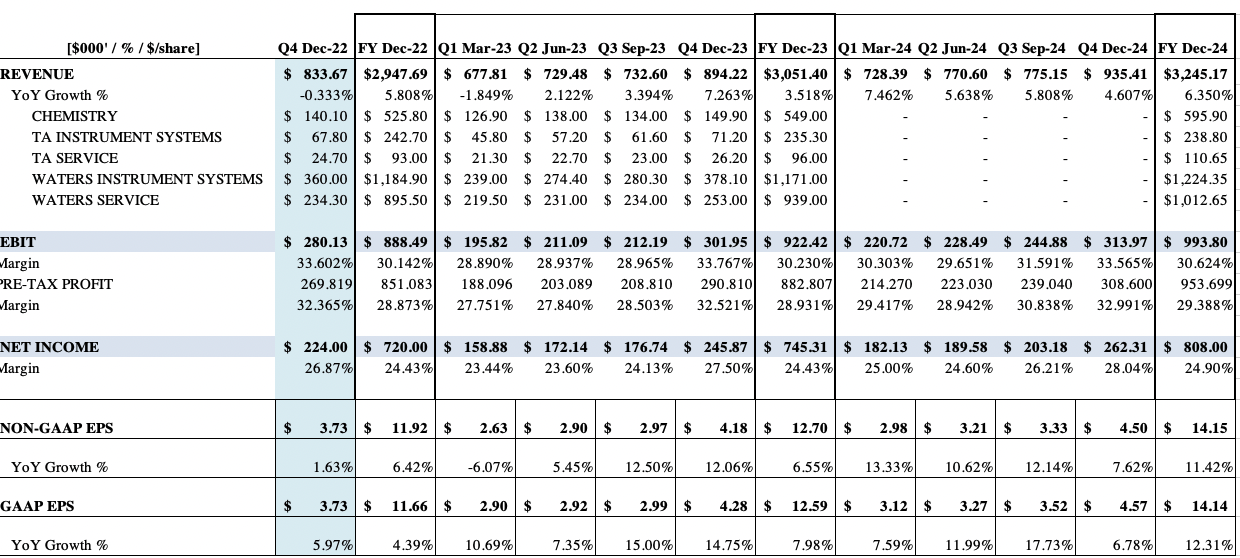
Speaking of growth, we've projected WAT to grow FY22 GAAP EPS by 4.4% YoY to $11.66. We see this stretching up to double-digit quarterly EPS growth into FY23.
Management raised FY22 guidance on the Q3 earnings call and now see 11–12% growth at the top-line in constant currency terms. Adjusting for FX headwinds, it envisions a 6% YoY decline in turnover. It did revise non-GAAP EPS down to $11.85–$11.95 from $12.05 at the upper end.
These aren't exciting growth numbers at the bottom line. However, in view of earlier findings, sustained EPS growth appears likely for WAT, despite the economic turbulence looming ahead. The same can't be said for many peers within the space. Therefore, WAT adds a layer of resiliency to equity portfolios as well.
Exhibit 5. WAT Forward estimates [quarterly, annual] FY22–FY24
Market data supportive of capital appreciation
Registered investment funds [ex-ETFs] drastically increased net exposure to WAT from September to October, as seen in Exhibit 4.
Whereas net turnover had been flat from July–September, the large uptick in exposure indicates to me heavy accumulation from institutional buyers. This is incredibly important in our eyes and helps validate the latest rally as evidence of the correct buying support.
Exhibit 6. Fund manager net exposure substantially increased from September–October.
Data: Refinitiv Eikon
Chart studies also suggest longevity of the latest WAT rally from October. As noted in Exhibit 5 [showing weekly bars], WAT has remained within a 62-week long consolidation from September FY21.
Each attempted recovery/rally has failed as we've walked throughout the year. Looking at each prior recovery attempt, volume had been poor leading into the move. The overall downtrend has been dominant in price action and volume from September–date.
In the June bounce in equities, WAT saw some upside, however, as noted, the overall volume trend was contracting. As WAT continued backing and filling, the sideways action with declining volume is evidence of heavy resistance in my opinion. Moreover, the base was wide and loose heading into the pivot, and was therefore a poor setup in my understanding.
Turning to the latest rally in October, my conclusion is different. The base is far tighter, and shares have broken out and closed above the 50DMA 4 weeks in a row, coupled with a volume reversal and breakout.
Shares now push towards the 250DMA. The last 4 weeks of ascending volume, coupled with the bullish trend is further evidence of accumulation from institutional buyers in my estimate.
Further, the stock has broken out above its relative strength trend and is accelerating faster than the SPX benchmark. These factors lead me to believe there's support for WAT's latest rally to extend beyond previous highs.
Exhibit 7. Ascending volume, with reversal and breakout, coupled with shares above 50DMA corroborates institutional buying.
Data: Updata
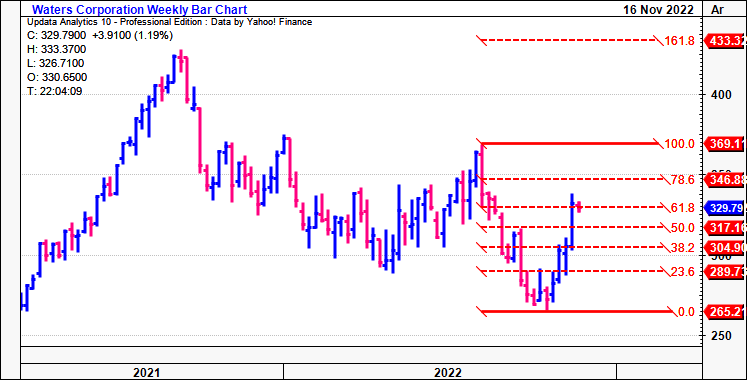
Presuming WAT did bottom in October, the next technical price targets are to $346 and then $369. Both objectives are supported by fundamentally-derived valuations.
As seen in Exhibit 6, tracing the fibs' down from the August high shows WAT shows high confluence to each level in the retracement. It closed at exactly 61.8% of the channel last week.
I'm looking for further past $329, additional volume/accumulation and a trending broad market to confirm these levels.
It has already taken out our previous technical target of $324 [shown in the point and figure chart, Exhibit 7], adding weight to these upside targets. This is a $54 per share/20.4% gain from lows of ~$269 in September.
Exhibit 8.
Exhibit 9. Taken out previous target of $324, now testing resistance line shown
Data: Updata
Valuation
The consensus FY22 S&P 500 forward P/E is 18.8x. Consensus has WAT valued at 27.9x forward GAAP earnings and 27.3x forward non-GAAP EPS. It therefore expects WAT to outperform the benchmark looking ahead.
With a fair cost of equity of 3.49%, investors are compensated with a 2.28% risk premium on WAT's TTM earnings. We therefore feel WAT should trade a little higher at ~28.6x forward earnings, as seen below.
At this multiple to our FY22 and FY23 EPS estimates, sets price targets of $341 and $363, respectively. These are in-line with technically derived targets above, giving greater confidence on the estimations.
Exhibit 10. Fair forward P/E of 28.6x FY22 estimates = $343
Note: Fair forward price-earnings multiple calculated as 1/fair cost of equity. This is known as the 'steady state' P/E. For more and literature see: [M. Mauboussin, D. Callahan, (2014): What Does a Price-Earnings Multiple Mean?; An Analytical Bridge between P/Es and Solid Economics, Credit Suisse Global Financial Strategies, January 29 2014]. (Data: HB Insights Estimates)
Exhibit 11. Fair forward P/E of 28.6x FY23 estimates = $363
Note: As above. (Data & Image: HB Insights Estimates)
In short
Net-net, we rate Waters Corporation a buy, eyeing price objectives of ~$340 and then ~$365. Earnings, market data, fund ownership and valuations are each supportive of further upside for the stock.
For further details see:
Waters Corporation: Tactical Buy Seeking Upside Objectives Of $345, $363