PID - WDIV: Inflation Currencies Have Hurt This Global Dividend Aristocrat ETF
2023-03-10 14:41:02 ET
Summary
- SPDR S&P Global Dividend ETF invests in global dividend aristocrats.
- About 41% is in the U.S. and Canada, and 42% is in financials and real estate.
- The fund has outperformed close competitors.
- Share price and distributions have failed to keep up with inflation.
- Currency risks have played against the fund.
This dividend ETF (exchange-traded fund) article series aims at evaluating products regarding the relative past performance of their strategies and quality metrics of their current portfolios. As holdings and their weights change over time, I may update reviews when necessary .
WDIV strategy and portfolio
SPDR S&P Global Dividend ETF (WDIV) has been tracking the S&P Global Dividend Aristocrats Index since 5/29/2013. It has 99 holdings, a distribution yield of 5.06%, and a total expense ratio of 0.40%. Distributions are paid quarterly.
As described by S&P Dow Jones Indices, eligible companies must have:
- A float-adjusted market capitalization of at least $ 1 billion.
- An average daily volume of at least $ 5 million.
- A Positive EPS.
- Increased dividends or maintained stable dividends every year in the last 10 years.
- An IAD yield inferior or equal to 10%.
- New components must have a payout ratio below 100%.
The 100 stocks passing these rules with the highest IAD yield are included in the index at every annual reconstitution, with a maximum of 20 stocks in each country and 35 stocks in each GICS sector. They are weighted based on IAD yield with a maximum of 3% for each constituent and 25% in each country and each sector. The index has a semi-annual review of weight limits and a monthly review of constituent eligibility. Excluded stocks are not replaced until the next reconstitution.
Hereafter, I will compare WDIV with two close competitors: First Trust Dow Jones Global Select Dividend Index ETF ( FGD ) and Invesco International Dividend Achievers ETF ( PID ) regarding portfolio structure, valuation, and performance.
I consider them close competitors because they share four structuring characteristics:
- portfolio of international dividend paying companies,
- no U.S. exclusion,
- criteria of dividend growth (or at least stability),
- no hedge against currency risks.
FGD was reviewed here , and PID here . The three funds pay quarterly distributions. The next table compares yields, fees, assets ("AUM") and average daily volumes.
| WDIV |
| FGD |
| PID |
| Yield |
| 5.06% |
| 5.60% |
| 3.19% |
| Expense ratio |
| 0.40% |
| 0.56% |
| 0.53% |
| AUM |
| $237.28M |
| $672.83M |
| $995.18M |
| Average volume |
| 23.43K |
| 229.44K |
| 344.45K |
WDIV is less liquid: it is not an issue for long-term investors, but it is inadequate for swing trading or tactical allocation.
WDIV and FGD are mostly invested in large and mid-cap companies, and they have similar size profiles. PID portfolio is disproportionately invested in mega-caps.
Holdings by size (chart: author; data: Fidelity.)
The U.S. and Canada are the heaviest countries in WDIV, with a bit more of 20% of asset value in each of them. Japan is ranked third with 15%. Other countries are below 10%. South Korea, the heaviest country in FGD (about 14%), is ignored. China is part of WDIV and ignored by FGD and PID. PID has a very peculiar allocation: over half of asset value is in Canadian companies.
In WDIV, China and Hong Kong weigh 15.5% together. This direct exposure to geopolitical and regulatory risks related to China must be taken into account by investors.
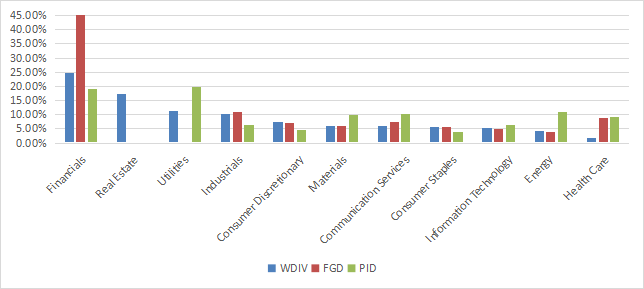
Geographical allocation (chart: author; data: SSGA, Fidelity.)
The heaviest sectors in WDIV are financials (24.8%) and real estate (17.5%). Industrials and utilities are in a 10-12% range, and others sectors are below 8%. WDIV is better diversified across sectors than FGD, which is massively overweight in financials (about 45%). Meanwhile, the top sector of PID is utilities (close to 20%). WDIV is the only one of these three funds with significant exposure in real estate.
The top 10 holdings, listed below, represent 13.8% of asset value.
| Name |
| Ticker |
| Weight% |
| Sector |
| Currency |
| New World Development Co. Ltd. |
| 17-HK |
| 1.63 |
| Real Estate |
| HKD |
| STATE STREET INSTITUTIONAL LIQ STATE STR |
| 964WKM90 |
| 1.62 |
| Fund |
| USD |
| Adecco Group AG |
| ADEN-CH |
| 1.52 |
| Industrials |
| CHF |
| Legal & General Group Plc |
| LGEN-GB |
| 1.39 |
| Financials |
| GBP |
| A2A S.p.A. |
| A2A-IT |
| 1.35 |
| Utilities |
| EUR |
| Lenovo Group Limited |
| 992-HK |
| 1.30 |
| Technology |
| HKD |
| Bouygues SA |
| EN-FR |
| 1.27 |
| Industrials |
| EUR |
| Janus Henderson Group PLC |
| JHG |
| 1.24 |
| Financials |
| USD |
| Longfor Group Holdings Ltd. |
| 960-HK |
| 1.22 |
| Real Estate |
| HKD |
| BASF SE |
| BAS-DE |
| 1.22 |
| Materials |
| EUR |
WDIV looks more expensive than FGD regarding the usual valuation metrics (see next table). However, it is likely an illusion due to sector bias: financials are much heavier in FGD. This sector has, on average, materially lower and less reliable ratios.
PID is more expensive, but in this case, metrics may be skewed by overweight in Canada and in mega-cap multinational companies. In summary about valuation, beware of the numbers, especially in international funds.
| WDIV |
| FGD |
| PID |
| Price / Earnings TTM |
| 11.13 |
| 7.19 |
| 17.07 |
| Price / Book |
| 1.04 |
| 0.87 |
| 1.76 |
| Price / Sales |
| 0.8 |
| 0.69 |
| 1.88 |
| Price / Cash Flow |
| 8.53 |
| 4.93 |
| 8.19 |
Performance
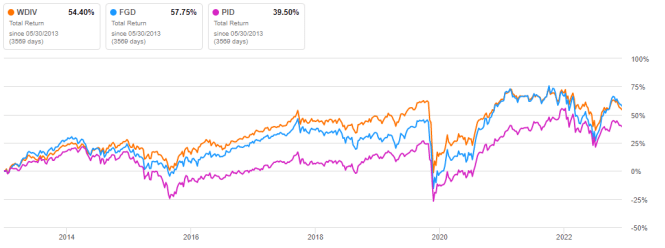
The next chart compares total returns since June 2013.
Then, the next one excludes dividends (capital return only).
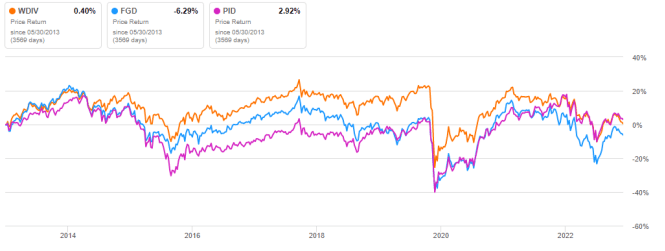
In total return, WDIV is almost on par with FGD and outperforms PID. In price return, it is the other way: almost tie to PID, and outperforming FGD. Taking both results into account, WDIV is the best performer.
However, the share price is close to break-even from May 2013 to date, whereas cumulative inflation has been about 28% (based on CPI). For shareholders, it means a significant decay of capital in inflation-adjusted value.
The next table is about dividend "growth"…or in this case, decrease.
| Annual div. /share |
| WDIV |
| FGD |
| PID |
| 2014 |
| 3.07 |
| 1.31 |
| 0.69 |
| 2022 |
| 3.00 |
| 1.26 |
| 0.55 |
| Variation |
| -2.28% |
| -3.82% |
| -20.29% |
WDIV and FGD have been better than PID at preserving distributions. Once again, these numbers must be considered in the context of a 25%+ cumulative inflation, so both capital and income stream have shrunk after inflation adjustment. A part of the decay is due to local currencies. As the geographical allocation has changed over time, it would be very complicated to calculate the impact of forex rates variations. As a first evaluation, the dollar index has gained about 23% between 2013 and 2022. It doesn't change the picture for U.S. shareholders, but it makes it better for non-dollar based investors. Currency risk may play in favor or against the fund in the future. I don't make any prediction.
Takeaway
SPDR S&P Global Dividend ETF tracks an index of 100 international dividend aristocrats with high yields. About 41% of asset value is in companies listed in the U.S. and Canada. About 42% is in two sectors: financials and real estate. The fund has a 15% direct exposure to China.
SPDR S&P Global Dividend ETF has outperformed its competitors FGD and PID since inception. However, both share price and distributions have failed to keep up with inflation. Currency risks add some unknown parameters for the future. We can only note that they have played against the fund since 2013.
For further details see:
WDIV: Inflation, Currencies Have Hurt This Global Dividend Aristocrat ETF