WEAT - WEAT: A Critical Sentiment Barometer Is Very Bullish
2023-05-25 13:30:00 ET
Summary
- The KCBT-CBOT wheat spread signals potential supply and price concerns, which could lift CBOT wheat prices from their current levels.
- The USDA's latest report forecasts smaller U.S. and global wheat inventories, with the worldwide stocks-to-use ratio at its lowest since 2014/2015.
- Teucrium Wheat ETF offers exposure to CBOT wheat futures for those seeking a less leveraged and margined investment option.
Wheat is the agricultural product that feeds the world. Bread is a staple, and wheat is its primary ingredient. The CME's CBOT soft red winter wheat futures contract is the global benchmark for wheat prices, as it attracts the most liquidity. CBOT wheat futures have the highest number of open long and short positions and volume. Open interest and volume are the metrics that establish liquidity.
The KCBT hard red winter wheat futures and MGE spring wheat futures also trade on the CME. In a July 3, 2018, Seeking Alpha article , I explained the relationship between the KCBT and CBOT contracts:
The CBOT wheat futures contract is a benchmark for the price of the grain that is the ingredient in flour that produces bread, a ubiquitous staple food around the world. The KCBT wheat futures contract is often the benchmark pricing mechanism for bread manufacturers in the United States. Therefore, the KCBT versus CBOT wheat spread can tell us a lot about the U.S. versus the global market for the grain.
Almost five years ago, on July 29, 2018, the KCBT wheat futures were at a 12.75 discount to CBOT wheat when I wrote:
The KCBT versus CBOT wheat spread is a location and quality spread that can offer clues about the path of least resistance for the primary ingredient in the production of flour and bread.
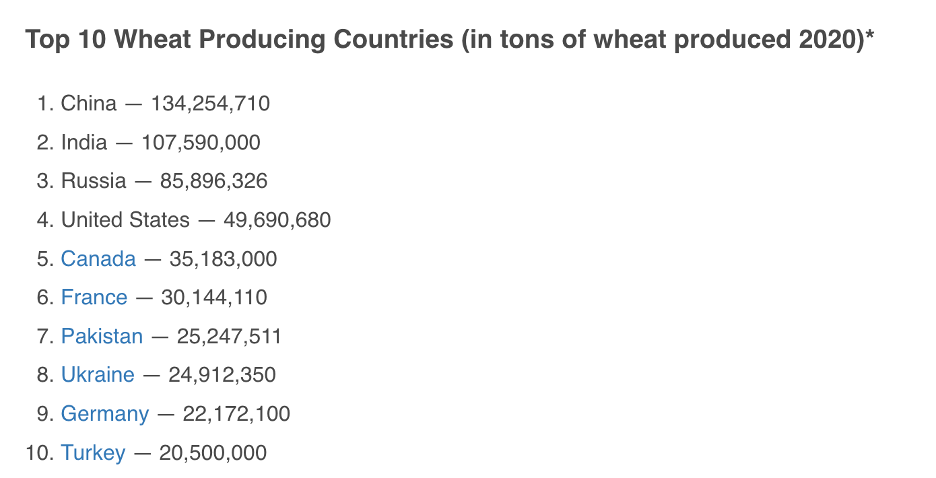
In 2020, the world's leading wheat-producing countries were:
As the chart shows, Russia and Ukraine produced over 110 million tons of wheat together, making them second only to China in world output. The war in Ukraine, Europe's breadbasket, caused CBOT wheat prices to rise to a record high in 2022 before correcting. Even though the price of the leading benchmark wheat futures market declined, the KCBT-CBOT spread signals that supply and price concerns remain a clear and present danger and could lift CBOT wheat prices from the current level. The Teucrium Wheat ETF ( WEAT ) tracks a portfolio of CBOT soft red winter wheat futures prices.
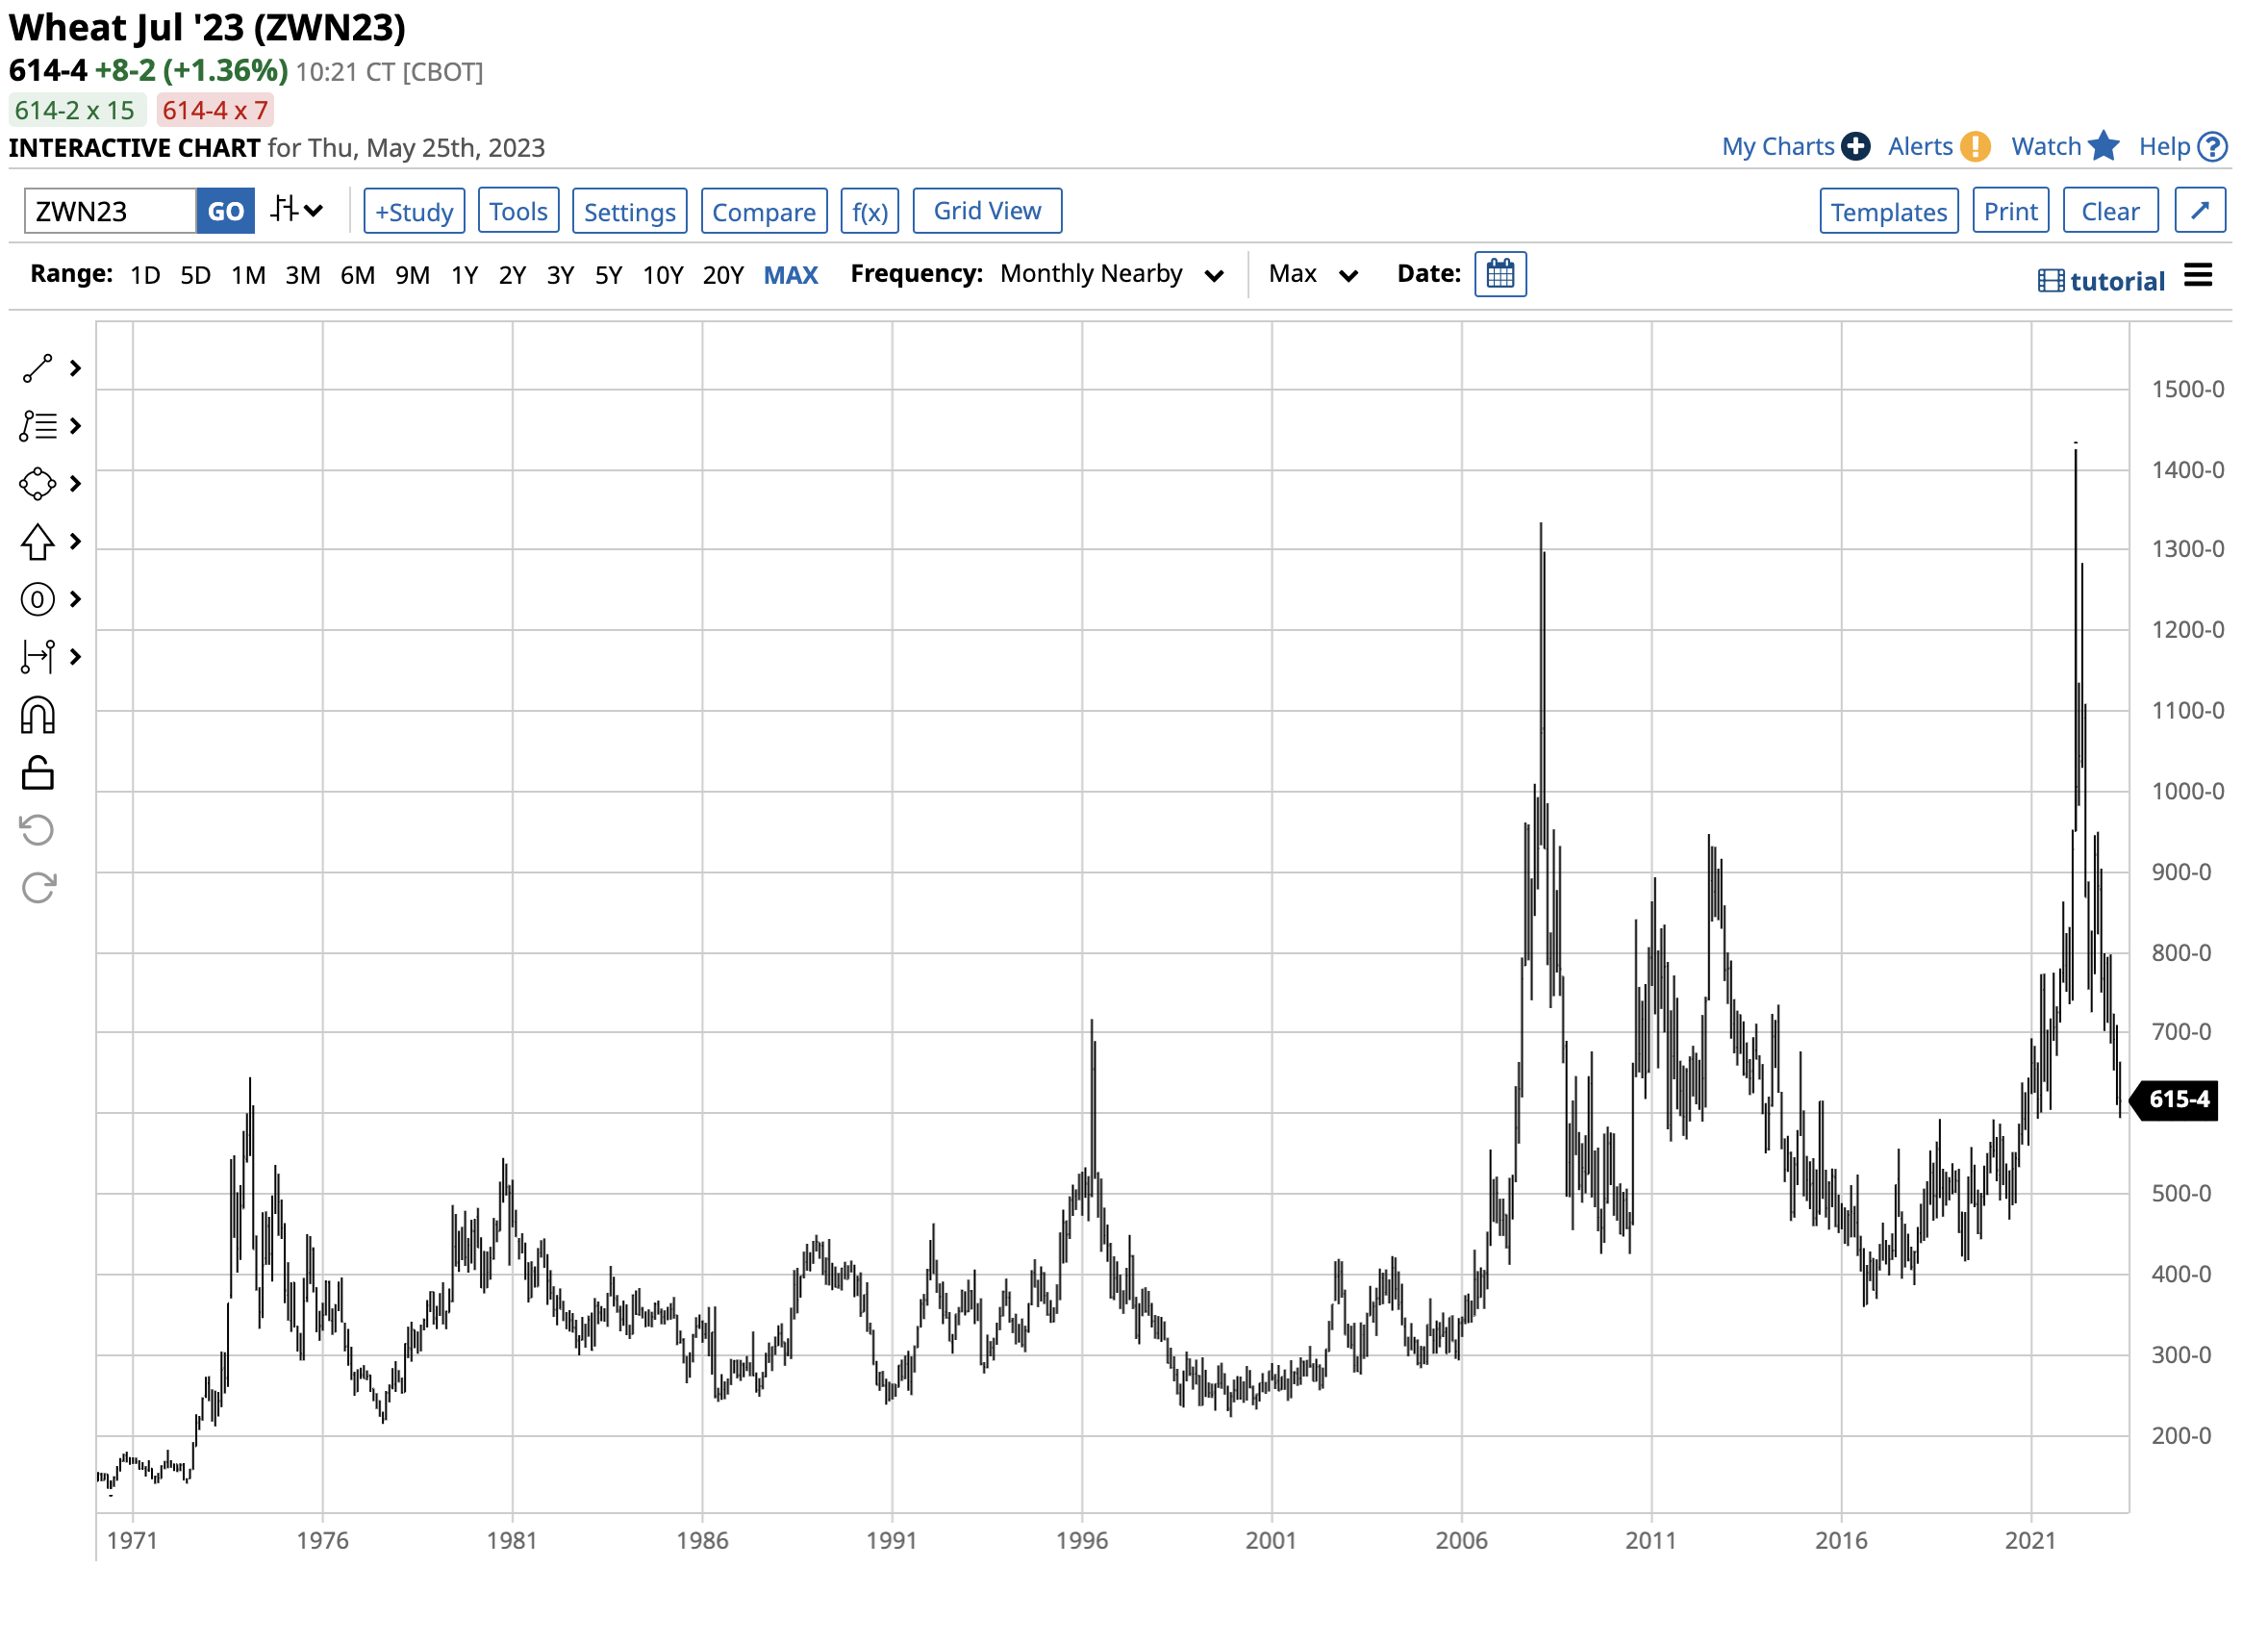
CBOT wheat prices have declined
After reaching a record $14.2525 per bushel all-time high in March 2022, CBOT soft red winter wheat futures turned lower.
Long-Term Chart of the CBOT Soft Red Winter Wheat Futures Contract (Barchart)
The chart dating back to 1970 highlights the rise in the most liquid wheat futures contract when Russia invaded Ukraine, causing supply and price fears to push the price to an all-time peak. Since then, CBOT wheat futures have made lower highs and lower lows, with the most recent coming in May 2023 at $5.9425 per bushel, 58.3% below the 2022 high.
KCBT wheat is less liquid than CBOT wheat futures
Open interest, or the total number of open long and short positions in a futures market, and daily volume are the metrics that determine liquidity. The most liquid markets attract the greatest number of traders, investors, hedgers, speculators, arbitrageurs, and other market participants. Highly liquid markets tend to be less volatile because of participation at each price level. Low liquidity often creates an environment where bids to buy disappear when prices decline, and offers to sell evaporate during rallies.
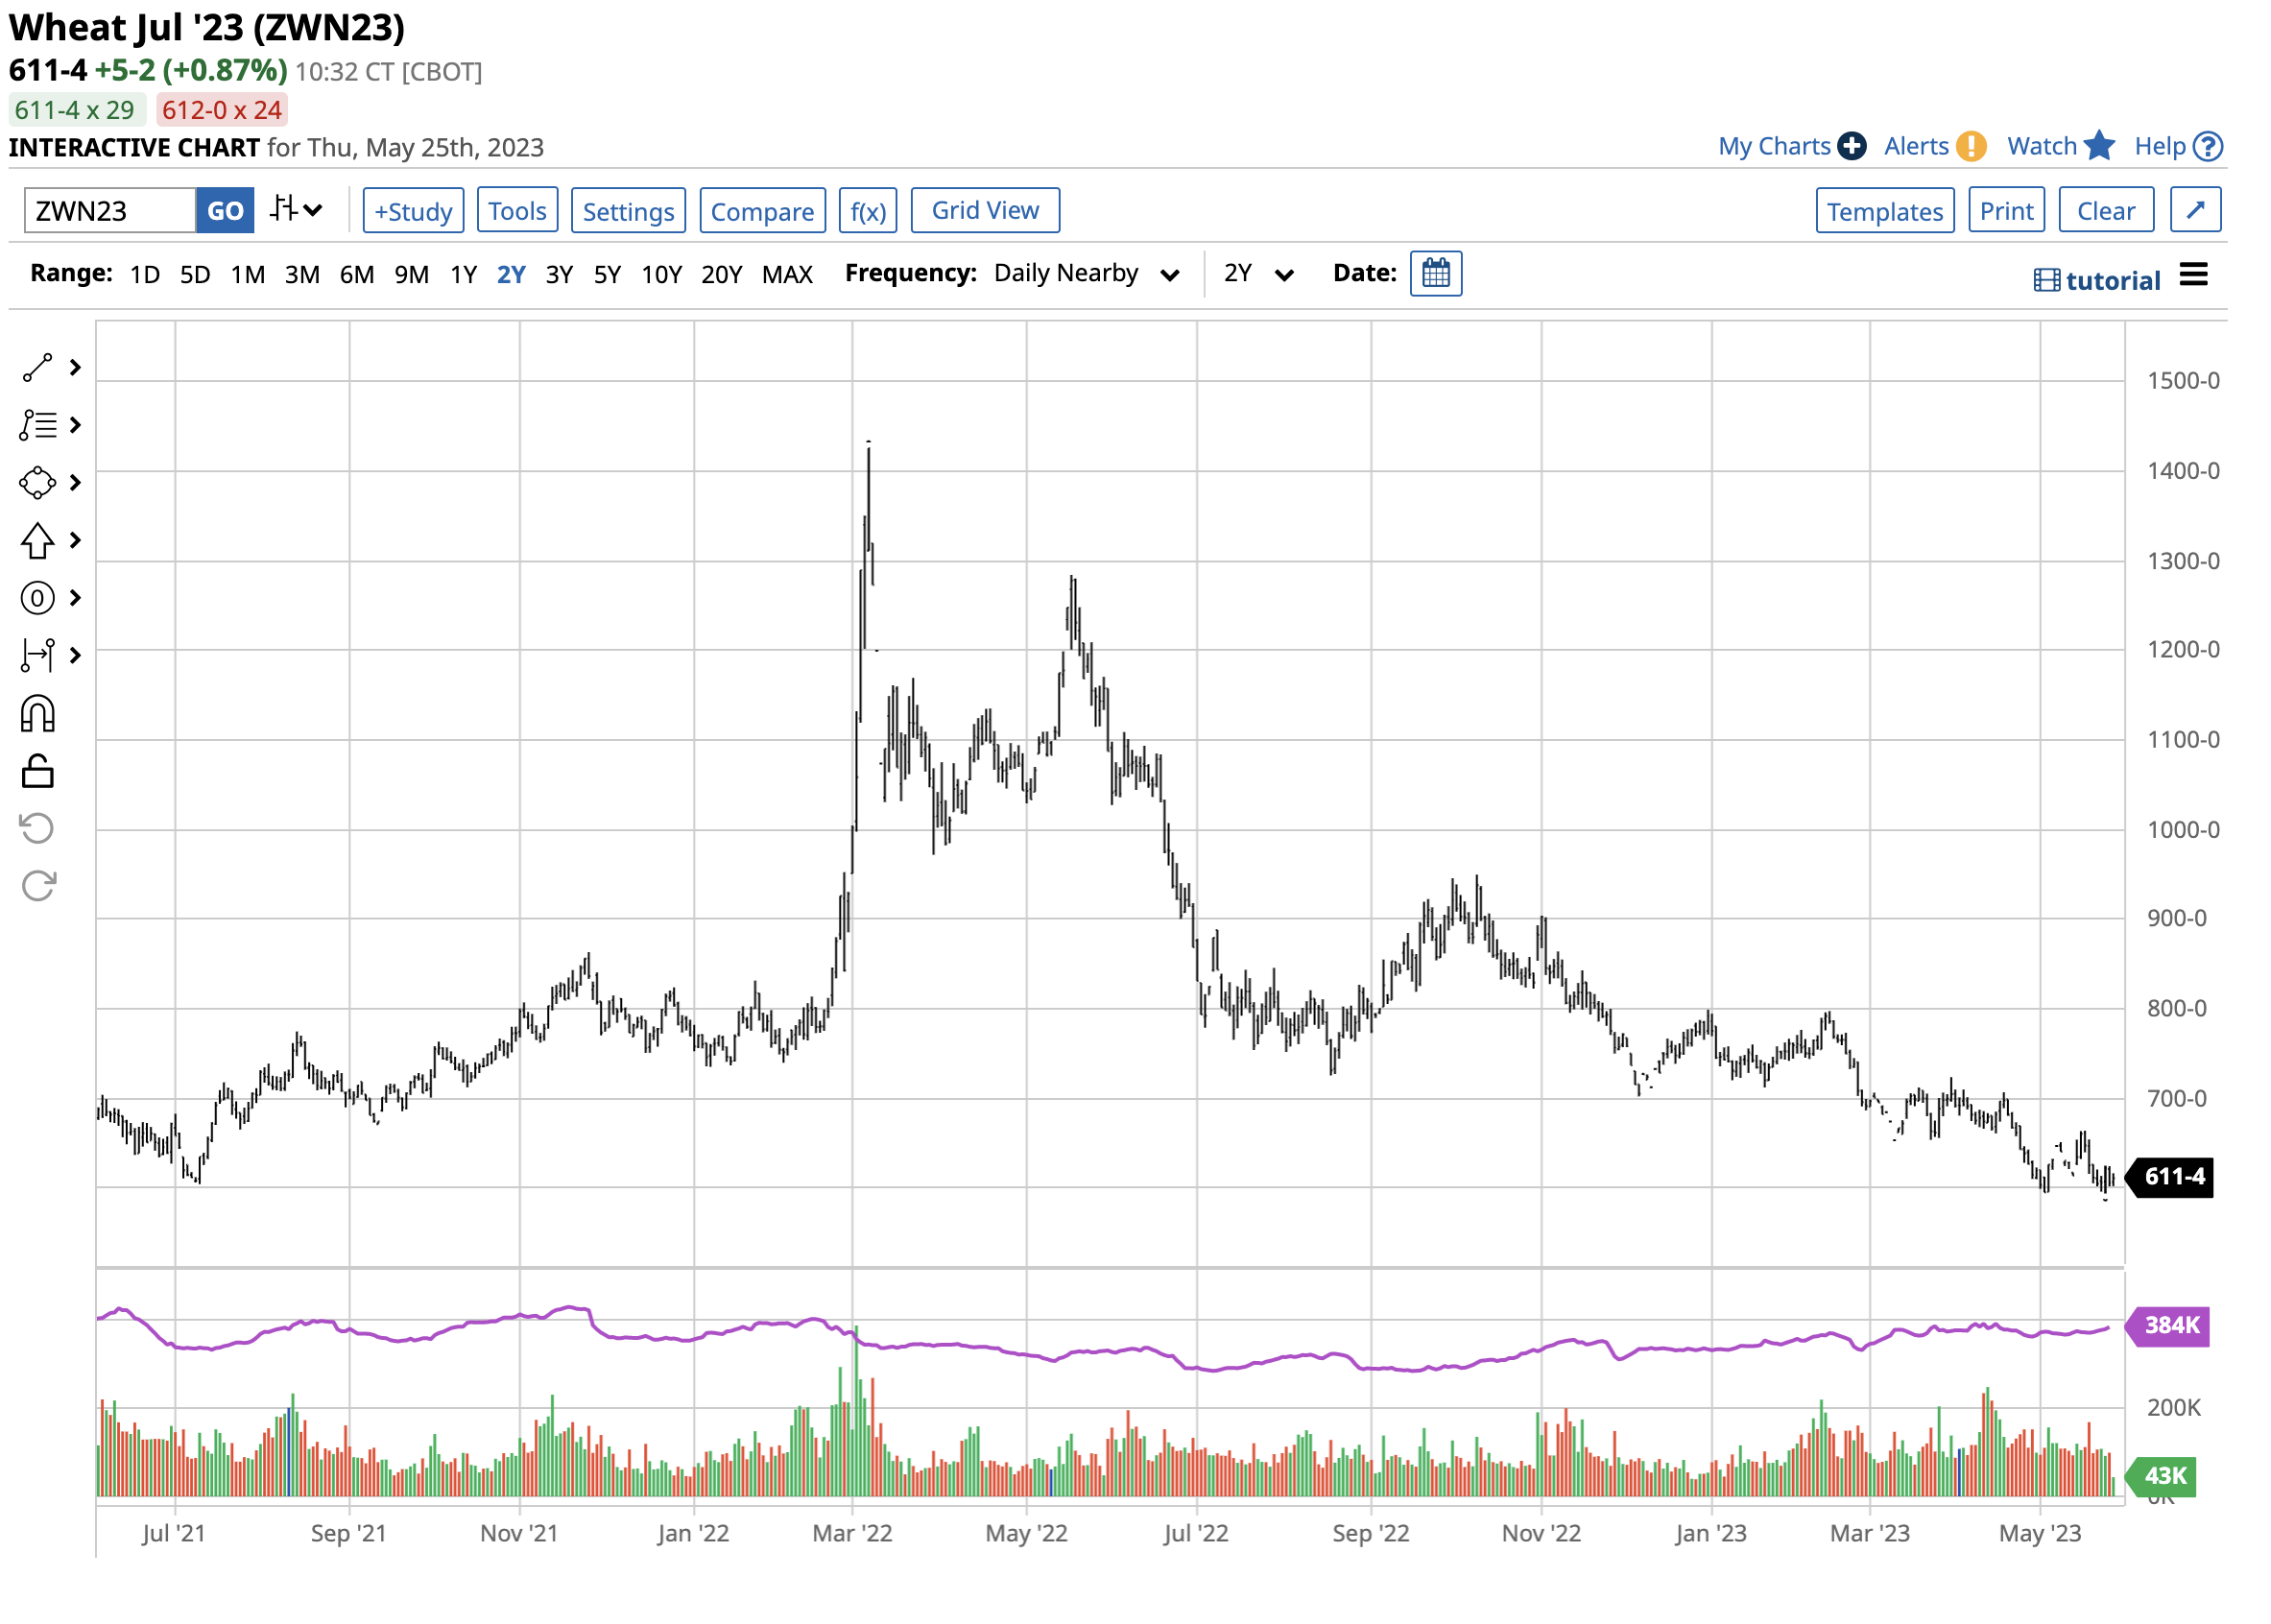
CBOT soft red winter wheat futures are highly liquid.
The two-year chart shows CBOT wheat futures traded an average daily volume of around 100,000 contracts, with open interest at over the 384,000-contract level.
KCBT hard red winter wheat futures are less liquid.
The two-year chart shows KCBT wheat futures traded an average daily volume of under 50,000 contracts, with open interest at the 185,000-contract level.
The KCBT-CBOT spread exploded higher
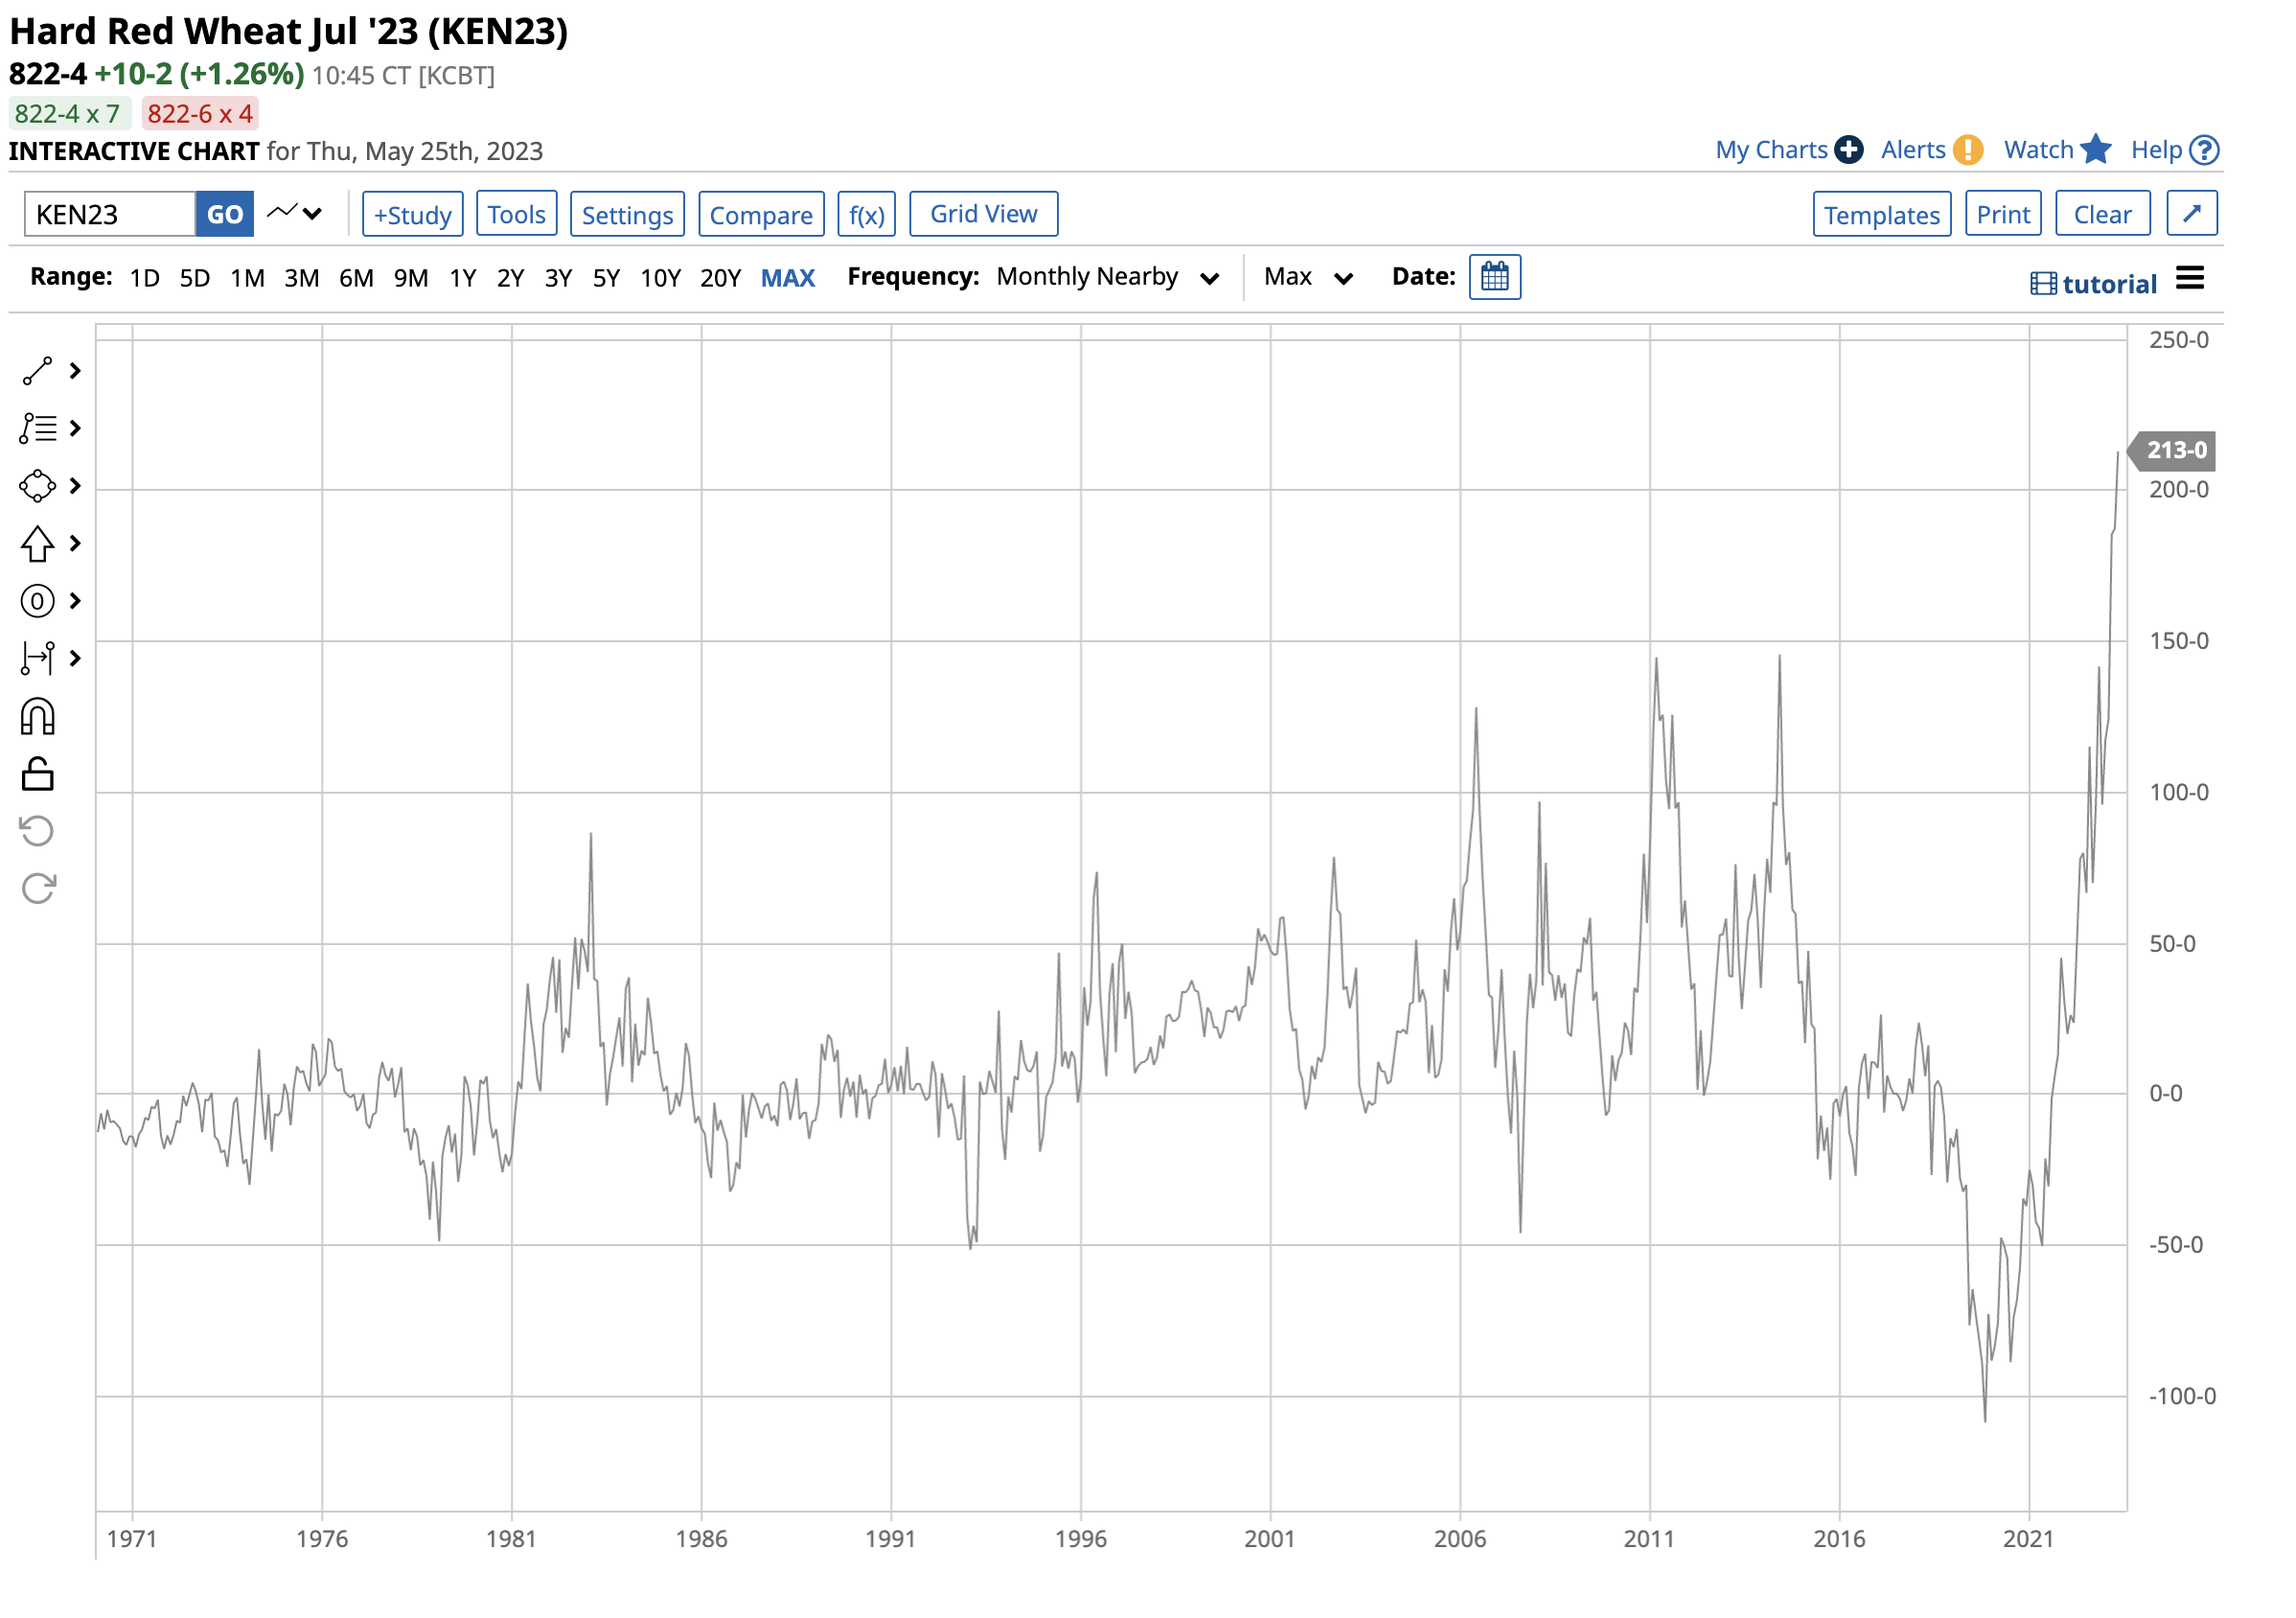
The long-term average for KCBT hard red winter wheat's premium over CBOT soft red winter wheat dating back to 1970 is 20-30 cents per pound.
Long-Term Chart of the CBOT Soft Red Winter Wheat Futures versus the KCBT Hard Red Winter Wheat Futures Contracts (Barchart)
The chart shows the spread for the continuation contract exploded to a $2.13 premium for KCBT wheat in May 2023.
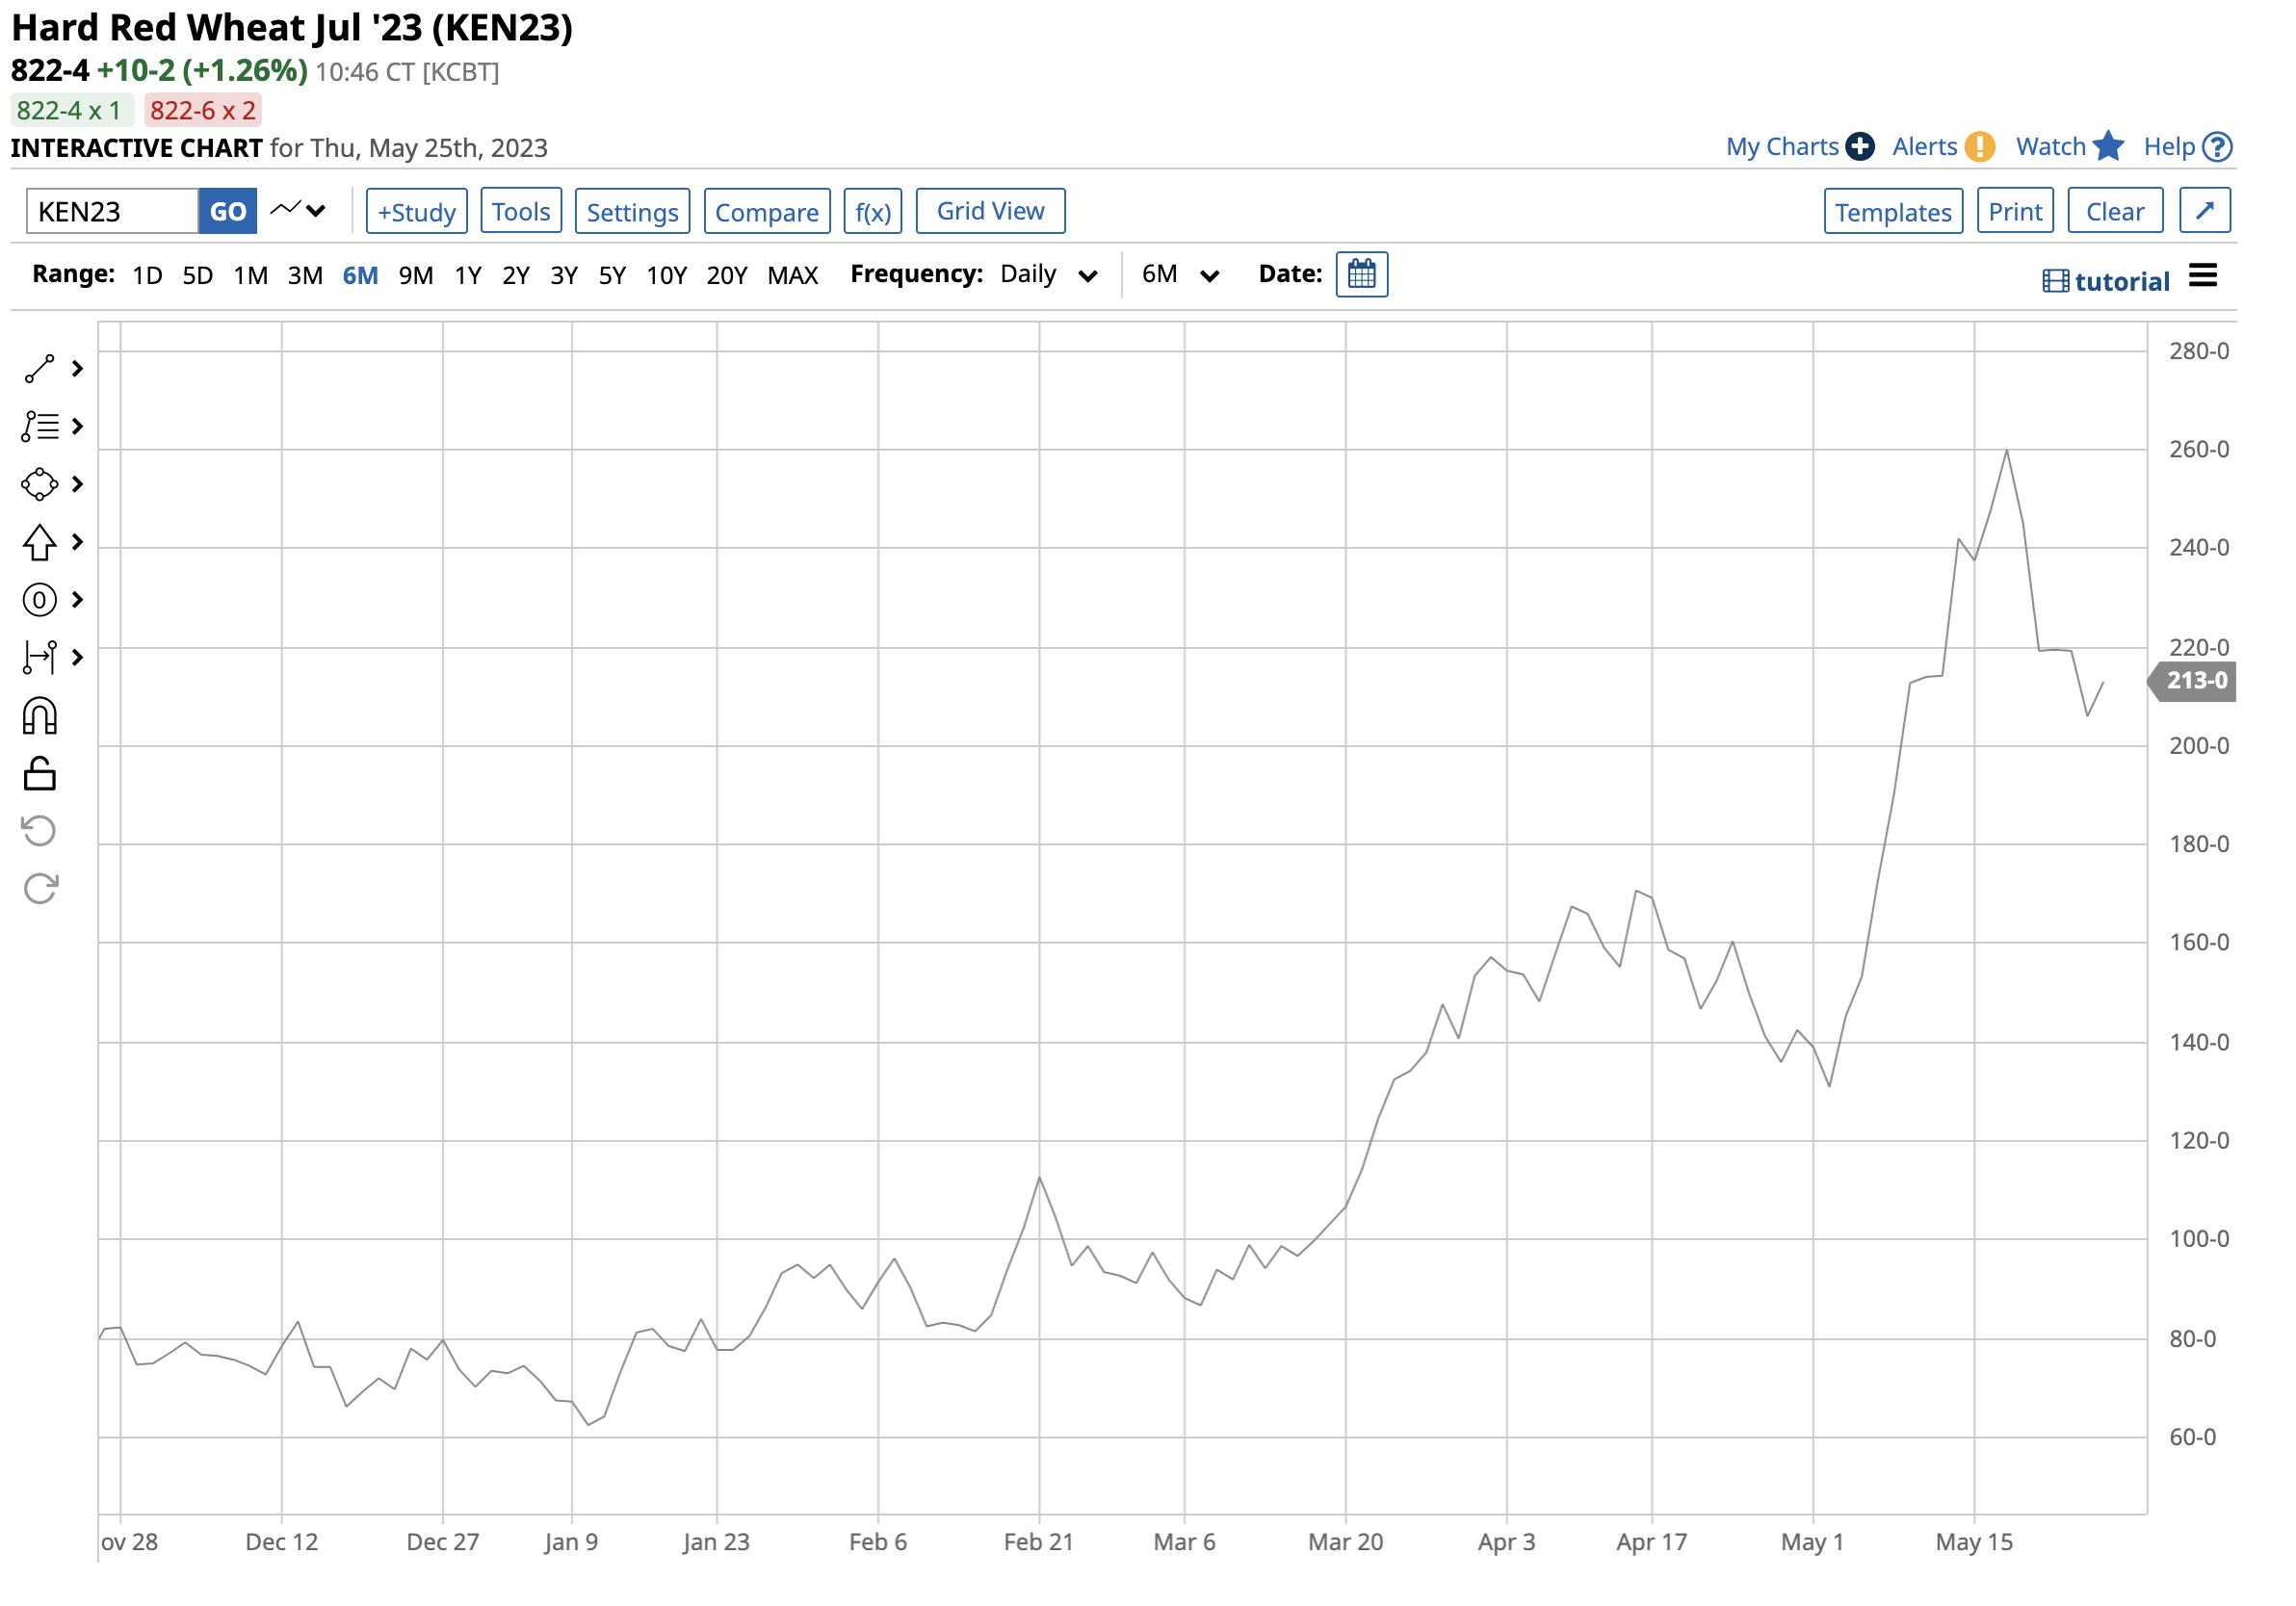
Short-Term Chart of the July CBOT Soft Red Winter Wheat Futures versus the July KCBT Hard Red Winter Wheat Futures Contracts (Barchart)
The short-term chart shows the differential between the KCBT and CBOT wheat prices for July delivery reached a record $2.60 per bushel high premium for KCBT wheat on May 17, 2023.
On May 25, 2023, the spread stood at the following levels for the coming delivery months:
- July 2023- $2.13 premium for KCBT wheat.
- September 2023- $1.94 premium for KCBT wheat.
- December 2023- $1.6950 premium for KCBT wheat.
The spread remains far higher than the long-term 20-30 cents premium for the KCBT wheat average.
The KCBT-CBOT spread could be a buying signal for CBOT wheat futures at the current price level
Since many U.S. bread manufacturers price their wheat requirements with a formula tied to the KCBT wheat futures price, the spread between the hard and soft winter wheat futures is a significant barometer of consumer hedging behavior. When consumers have few price and supply concerns, the spread tends to move to a premium for the more liquid CBOT wheat. However, when consumers panic, the spread can explode to a premium for KCBT wheat.
The spread over the $1.50 level out to the end of the year indicates that consumers remain highly fearful about wheat prices and supplies, translating to increased hedging activity. Russia and Ukraine are leading world wheat producers and exporters, and the ongoing war pressures other producing countries to increase output and replace the lost bushels from Europe's breadbasket. While CBOT wheat futures corrected by over 58% from the 2022 high, the action in the spread is a sign that wheat could find a bottom near the $6 per bushel level, and the current price could be a buying opportunity.
Meanwhile, the USDA's latest May World Agricultural Supply and Demand Estimates Report was bullish for wheat, forecasting smaller U.S. and global inventories, with the worldwide stocks-to-use ratio at the lowest level since 2014/2015. The stocks-to-use ratio measures the supply and demand interrelationship in the wheat and other commodity markets, indicating the status of carryover wheat stocks as a percentage of the total use of the agricultural commodity.
WEAT is the CBOT Wheat ETF product
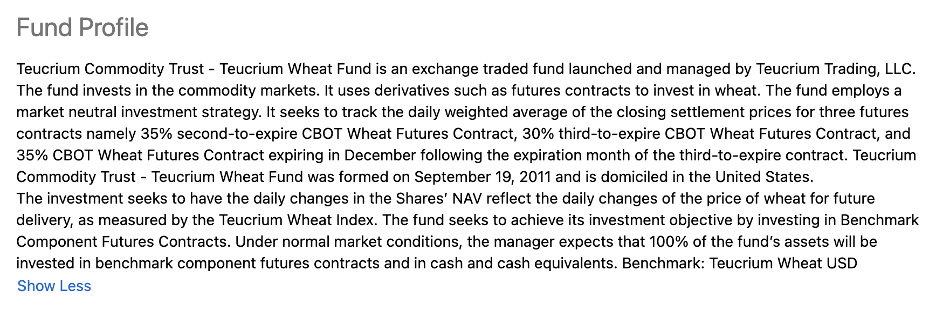
The most liquid and direct route for a risk position in wheat is the CME's CBOT soft red winter wheat futures and futures options. Meanwhile, the Teucrium Wheat ETF product is the only game in town for tracking wheat futures prices. WEAT's fund profile states:
WEAT holds three actively traded CBOT wheat futures contracts, excluding the nearby contract, to minimize roll risk, which can be extreme in the agricultural commodities futures markets.
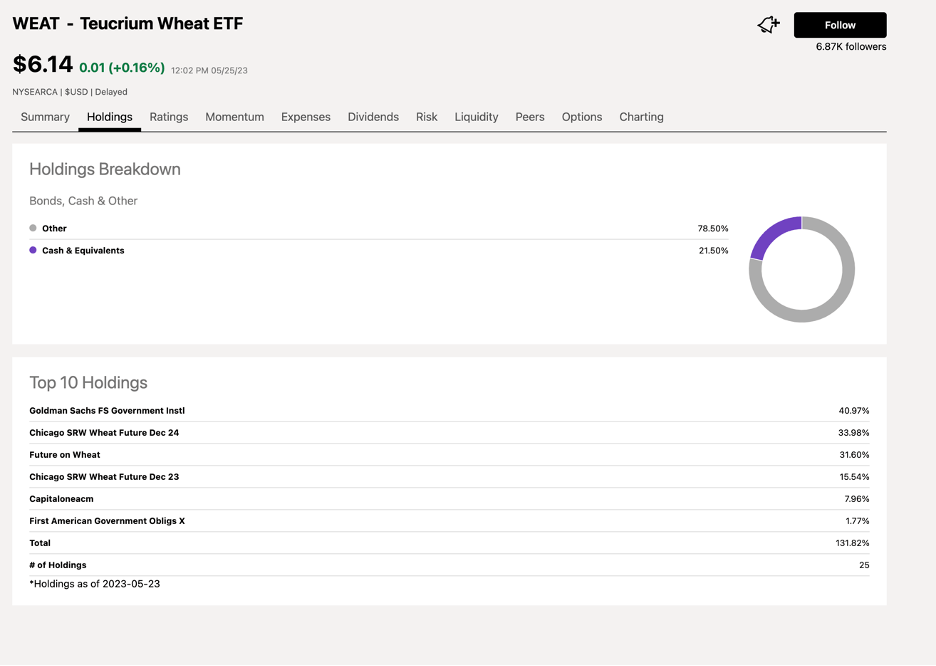
The most recent top holdings indicate the ETF owns SRW, or soft red winter, wheat futures.
At $6.09 per share on May 25, WEAT had over $154 million in assets under management. WEAT trades an average of nearly 595,000 shares daily, making it a liquid product. Meanwhile, Seeking Alpha reports WEAT's management fee at 1.0%, while Barchart lists it at 0.22%.
Since the most price volatility tends to occur in the nearby futures contract, WEAT tends to underperform CBOT wheat futures on the upside and outperform during price corrections. The continuous CBOT wheat futures contract rose 204.4% from $4.6825 per bushel in June 2020 to $14.2525 in May 2022. The $5.9425 May 2023 low was a 58.3% correction from the 2022 high.
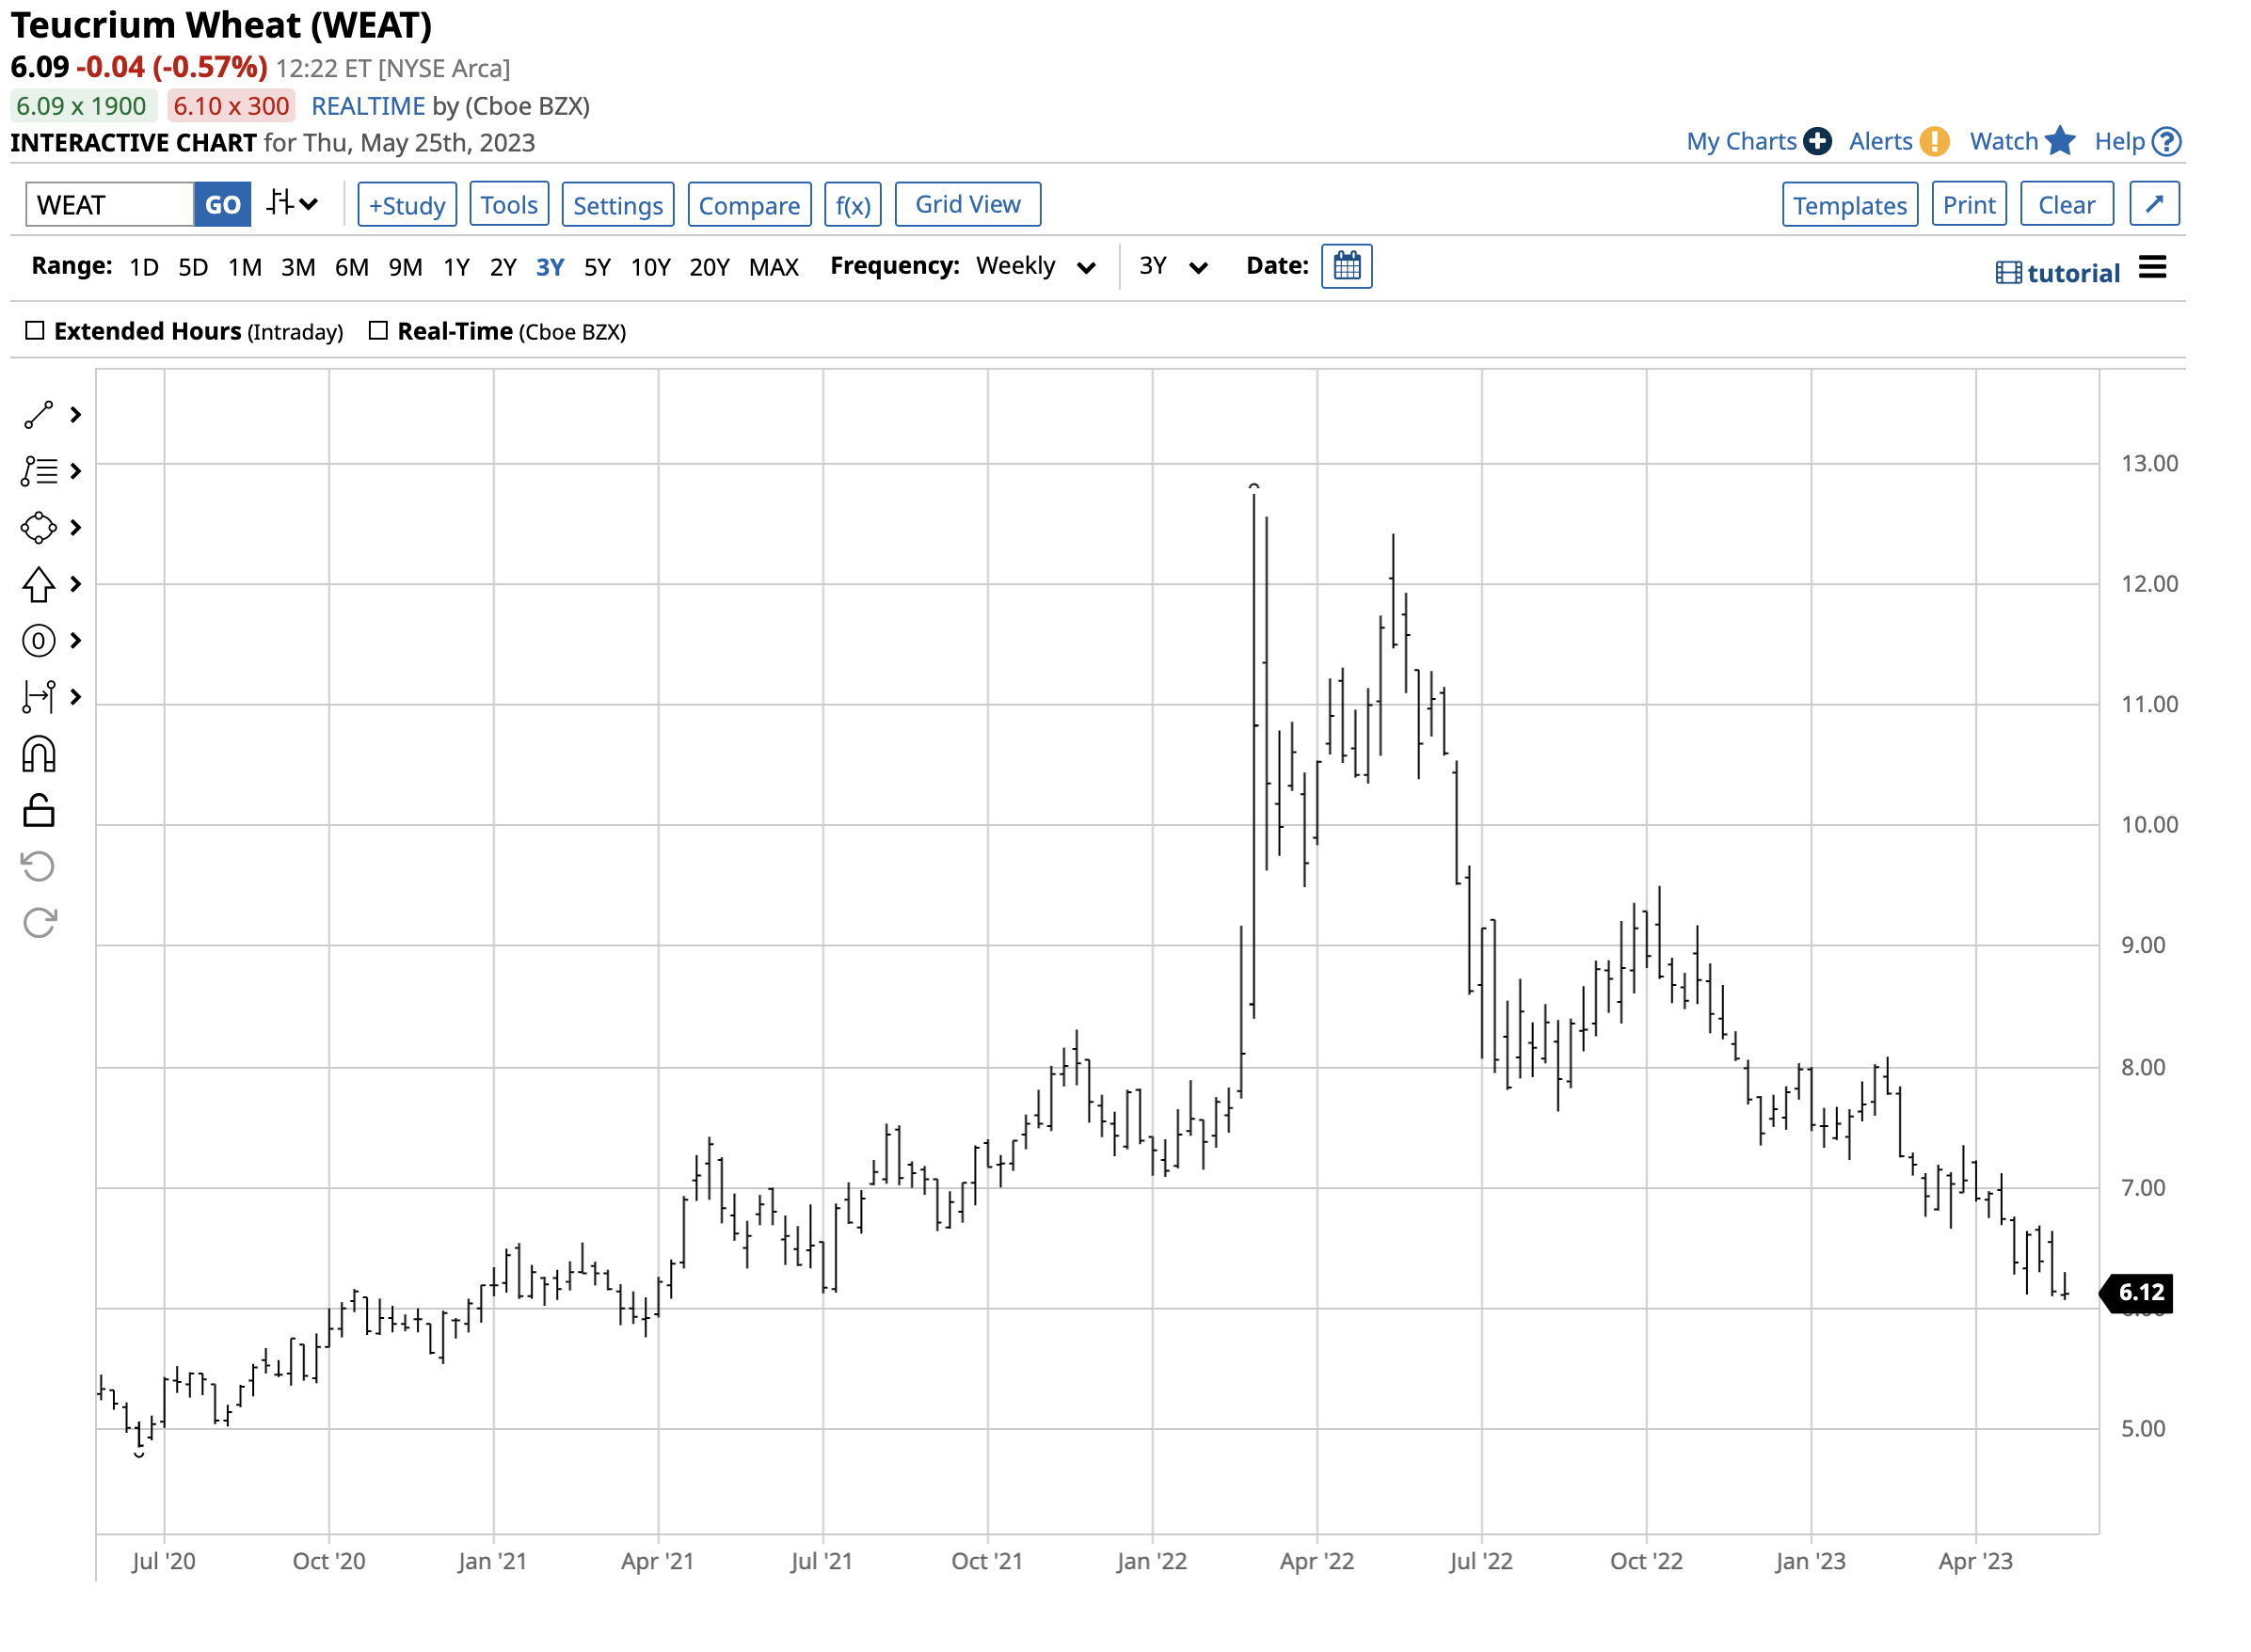
The chart highlights the 162.9% gain from $4.85 to $12.75 per share from June 2020 through March 2022. WEAT declined to a $6.07 low in May 2023, 52.4% below the 2022 peak. WEAT's composition caused the ETF to do slightly worse on the upside but better than the nearby wheat futures contract on the downside on a percentage basis.
The KCBT-CBOT wheat spread could be a compelling reason to approach the CBOT wheat futures market from the long side at the $6 per bushel level. The Teucrium Wheat ETF is a substitute for those seeking exposure to the grain without venturing into the highly leveraged and margined futures arena.
For further details see:
WEAT: A Critical Sentiment Barometer Is Very Bullish