WEAT - WEAT: Lots Of Volatility Ahead For The Commodity That Feeds The World
Summary
- Wheat prices have recovered, displaying a bullish trend since late January.
- The latest WASDE report was bullish: Global stocks are at the lowest level since 2016/2017.
- The conflict in Ukraine puts a floor under wheat prices. Europe’s breadbasket and logistical hub are war zones.
- The KCBT-CBOT spread points higher, presenting a sign of consumer concerns about price and availability.
- WEAT is the wheat ETF product: WEAT tracks a portfolio of three actively-traded CBOT soft red winter wheat futures contracts.
Wheat is the grain that is the primary ingredient in bread, a staple that feeds people worldwide. Processors typically mill wheat into flour required for many goods, including bread, muffins, pasta, cakes, cereals, crackers, and a host of other consumer products. A leading source of starch and energy, wheat can be a beneficial nutrient as it supplies protein, vitamin B, dietary fiber, and phytochemicals, which can strengthen the immune system.
Wheat cultivation began 10,000 years ago, and the Pharaohs in ancient Egypt were buried with wheat. Today, wheat provides around 20% of the daily protein to billions of people, making it the most widely grown commercial crop. Three types of wheat trade on the U.S. futures exchange:
- CBOT soft red winter wheat : The most liquid wheat futures market that is a global benchmark. Soft wheat has a low gluten content, making it optimal for cakes, cookies, and pastries that are tender and crumbly.
- KCBT hard red winter wheat : Hard wheat has a higher gluten content and is optimal for bread flour. Many U.S. bread manufacturers price their requirements using formulas tied to the KCBT price.
- MGE Spring wheat : Tends to have the highest protein content.
On the March futures contracts, the three wheat futures markets had the following open interest or total number of open long and short positions as of February 15:
- CBOT soft red winter wheat- 75,349 contracts
- KCBT hard red winter wheat - 46,017 contracts
- MGE Spring wheat - 18,193 contracts
The CBOT futures are the most liquid because they attract the highest volume and open interest, making them a benchmark for the grain. Meanwhile, the Teucrium wheat ETF product ( WEAT ) moves higher and lower with a portfolio of three actively traded CBOT soft red winter wheat contracts. In 2022, the CBOT soft red winter price spiked to a record $14.2525 per bushel as the war in Ukraine caused price and supply concerns. The CBOT wheat corrected but remains at a multi-year high as the 2023 crop year gets underway in the Northern Hemisphere.
A bullish trend since late January
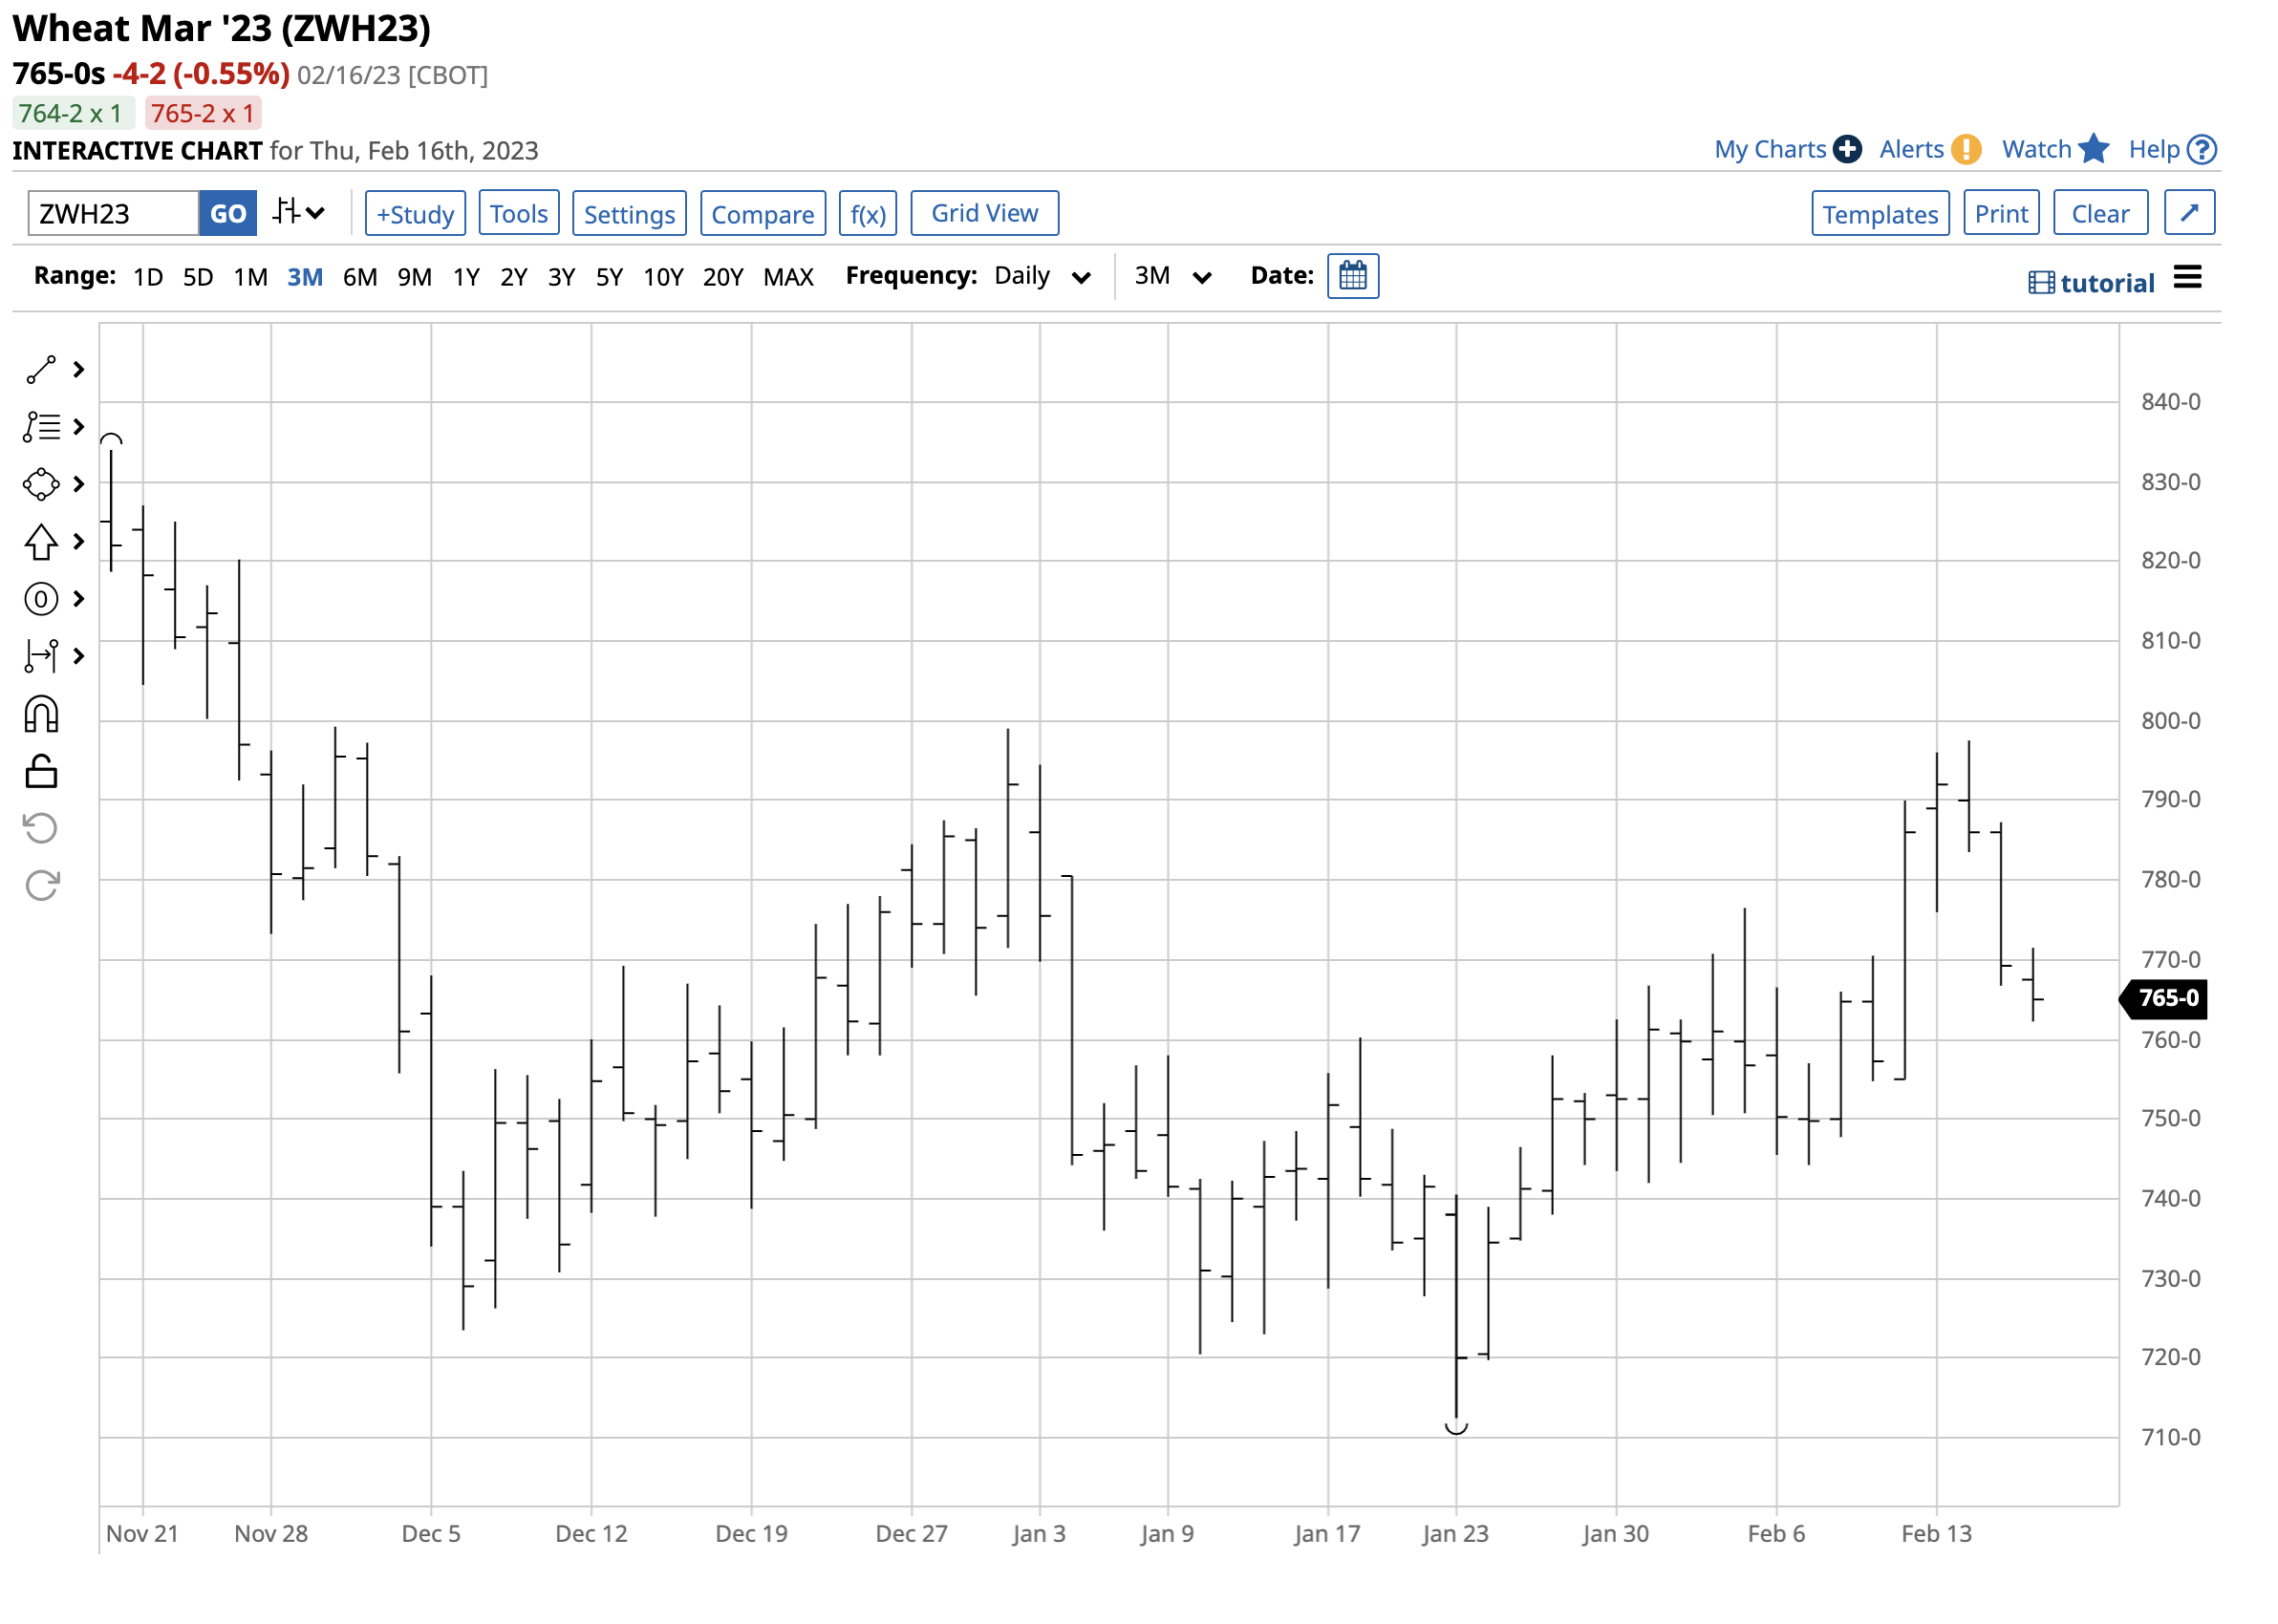
CBOT wheat for March delivery fell to $7.1250 per bushel on January 23, 2023.
The chart shows the pattern of higher lows and higher highs that took the March wheat futures to $7.9750 per bushel on February 14. At $7.65 per bushel on February 16, nearby wheat futures were above the midpoint of the trading range, with the short-term bullish trend remaining intact. The continuous CBOT wheat futures contract fell from $14.2525 in March 2022 to $7.0250 per bushel in December 2022, where they found a bottom.
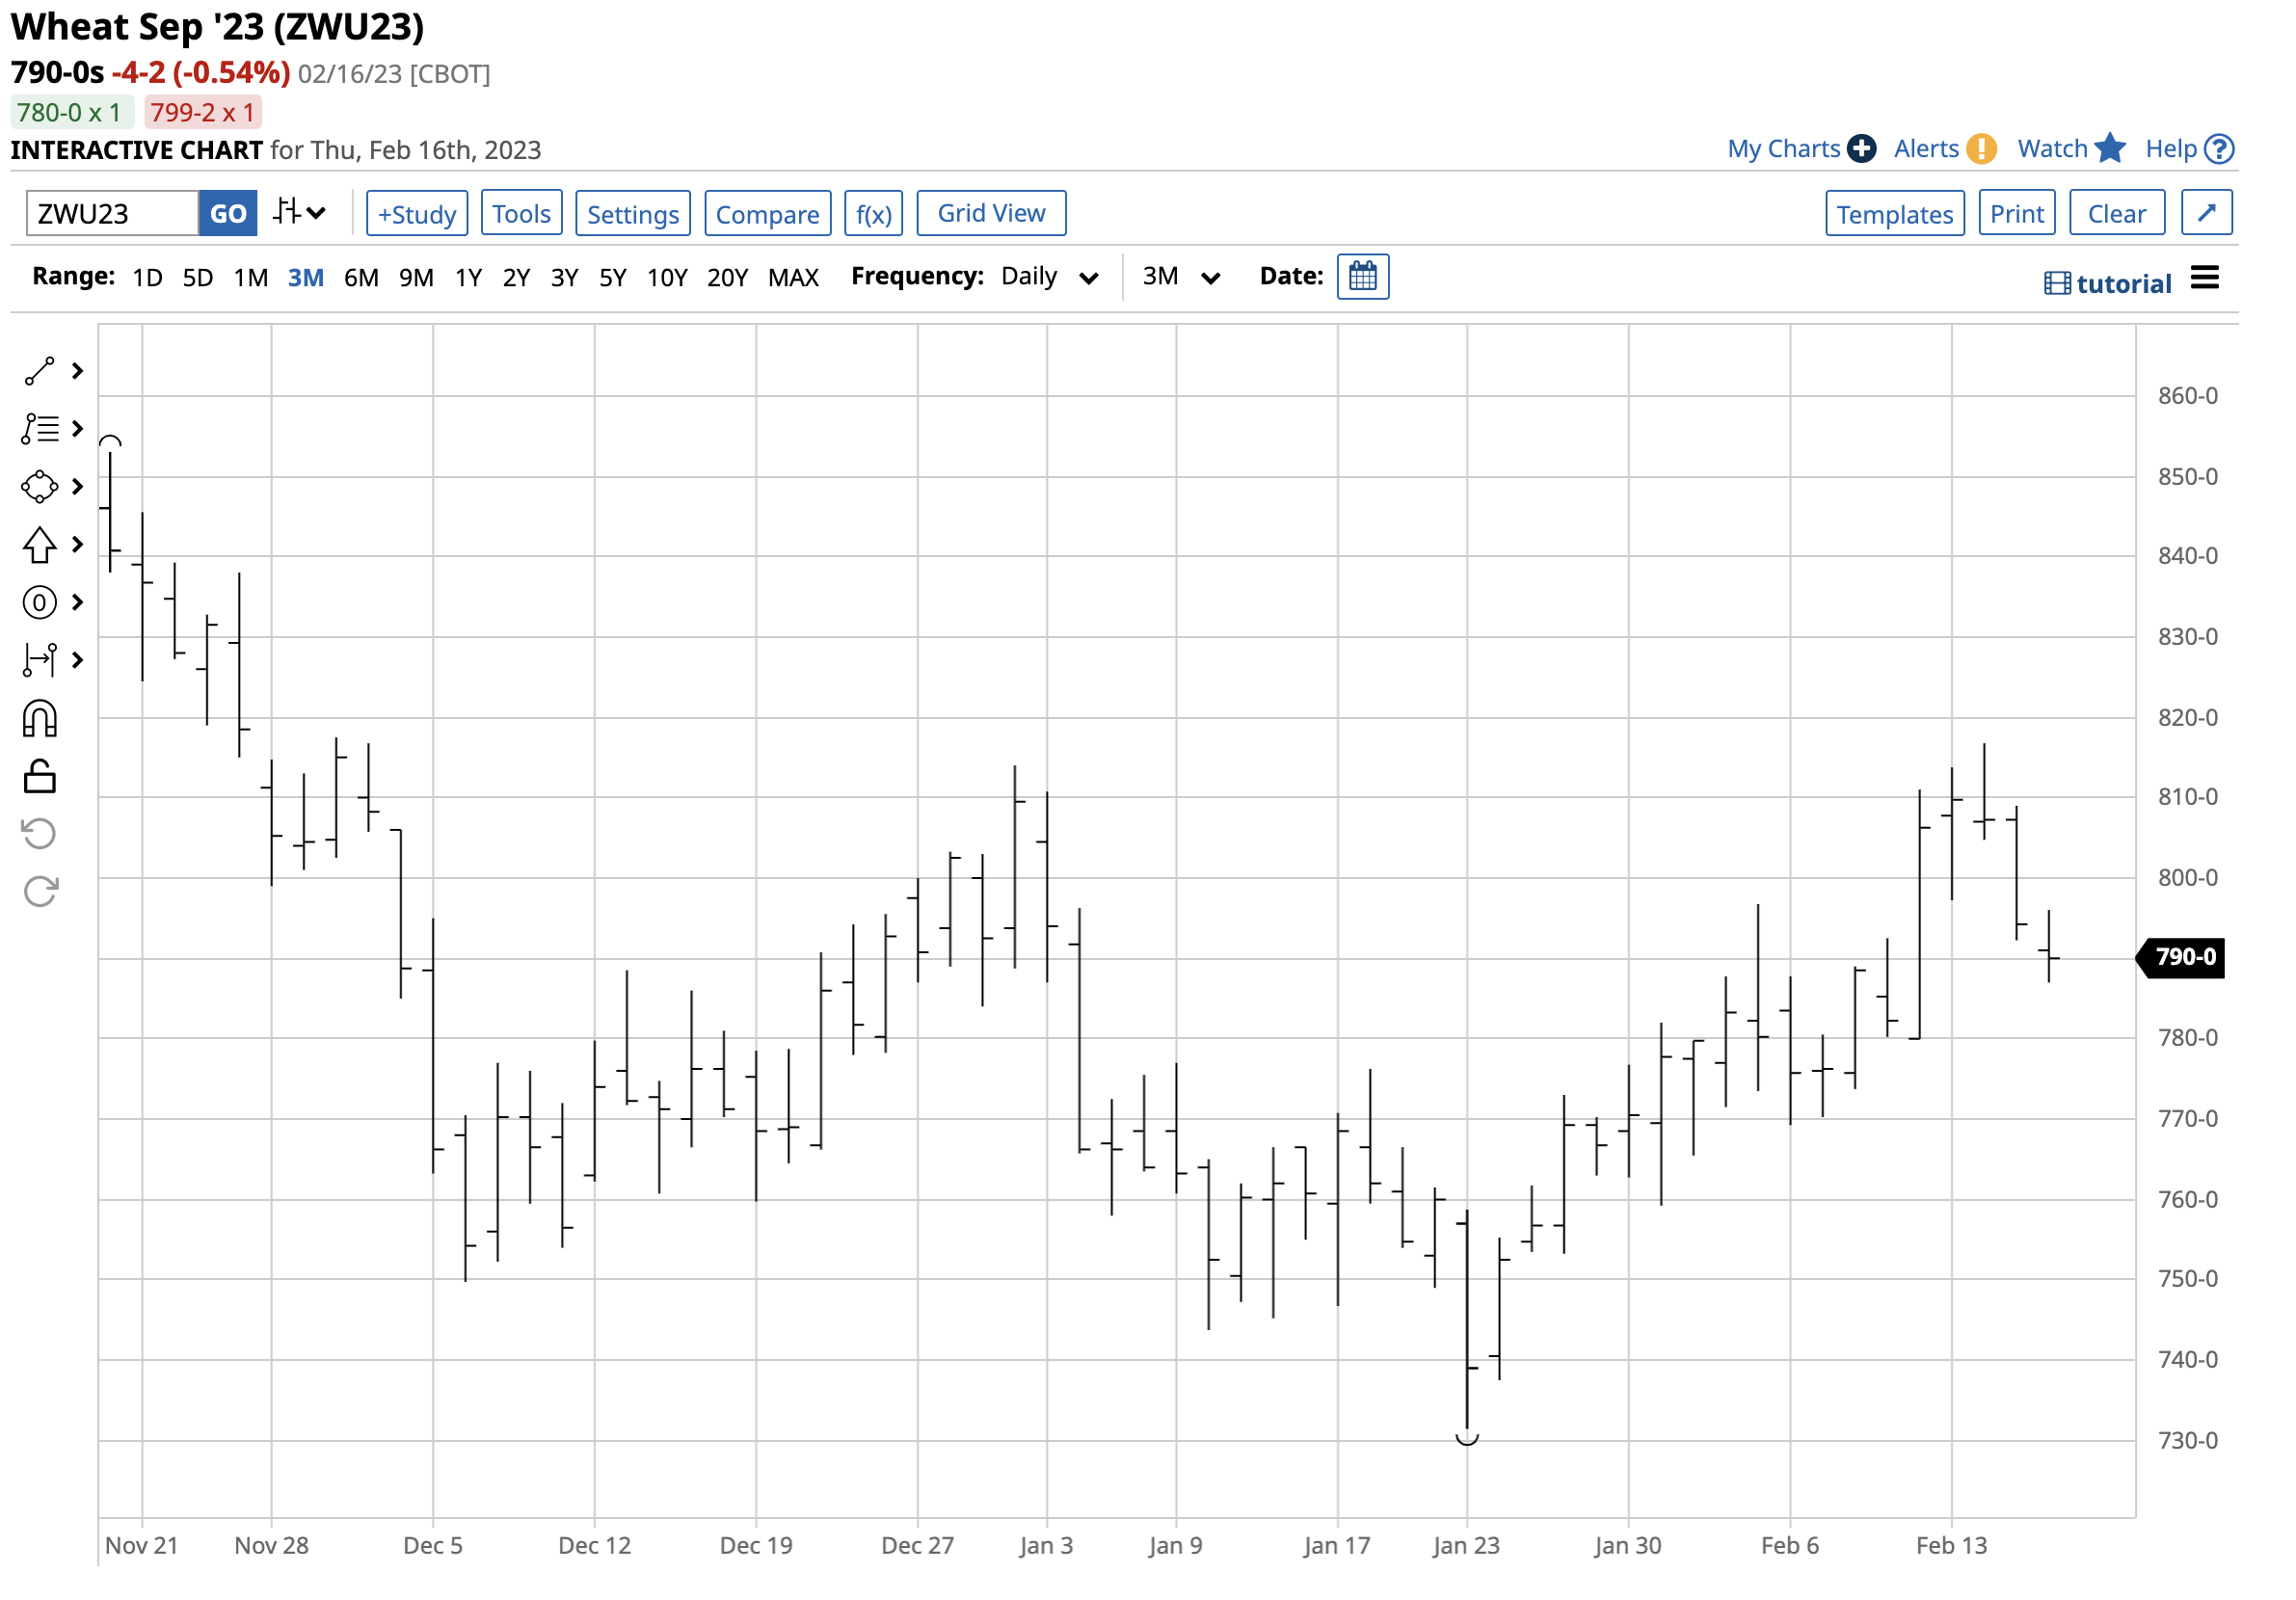
Short-Term CBOT New-Crop September Wheat Futures Chart (Barchart)
The new-crop September CBOT wheat futures chart shows the price at the $7.90 per bushel level as the market expects wheat prices to rise over the coming months.
A bullish February WASDE report
In the latest February World Agricultural Supply and Demand Estimates Report, the USDA told the wheat market:
The supply and demand outlook for 2022/23 U.S. wheat is largely unchanged this month with minor revisions to domestic use and ending stocks. Food use is lowered 2 million bushels to 975 million, which still is a record. The decrease is based on the NASS Flour Millings Products report, indicating a 2 percent reduction in wheat ground for flour for the October-December quarter compared to a year earlier. Seed use is raised 1 million bushels to 70 million, based primarily on NASS seed use data for the September-November quarter. Wheat exports are unchanged at 775 million tons with offsetting by-class changes. Projected 2022/23 ending stocks are raised 1 million bushels to 568 million. The 2022/23 season average farm price is forecast $0.10 per bushel lower at $9.00, based on prices received to date and expectations for cash prices for the remainder of 2022/23. The global wheat outlook for 2022/23 is for increased supplies, consumption, trade, and stocks. Supplies are raised 2.4 million tons to 1,060.5 million, primarily on higher production for Australia and Russia. Australia production is raised 1.4 million tons to 38.0 million, which would be a third consecutive record. The majority of the increase is for Western Australia based on harvest receivals to date. Russia production is raised 1.0 million tons to 92.0 million on larger spring wheat harvested area. Global consumption is increased 1.4 million tons to 791.2 million, mainly on higher feed and residual use by Canada, EU, and Russia more than offsetting lower food, seed, and industrial use by Bangladesh. World trade is raised 1.3 million tons to 212.9 million on higher exports by Australia, Ukraine, EU, and Russia more than offsetting reduced exports by Canada. Projected 2022/23 ending stocks are raised 0.9 million tons to 269.3 million on increases for Australia and China more than offsetting a reduction for Ukraine. However, ending stocks still remain the lowest since 2016/17.
While the USDA increased projected 2022/2023 ending stocks, they are at the lowest since 2016/2017, a bullish factor. Still, the USDA expects “ higher exports ” from Russia and Ukraine, which could be a leap of faith.
Europe’s breadbasket is a war zone
The war in Ukraine is marking its first anniversary in February 2023. Ukraine and Russia have already gone through one crop year of war, with a second beginning in the coming weeks.
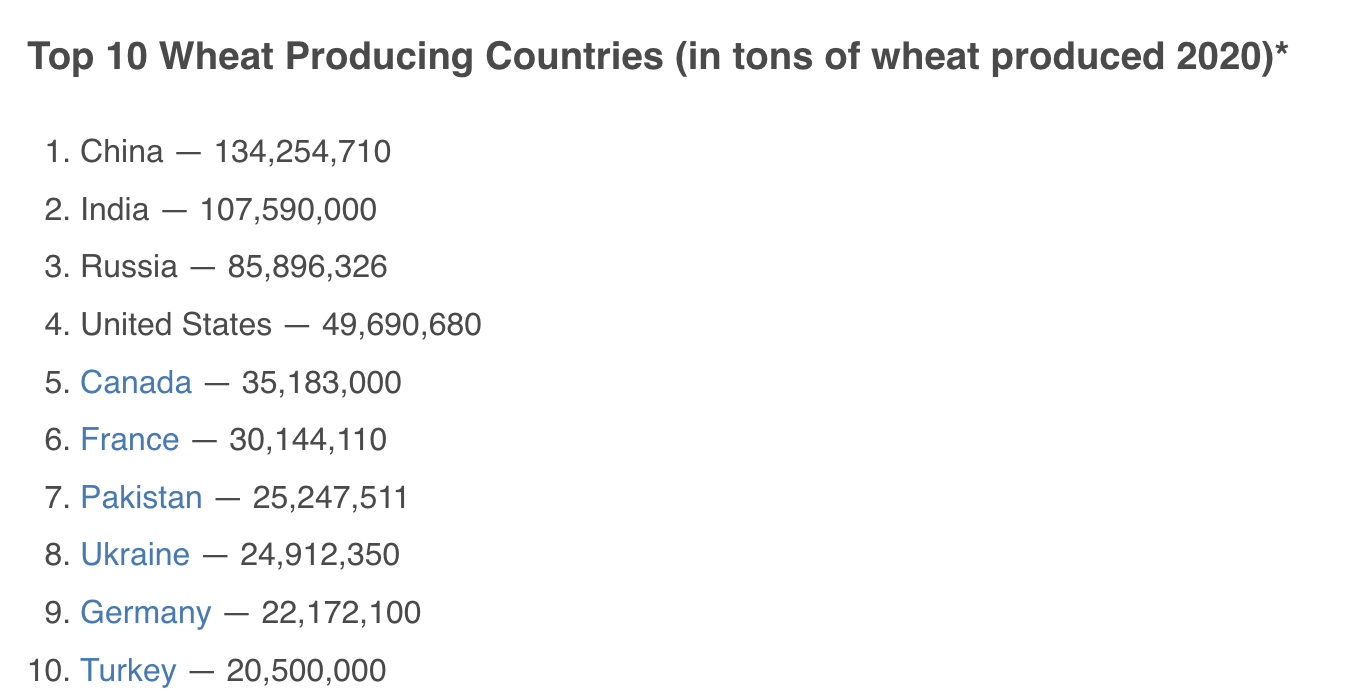
The chart highlights that while Russia is the third-leading wheat-producing country and Ukraine is the eighth, combined output was more than India in 2020.
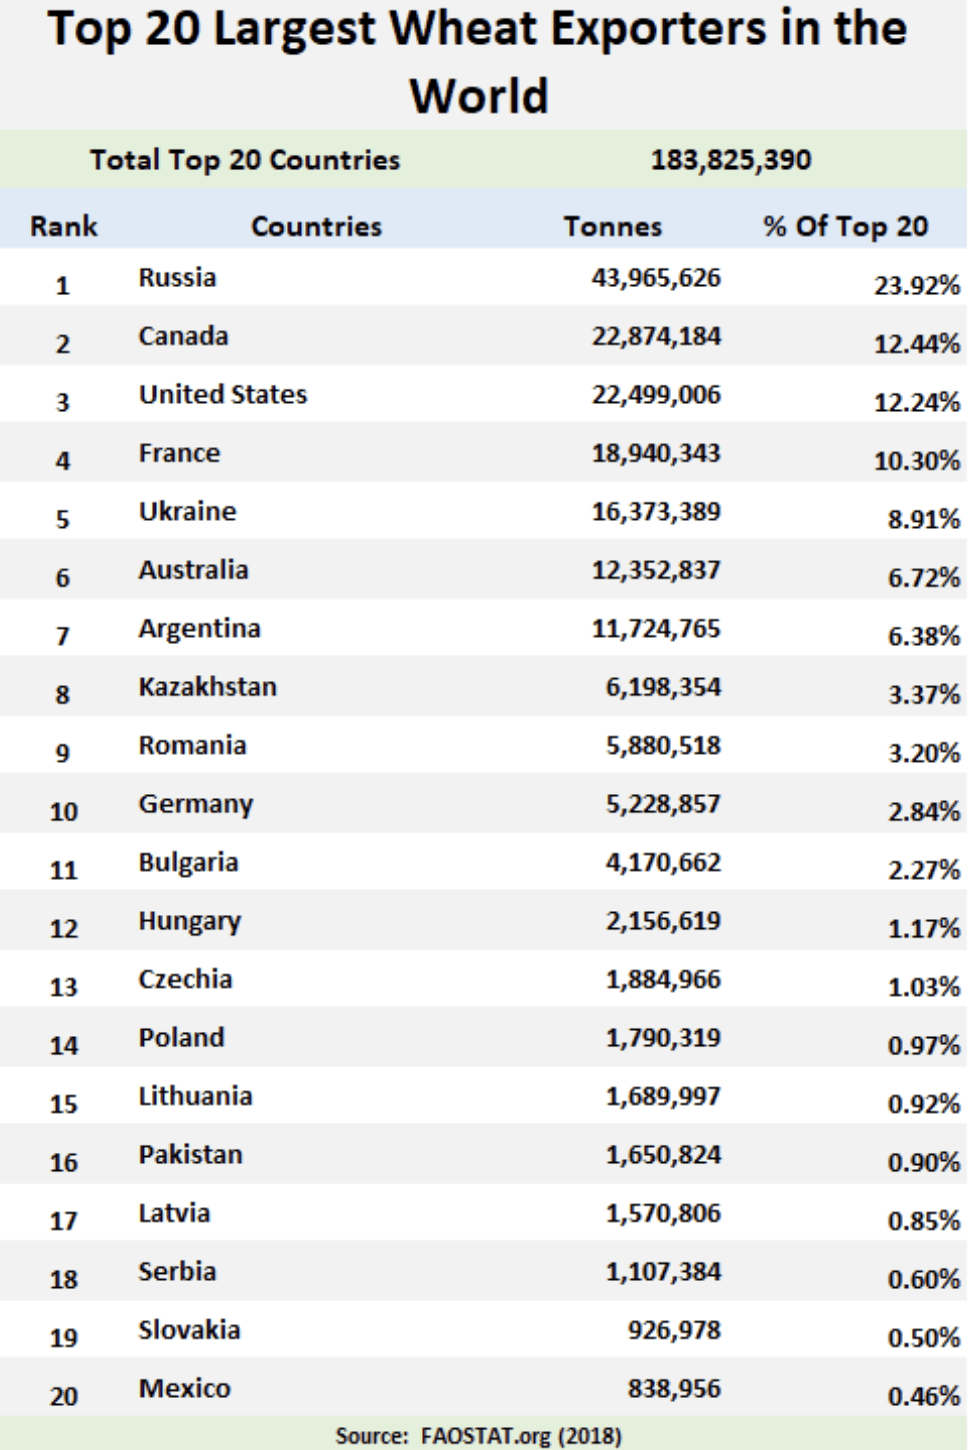
The chart highlights Russia as the leading wheat exporter, with Ukraine fifth and combined exports amounting to 32.83%, nearly one-third of the world’s annual wheat supplies.
The war has impacted the fertile areas in Russia and Ukraine that produce wheat, and mine and battlefields limit the potential for wheat production. Moreover, the Black Sea ports that are critical logistical hubs and origins for worldwide wheat exports are a war zone. If the war continues, it will be challenging for Ukraine and Russia to produce enough wheat to satisfy the global demand. Falling global stocks are likely a consequence of last year’s regional production. Another year of war could exacerbate wheat’s tightening balance sheet, tilting it towards a significant supply deficit.
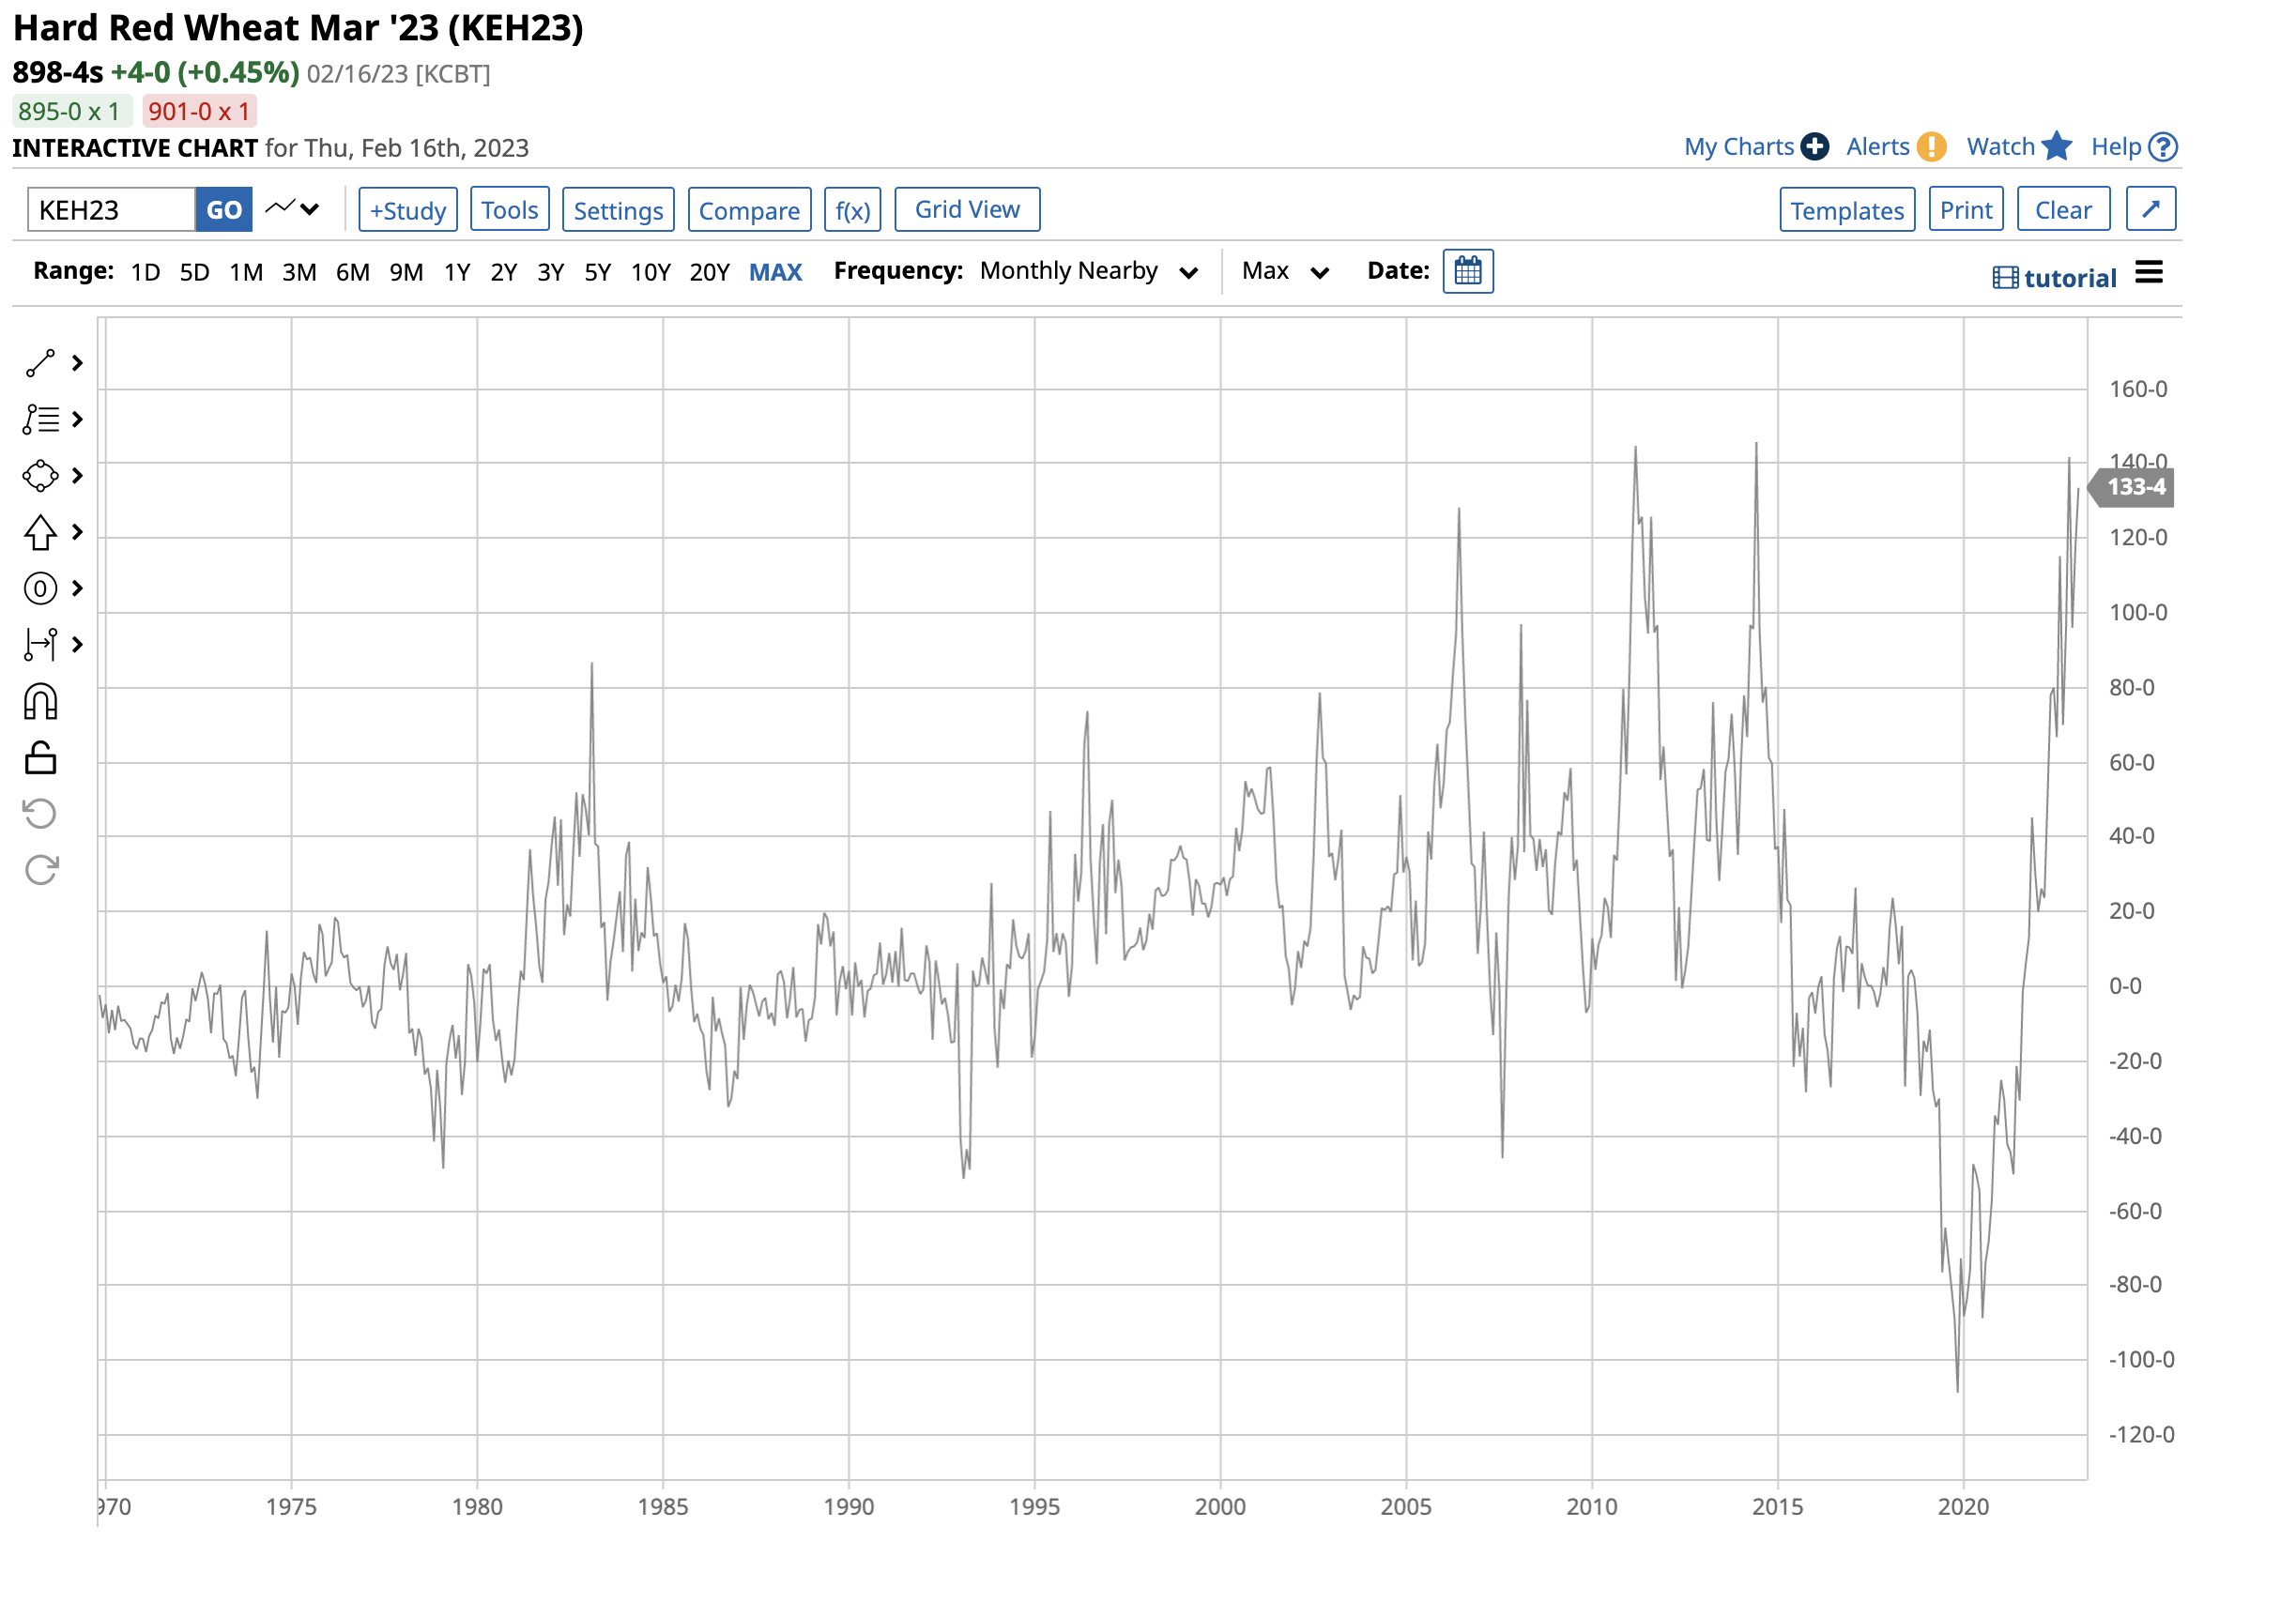
KCBT-CBOT spread points higher
One of my favorite sentiment measures in the wheat futures market is the price spread between CBOT soft red and KCBT hard red winter wheat. The long-term median for the spread is a 20-30 cents premium for the KCBT wheat. When supplies are plentiful, and prices decline, the CBOT wheat tends to trade at a premium. When supply concerns rise with prices, the spread tends to move to a significant premium for the KCBT hard red winter wheat.
The reason for the price action in the spread is U.S. bread manufacturers tend to price requirements using a formula tied to the KCBT price, as hard red winter wheat is optimal for bread flour. When prices fall, wholesale consumers tend to purchase wheat hand-to-mouth, reducing the hedging demand. When prices rise, and availabilities are in jeopardy, they panic and head for the futures market to lock in prices and supplies.
Nearby KCBT Wheat Futures minus Nearby CBOT Wheat Futures (Barchart)
The chart dating back to the late 1950s illustrates at a $1.3350 premium for the KCBT hard red over the CBOT soft red winter wheat, consumers are more than concerned. The spread level indicates panic, as it is not far below the 2014 $1.4575 per bushel all-time high. The spread tells us the wheat market is nervous, and any weather issues or escalation of hostilities in Ukraine and surrounding countries could cause wheat prices to return to last year’s record CBOT wheat futures high of $14.2525 per bushel in the blink of an eye.
WEAT: The CBOT Wheat ETF Product
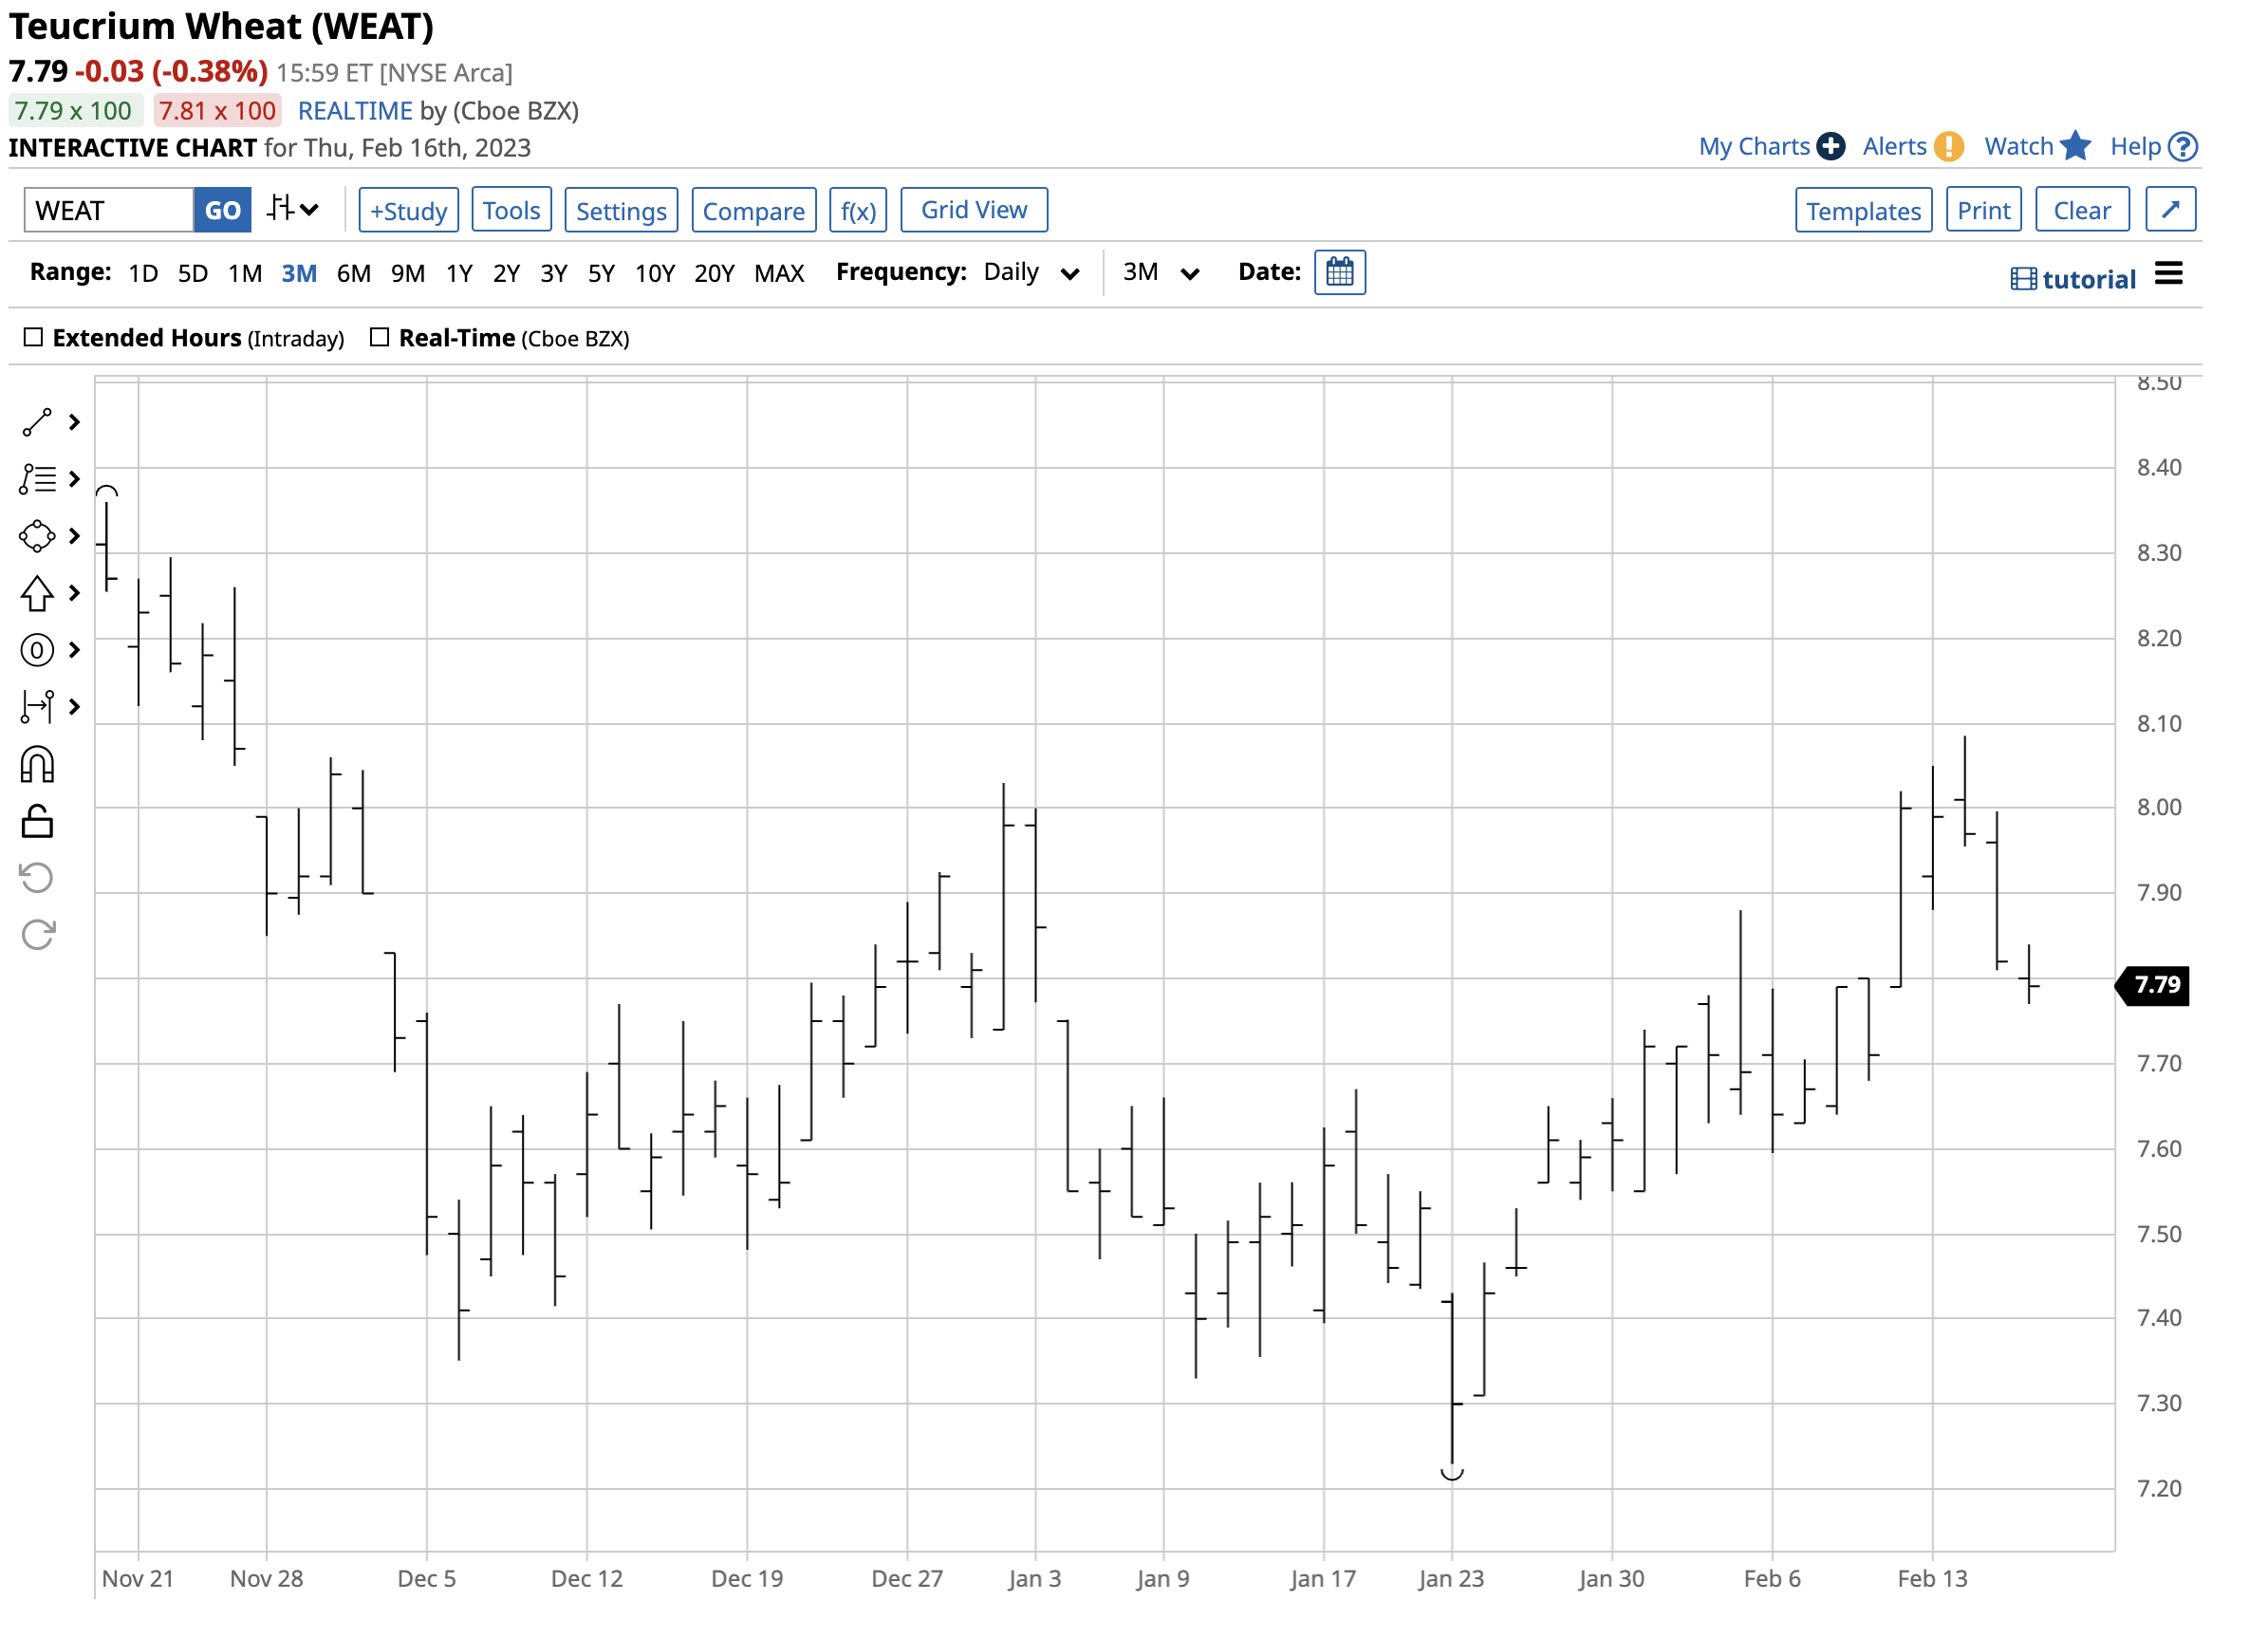
The most direct and liquid route for a risk position in wheat is via the CME’s CBOT soft red winter wheat futures. The Teucrium Wheat ETF product ( WEAT ) provides an alternative for those looking to participate in the wheat market without venturing into the highly volatile, leveraged, and margined futures arena. At $7.79 per share on February 16, WEAT had $205.941 million in assets under management. WEAT is a liquid ETF that trades an average of 688,046 shares daily and charges a 0.22% management fee.
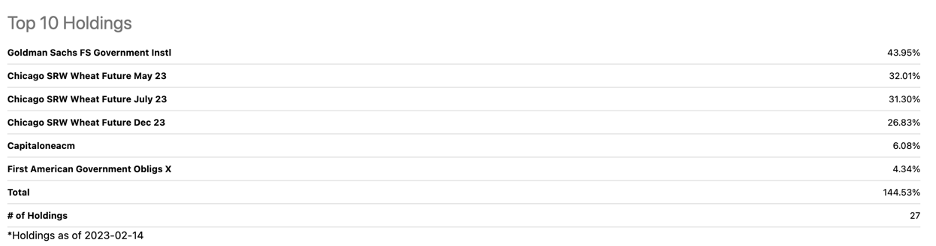
WEAT’s most recent top holdings include:
The chart shows WEAT’s exposure is spread between the May, July, and December futures contracts to minimize roll risk. Since the nearby futures contract tends to experience the most price volatility because it attracts the highest level of speculative interest, WEAT tends to underperform the nearby futures on rallies and outperform when the price corrects lower.Nearby March CBOT wheat futures rallied from $7.1250 on January 23 to $7.9750 on February 14, an 11.9% rise. The price corrected to $7.6225 per bushel on February 16, a 4.4% decline.
Over the same period, WEAT rose from $7.23 to $8.09 per share or 11.9% and then corrected to $7.77, falling 3.95%. WEAT kept pace with the March futures contract on the upside and slightly outperformed during the recent decline. The performance on the upside tells us the deferred contracts posted a similar percentage gain to the nearby futures, a sign that consumer hedging is robust.
We are moving into the 2023 crop year in the Northern Hemisphere over the coming weeks. While Mother Nature and the weather are always the most critical factor for agricultural products, the ongoing war in Ukraine poses a crucial threat to world wheat supplies. Expect lots of volatility in the wheat futures arena over the coming weeks and months. The KCBT versus CBOT wheat spread’s level tells us sentiment is bullish, and the odds favor higher prices.
For further details see:
WEAT: Lots Of Volatility Ahead For The Commodity That Feeds The World