WEAT - WEAT: Poor Performance In 2023 And The Prospects For 2024
2024-01-18 12:30:13 ET
Summary
- CBOT soft red winter wheat prices reached a record high in March 2022 due to the war in Ukraine.
- Wheat prices have since declined, but the potential for a rally in 2024 is increasing.
- Factors such as the ongoing war, low prices, crop uncertainty, population growth, and supply-demand deficit support the bullish case for wheat prices in 2024.
- Teucrium Wheat ETF is the fund tracking a portfolio of three CBOT wheat futures contracts.
While crude oil is a highly political commodity, wheat has the longest history of impacting global events. Wheat is the essential ingredient in bread and other food products that feed the world. Any government's first job is to protect and nourish citizens. When food supplies decline or become too expensive, leaders lose power. The most recent example was the Arab Spring that swept across North Africa and the Middle East from 2010 through 2012. That was the uprising that unseated governments and began as bread riots in Tunisia and Egypt. Meanwhile, history provides many other examples of rising wheat prices leading to civil uprisings.
CBOT soft red winter wheat prices rose to a record high in March 2022 when Russia invaded Ukraine, starting a war in Europe's breadbasket. While the price of nearby CBOT wheat futures has declined from the $14.2525 high to below $6 per bushel, the war continues in early 2024. The critical agricultural commodity's current price level is low, increasing the odds of a 2024 rally. The Teucrium Wheat ETF ( WEAT ) product tracks a portfolio of three liquid CBOT wheat futures contracts.
A significant 2023 decline and lower prices in early 2024
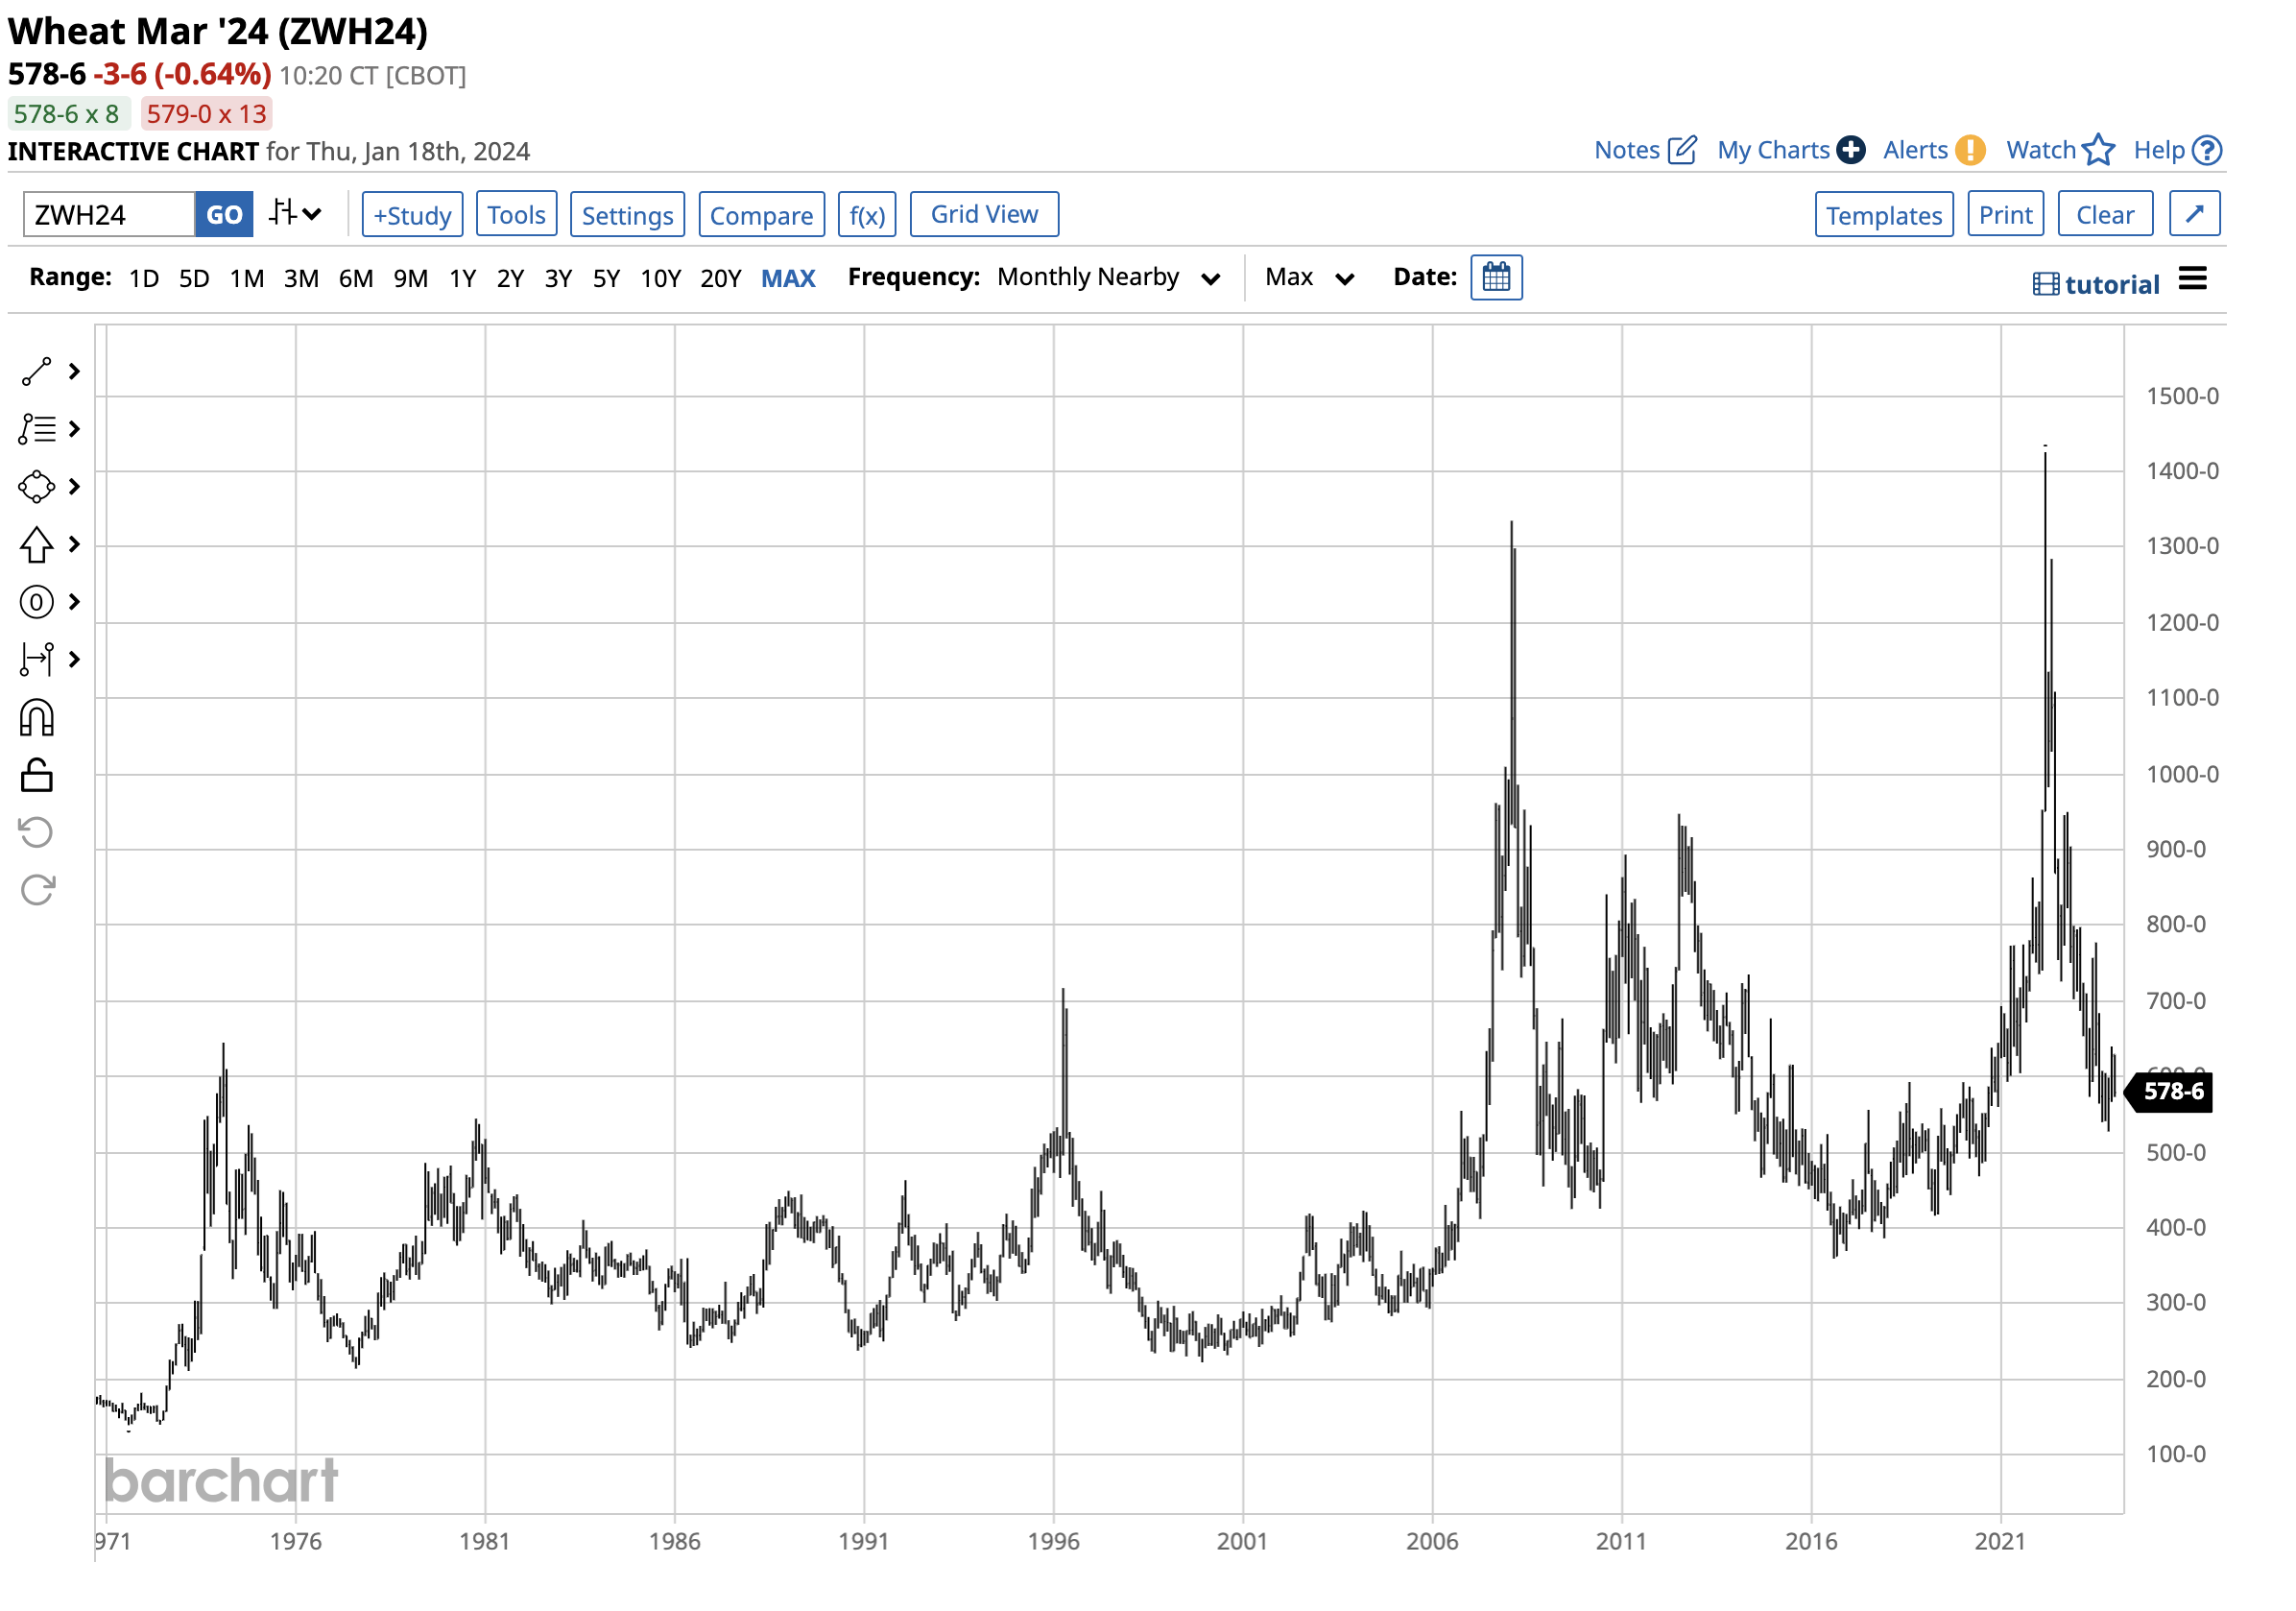
After reaching a record high when Russia invaded Ukraine, wheat prices collapsed.
The chart dating back to 1970 shows CBOT soft red winter wheat futures eclipsed the February 2008 $13.3450 all-time peak in March 2022 when the price rose to $14.2525 per bushel. The wheat futures plunged 63% to $5.2750 in November 2023.
CBOT wheat futures moved 20.7% lower in 2023, closing the year at $6.28 per bushel. On January 18, the leading wheat futures were 7.8% lower at $5.7875 per bushel.
A mixed January WASDE report for wheat - Sal Gilberte highlights a deficit
On Friday, January 12, the U.S. Department of Agriculture released its first World Agricultural Supply and Demand Estimates Report of 2024. The USDA told the wheat market:
Projected 2023/24 U.S. wheat ending stocks are lowered 11 million bushels on decreased supplies that more than offset less use. June 1 beginning stocks are reduced based on the NASS Grain Stocks report. Seed use is reduced 1 million bushels to 64 million. All wheat feed and residual use for 2023/24 is unchanged and reflects disappearance for June-November as indicated by the December 1 and revised September 1 stocks released in the NASS Grain Stocks report; however, there are offsetting by-class changes to feed and residual use. The 2023/24 season-average farm price is forecast $0.10 per bushel lower at $7.20, based on prices received to date and expectations for futures and cash prices for the remainder of 2023/24. The global wheat outlook for 2023/24 is for larger supplies, consumption, trade, and ending stocks compared with last month. Global supplies are raised 3.6 million tons to 1,056.5 million on higher beginning stocks and production. The increase in global beginning stocks is primarily the result of revisions for Ukraine, where beginning stocks are raised 2.2 million tons to 3.5 million on downward revisions to feed and residual use estimates since 2021/22. Production is changed in several countries based mostly on updated government estimates, with increases for Russia, Ukraine, and Saudi Arabia more than offsetting a decrease for China. Global consumption is raised 1.8 million tons to 796.5 million, mainly on higher feed and residual use for India and the EU. Consumption for India is raised by 1.3 million tons based on greater implied use from the latest government-held stocks reported by the Food Corporation of India. EU wheat consumption is boosted based on larger projected imports from Ukraine, partially offsetting reduced use of feed grains. World trade is raised 2.4 million tons to 209.5 million on higher exports by Ukraine, Russia, Australia, and Canada that more than offset a decrease for the EU. Exports for Ukraine are raised 1.5 million tons to 14.0 million but are still below last year. Projected 2023/24 ending stocks are raised 1.8 million tons to 260.0 million primarily on increases for the EU and Ukraine.
While U.S. ending stocks declined from the December report, global inventories grew on increases from the European Union and Ukraine.
I reached out to Sal Gilberte, the founder of the Teucrium family of agricultural ETF products, including the WEAT ETF. Sal's take on the January WASDE for wheat was:
Wheat, when taken in isolation, was the outlier with global wheat demand projected to outstrip supply by about 1.4%, or around 11 million metric tons.
A supply-demand deficit and reliance on Ukraine for increased supplies could mean wheat prices below the $5.80 per bushel level on January 18, which is too low.
The bullish case for 2024 - War, low prices, crop uncertainty, population growth, and a fundamental imbalance
At the beginning of 2024, the crop year is on the horizon. After falling by 63% from the record high and 7.4% from the 2023 closing level, wheat prices could be in the buy zone. The following factors favor higher wheat prices in the coming months:
- War: As the war in Europe's breadbasket continues, the potential for lower output is high. Moreover, the Black Sea Ports, a critical logistical hub, remains a war zone, which could impede the transportation of wheat to consumers.
- Low prices: In any commodity market, the cure for low prices is low prices as producers reduce output, inventories fall, and consumers increase buying at lower levels. After the decline from the 2022 high, wheat prices have declined to levels where fundamentals suggest a significant bottom.
- Crop uncertainty: Each crop year, the weather across the leading production regions is the factor that drives prices higher or lower. Any weather event that reduces the global crop output would boost prices.
- Population growth: Wheat is the primary ingredient in the bread that feeds the world. The worldwide population is over eight billion people, and growing means production must keep pace with the growing global demand caused by more mouths of feed.
- Deficit: Sal Gilberte noted that wheat demand will be eleven million metric tons higher than supplies in 2024.
Wheat prices are low considering the compelling bullish factors facing the market in early 2024.
WEAT is the wheat ETF tracking a portfolio of CBOT wheat futures contracts
The fund profile for the Teucrium Wheat ETF product states:
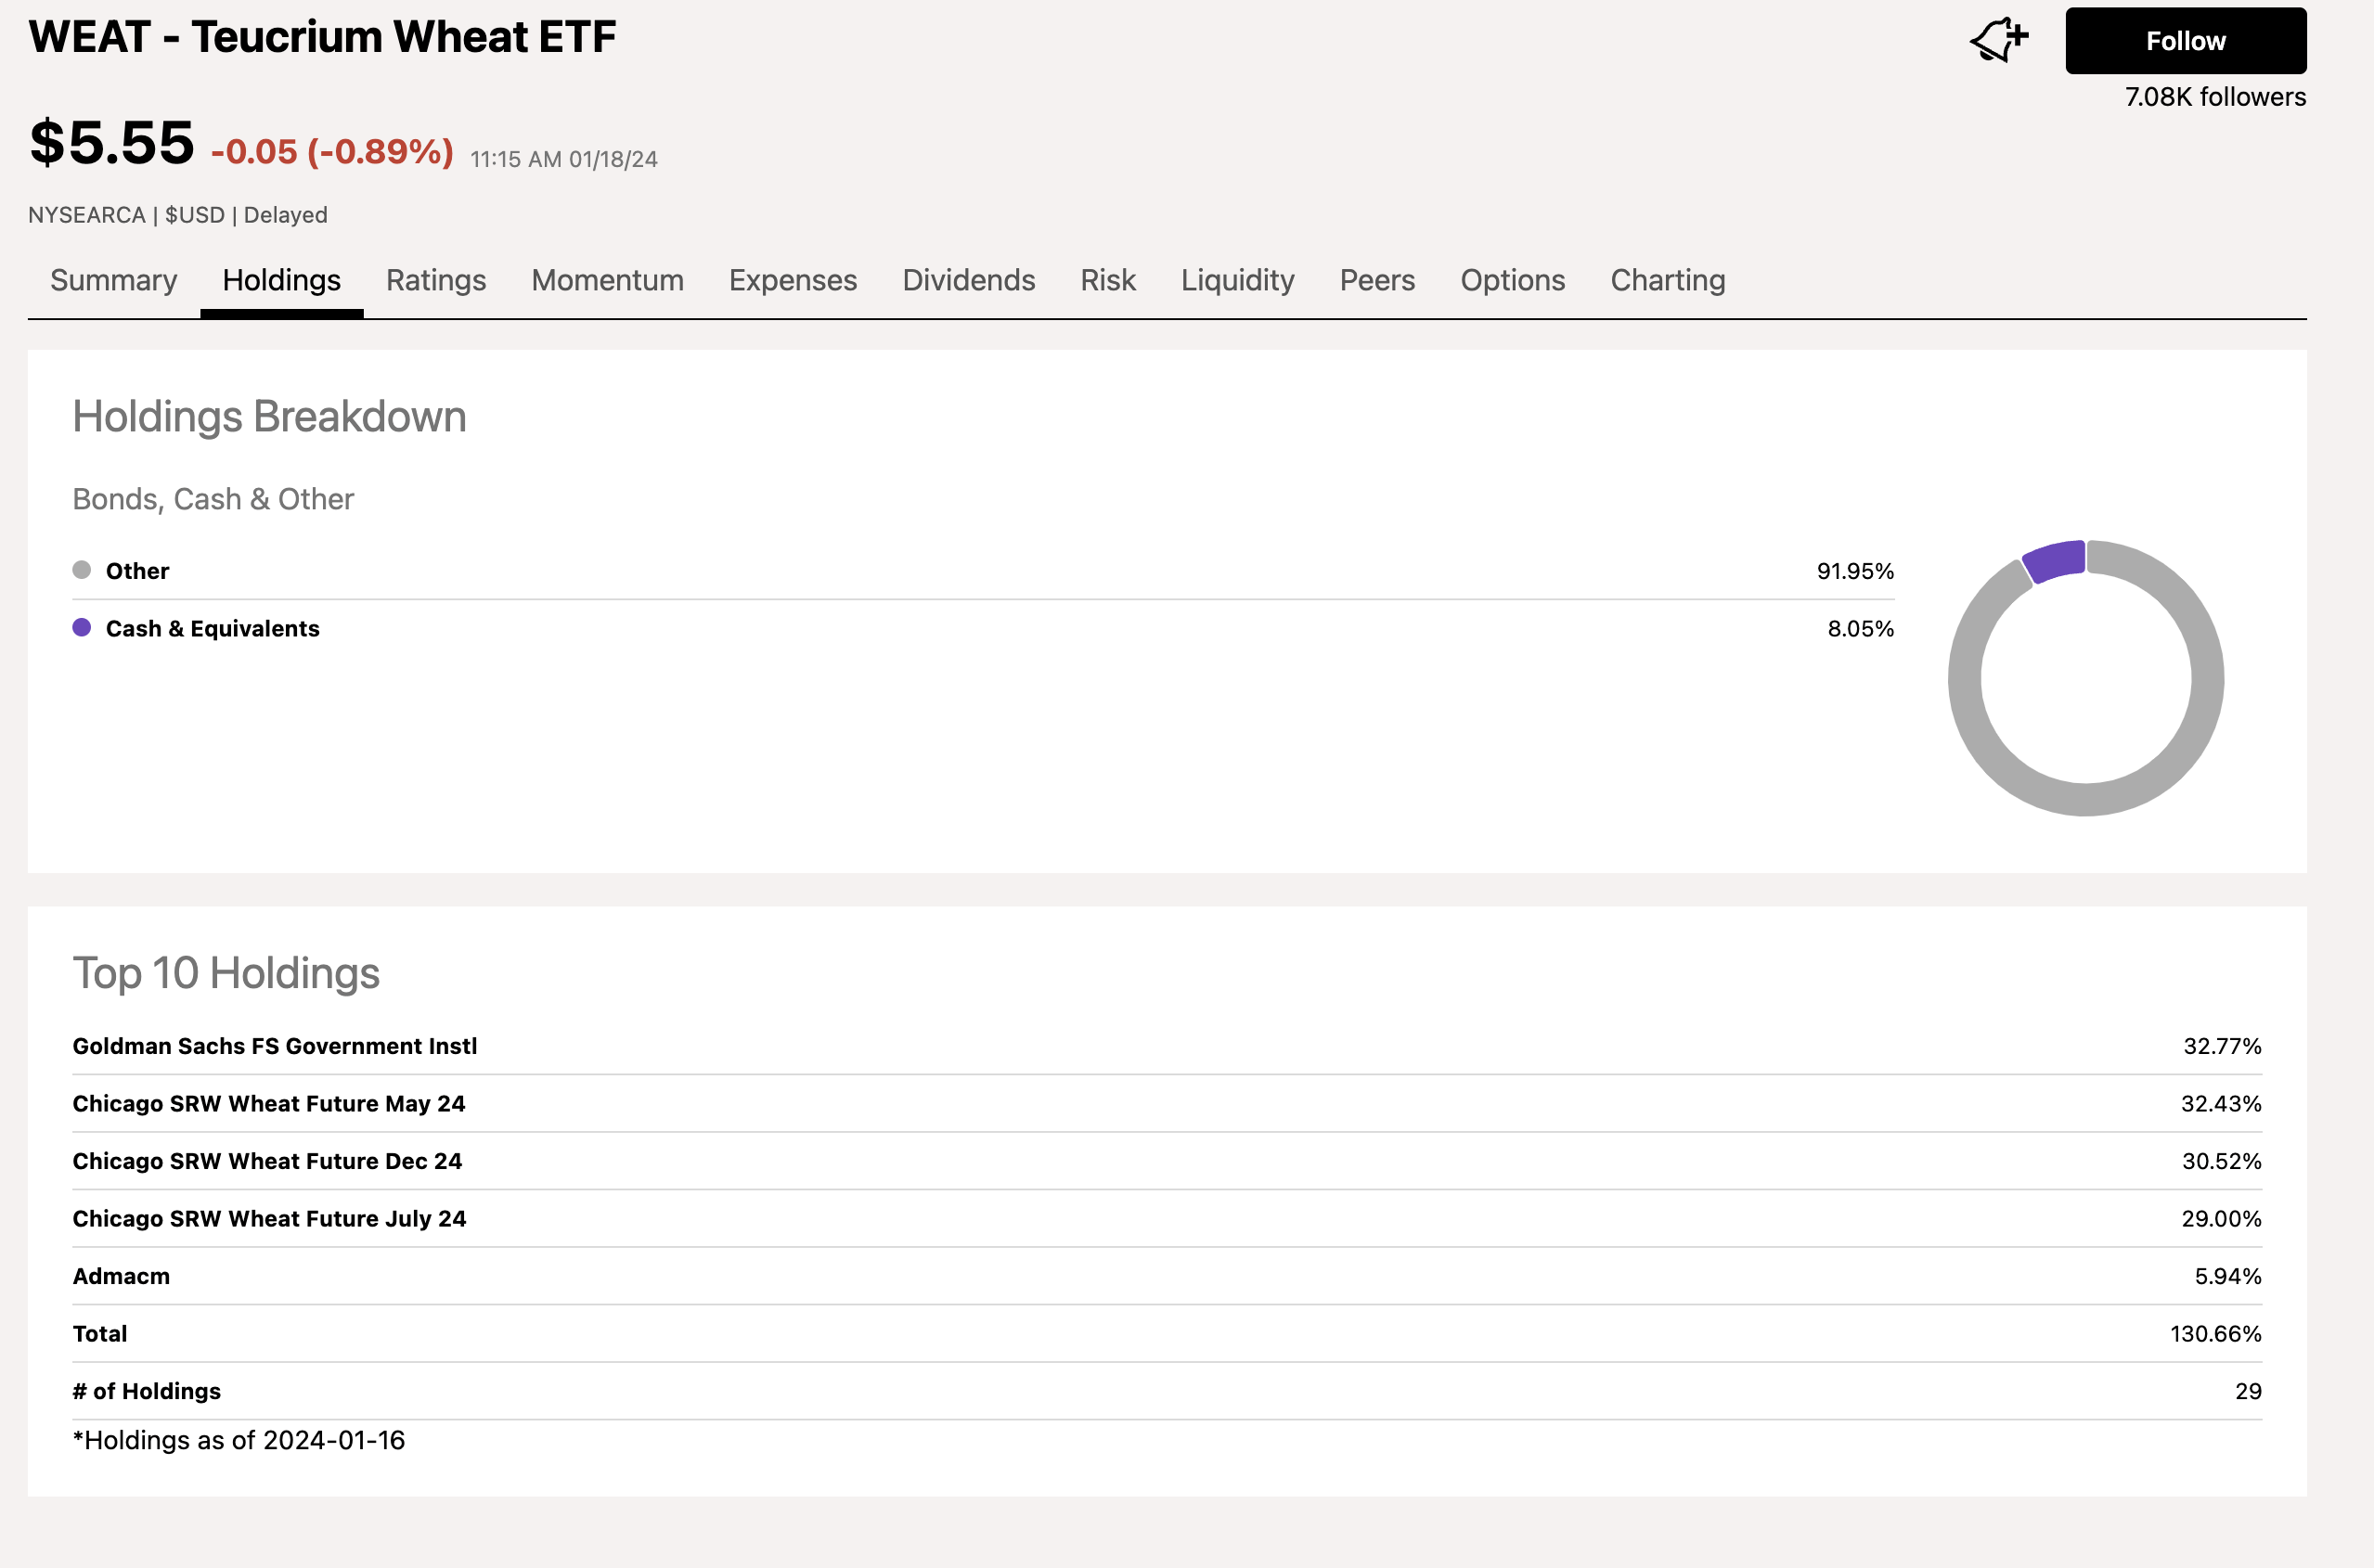
The WEAT ETF mitigates role risk by holding three actively traded CBORT wheat futures contracts, excluding the volatile nearby contract. The most recent top holdings include:
At $5.55 per share on January 18, WEAT had $172.25 million in assets under management. WEAT is a liquid ETF product, trading an average of around 572,000 shares daily. While Seeking Alpha's website states the expense ratio is 1%, the Teucrium website says it is 0.28%.
Since the WEAT ETF reflects the price action in three deferred CBOT contracts, and most price variance tends to occur in the nearby contract, WEAT often underperforms the nearby contract on the upside and outperforms when the price declines.
March CBOT wheat futures rose 16.8% from $5.5625 on November 27, 2023, to $6.4950 on December 6. The price fell 11.7% to a $5.7325 low on January 15.
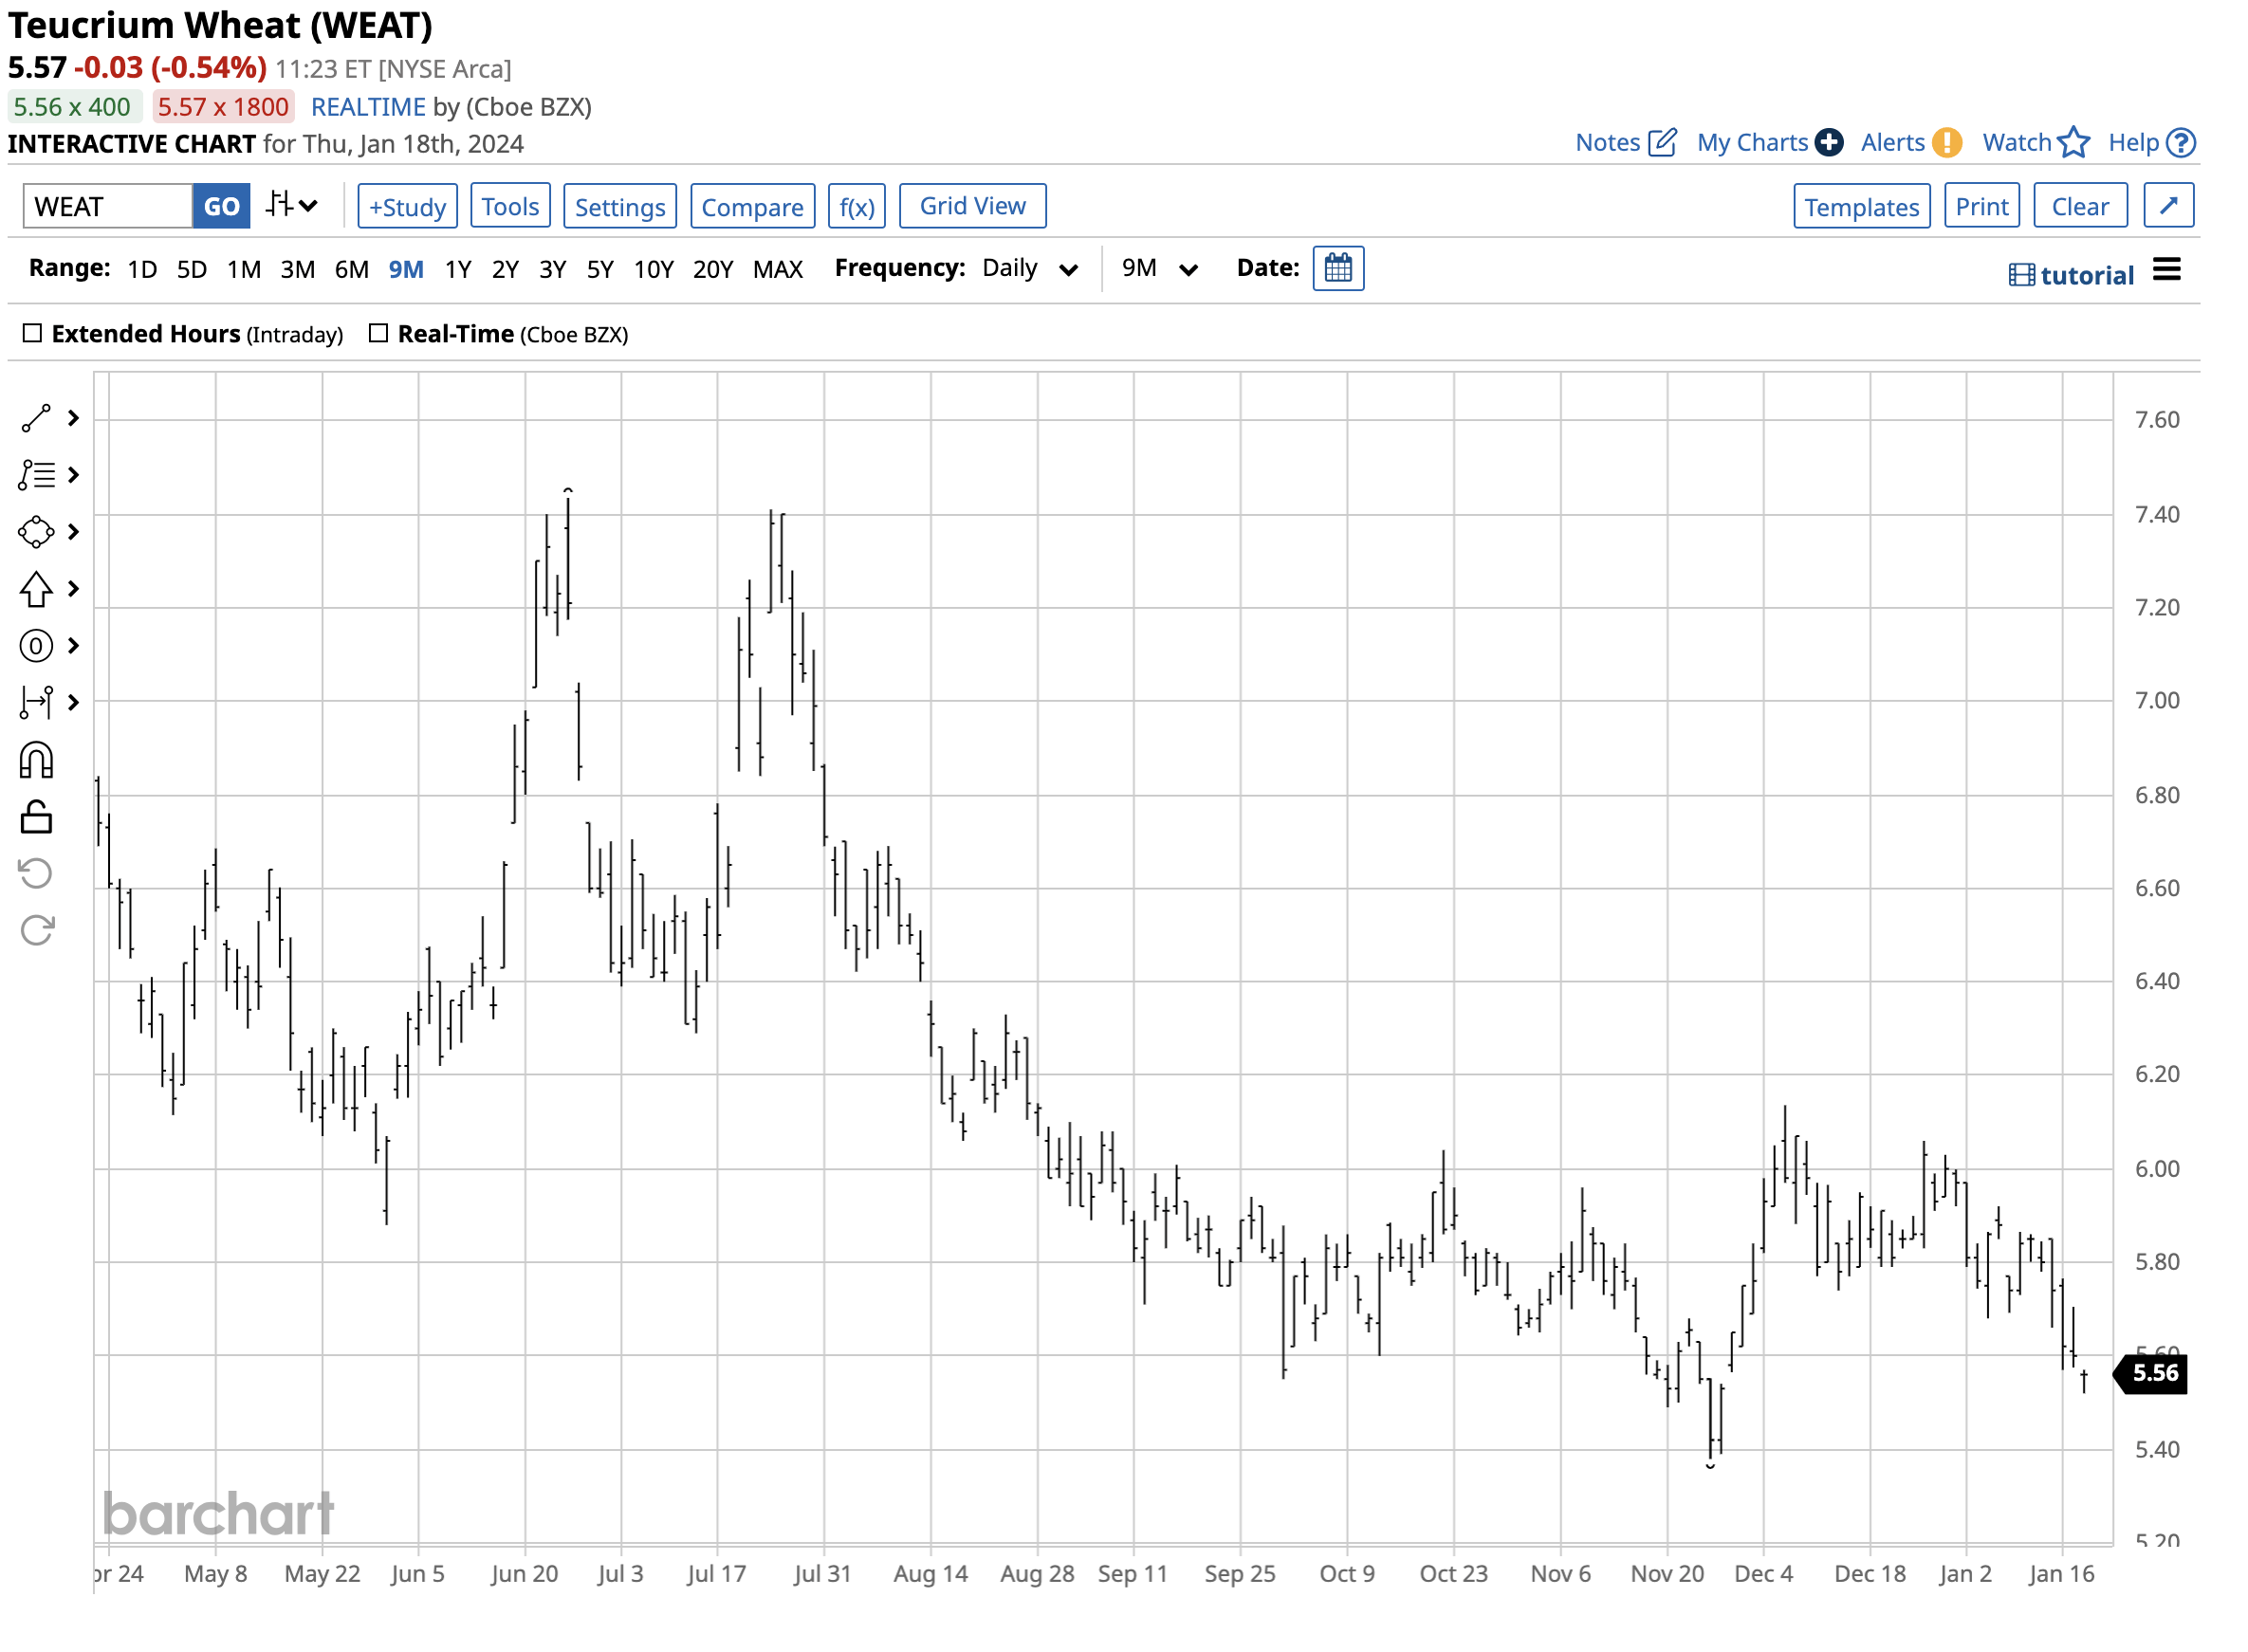
Over the same period, the WEAT ETF rose 14.1% from $5.38 to $6.14 before correcting 10.1% to $5.52 per share. WEAT underperformed on the upside and outperformed the March CBOT wheat futures contract on the downside.
Levels to watch in the continuous CBOT wheat futures market
In early 2024, with the crop year on the horizon, a break above or below technical levels could cause trend-following traders and market participants to flock to the wheat market.
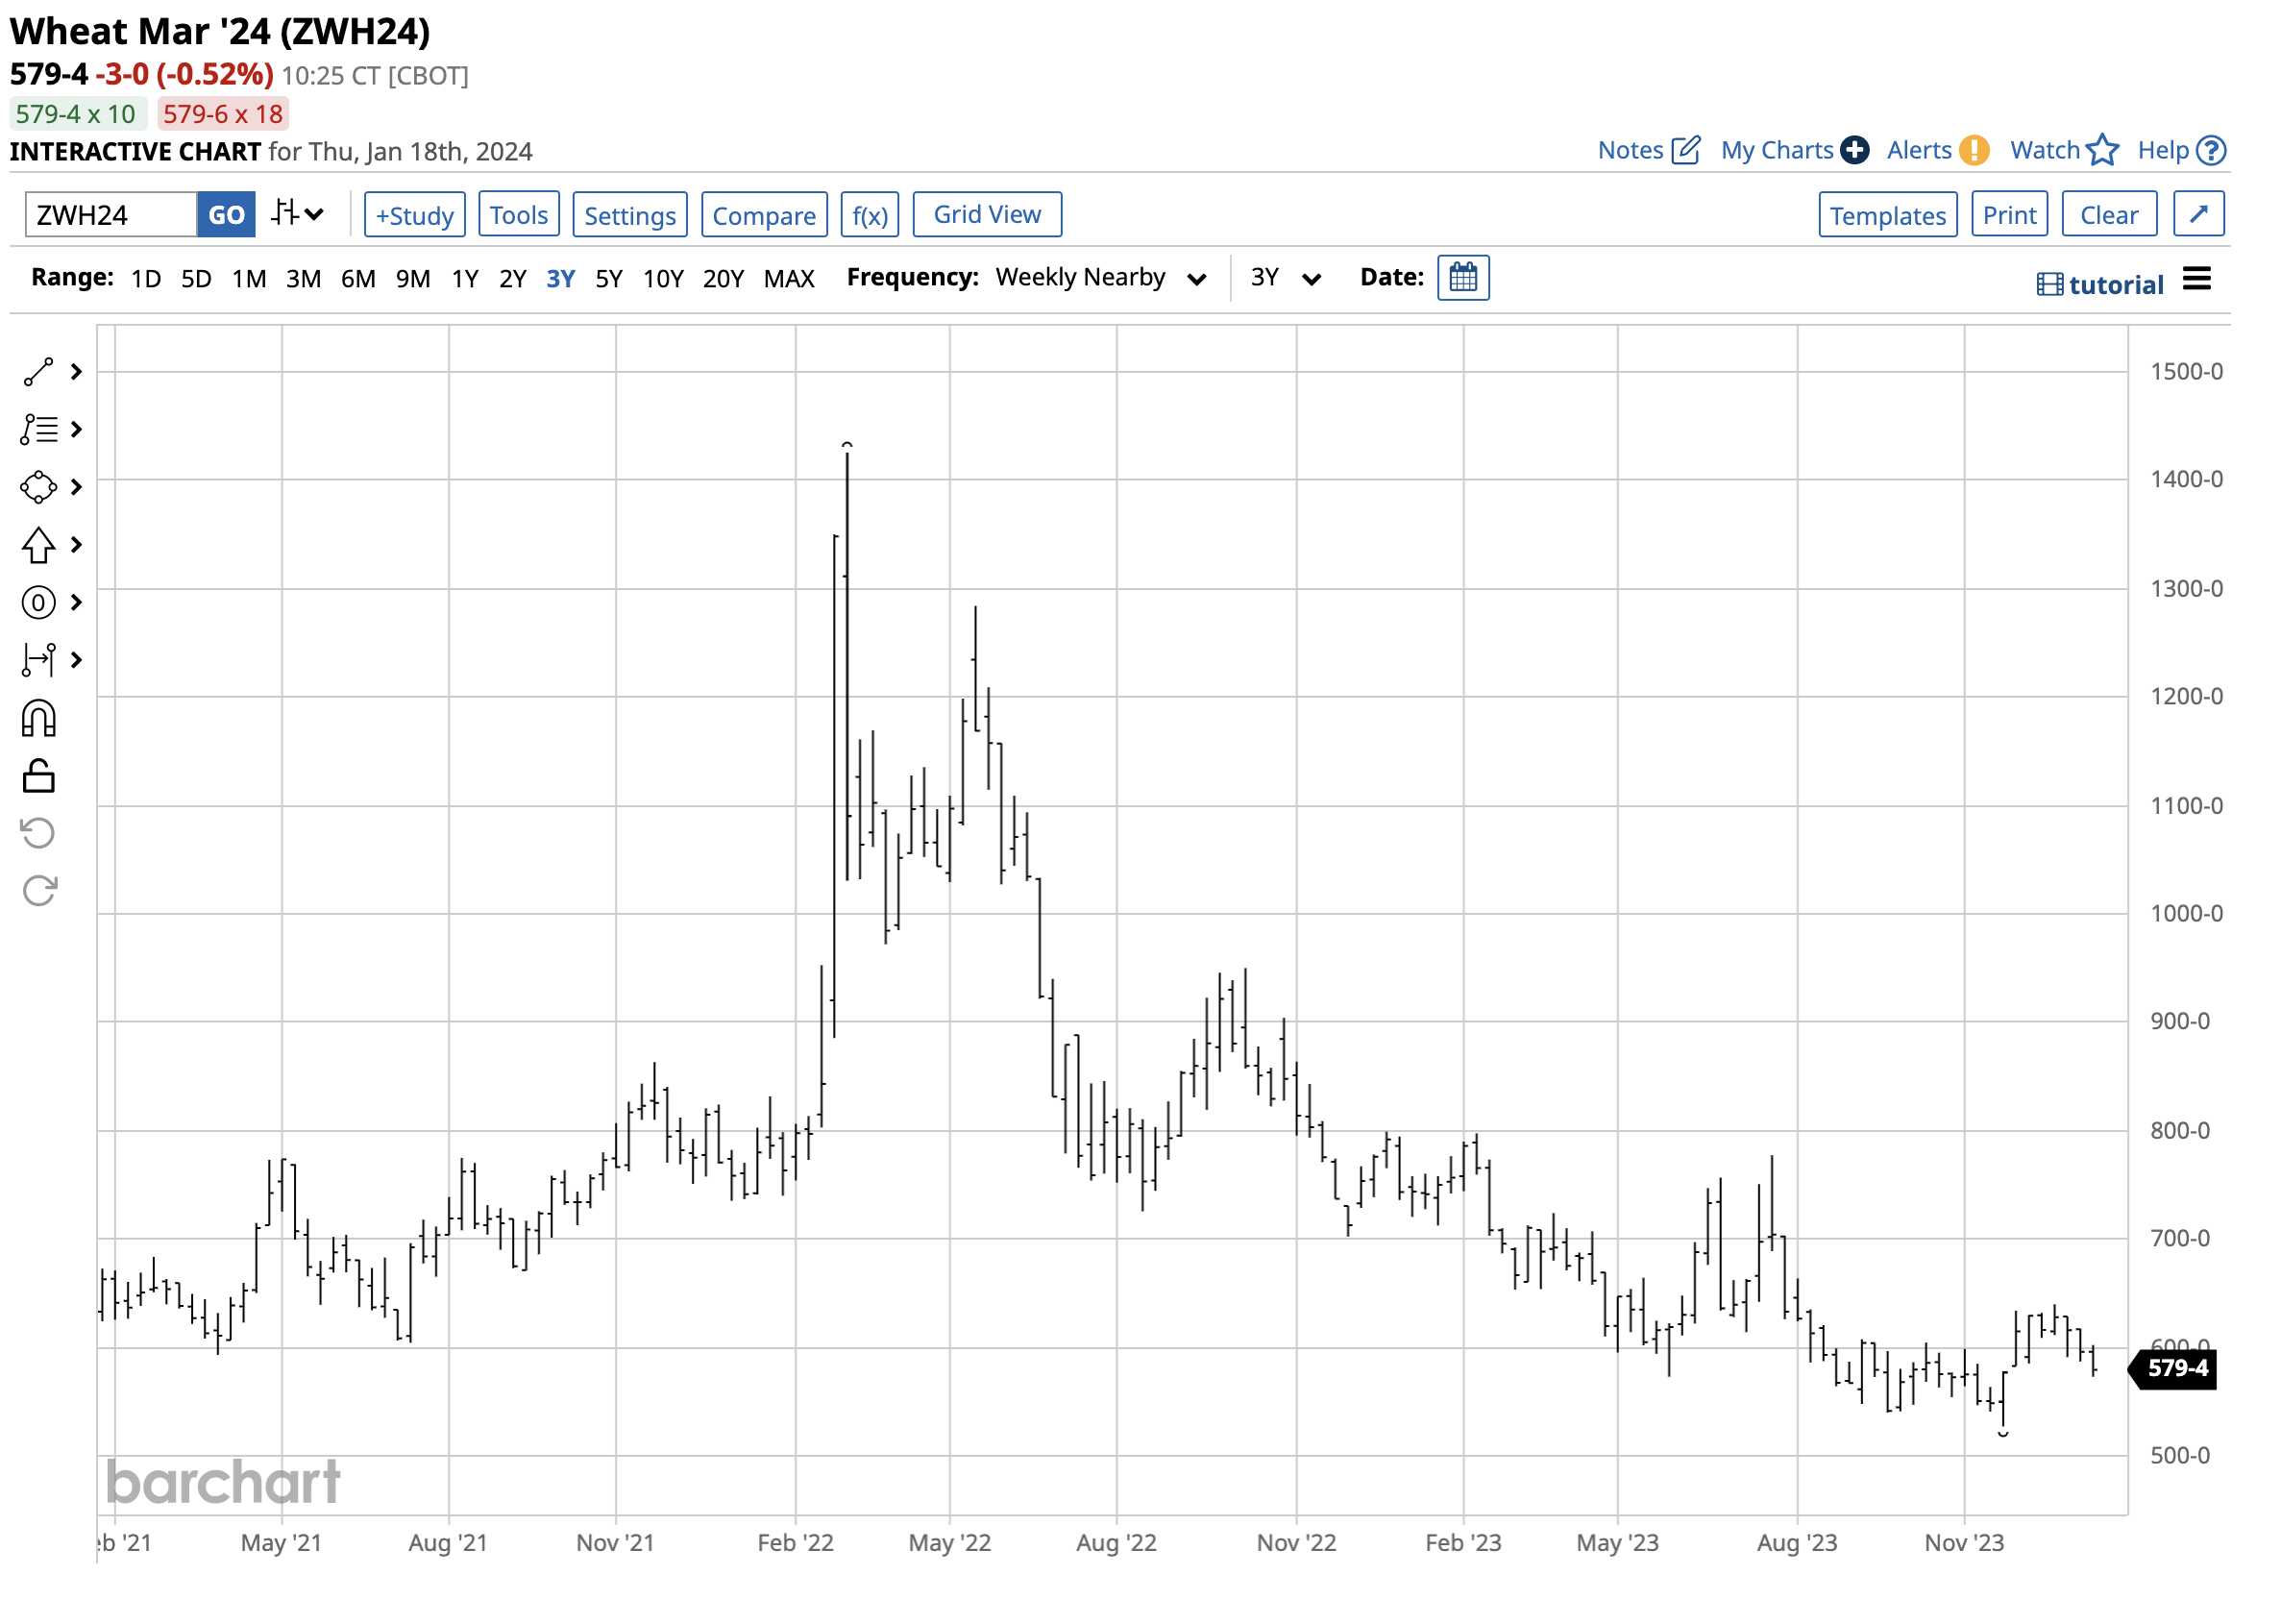
The weekly chart shows support at the November $5.2750 continuous contract low, with resistance at the late December $6.3975 high. At under $5.80 per bushel, soft red wheat for March delivery was just below the midpoint of the support and resistance levels.
Wheat is a critical agricultural product that feeds the world. At below $6 in early 2024, the many bullish factors could limit the downside potential of Teucrium Wheat ETF, and the upside could be explosive.
For further details see:
WEAT: Poor Performance In 2023 And The Prospects For 2024