QQQ - Week On Wall Street: No 'All Clear' Signal Yet
2023-04-22 04:50:44 ET
Summary
- Inflation is moving in the right direction, and that bolsters the "what could go right" argument.
- Bank lending has fallen off a cliff, increasing the "what could go wrong" commentary.
- We may not be in an "official" recession, but we are working through the middle of an "earnings" recession.
- It all comes down to how much has been priced into this market. It's too early to issue any "all clear".
Simple can be harder than complex: You have to work hard to get your thinking clean to make it simple." - Steve Jobs
Exactly two years ago the S&P was at 4128. The index closed at 4147 on Friday. In between we've experienced new market highs and a BEAR market. Many stock investors, analysts, and pundits have declared that the BEAR market is over. They cite the recent strength in Q1 results and the bond market signaling an imminent pivot in the Federal Reserve's interest rate hikes as more evidence that stocks are going to new highs. The Q1 rally has anointed the previous BULL market's winners - technology and consumer discretionary stocks - as the new "Safe" port in the storm. Those two sectors account for just about the entire move since the October low.
That adds to the NEW BULL market call. Market participants are watching the short-term rates and the Fed funds futures yield curve that implies a rapid Fed pivot toward rate cuts and that the Fed funds interest rate will be 75 to 100 basis points lower by January 2024. Investors should be advised to be careful what they wish for. If that does indeed occur it will be due to an economy that has cratered, and that isn't a positive for stocks.
There are always two sides to every story, and we should be addressing every angle. The counter-argument says the recent revival in these two beaten-down areas of the market is a simple revision to the mean. Nothing goes down forever, just like nothing goes up forever. That argument is bolstered when we ask - What has changed since last December? It is at this point that the debate begins.
A couple of weeks ago I took the liberty of posting all of the Longer-term chart trends for the major indices. There was nothing that I can call BULLISH in that presentation unless you want to "guess' that the market has bottomed. Furthermore, I simply cannot recall a time a new BULL market was declared when Energy ( XLE ), and Healthcare ( XLV ) are the only sectors in a long-term BULLISH trend. Here again, if you are guessing that stocks have bottomed then you can put your BULL horns on.
In a BULL market, we see a strong across-the-board rally where just about every index is moving in concert. Small caps are US-concentric and are more sensitive to what happens in our economy. Of all the indices, the Russell 2000 small cap index ( IWM ) ($178) has struggled the most. That rather BEARISH price action might be sending a message about the state of the economy. This is not just a "technical" story. The MACRO scene is offering plenty of uncertainty as well.
Earnings Recession And Interest Rates
The calls for a new BULL market are dismissing the fact the growth of corporate earnings is not only expected to slow but retreat. Forward earnings estimates have come down more than 15% from a year ago. Analysts expect companies in the S&P 500 to report a second consecutive decline in quarterly earnings. According to FactSet, first-quarter profits are projected to drop 6.8% from the same period a year earlier. From a corporate earnings perspective, we're already in a recession.
If we add in the new regulations that are being proposed due to the "Keystone Cops" episode played out in the California banks that will stifle loan growth it adds more stress to the earnings picture. Staying with fundamentals, anyone that was willing to pay attention to the economic data is well aware that the U.S. economy is facing increasingly strong headwinds. It's been about a year since the Federal Reserve began raising short-term interest rates. Looking back to the commentary of a year ago, hardly anyone on Wall Street or in the broader financial community was looking for the Fed funds rate to be pushed up to a target range of 4.75% to 5.00% by March 2023. But this cycle was different due to raging inflation.
The fight was on and the Fed got its key rate up to the current level throughout just nine meetings. When we combine HIGH inflation, no matter how some folks have tried to slice and spin that news, it has still represented a tremendous strain on millions of households and businesses.
The demand for new credit has been pressured as mortgages and other loans have priced some buyers out of the market. It seems foolish to believe we will absorb the fastest and most aggressive rate hiking cycle in history and come out the other side with an economy that is functioning well . We have yet to see ALL of the effects of the rate hikes.
What Might Come Next
The Commercial real estate sector is facing headwinds from a shift to hybrid/remote work. It's now deemed "normal" for workers to "declare" they no longer want to head back to the office. Somehow political correctness has entered the scene here as well and once again there are negatives associated with it. From New York City to Chicago and elsewhere U.S. Office vacancy rates are at all-time highs. Add in the HIGH crime rates in many major cities across the nation and once again, "policy" rears its ugly head.
Unfortunately, this area of the real estate sector has to refinance about 50% of its mortgage debt in the next two years, and it will be refinanced at higher rates. The economic data have been taking something of a "turn" in recent weeks. Employment is a lagging economic indicator. There is a strong contingent that bases their entire soft landing scenario on this one indicator. The claim is that high inflation and rate hikes have hardly slowed the economy, leaving the stock market protected from the problems that come with slower demand for goods and services.
However, the other side of the story says this is the final shoe to drop, and there are already cracks that appear in the employment argument. Now we hear the cheerleaders claim that a slowing economy is bullish for stocks as it would steer the Fed away from tightening. Ladies and Gentlemen that is ABSURDITY taken to its highest levels. The more probable scenario is a Fed that gets to a Fed Funds rate of around 5%-5.25% (potentially higher) and stays there for a while the economy slows to a crawl. If corporate earnings follow the economy's path, that is hardly a positive backdrop for stocks.
Inflation
In the short term, it's still about the next CPI, PPI, and PCE reports. We already know inflation has peaked, and it is slowly cooling off. Unless it rears up again, that part of this BEAR market story is history. So the commentary that is most popular now is:
The Fed will start to cut rates this year and with rates coming down it's back to the good times in the stock market."
I'm not convinced that this Fed is going to allow inflation to come back anytime soon. I do NOT believe they will be declaring an "early" victory over inflation. It's why I see the probability of interest rates heading lower as VERY LOW.
The caveat-- UNLESS there is an unexpected economic shock, and I wouldn't call a recession an unexpected market shock. In my opinion, we will need the economy to fall off a cliff for the Fed to pivot and cut rates.
Strategy Session
During the early stages of the last BULL market, my strategy was repeatedly questioned and I was labeled a Perma BULL. It was then that I shared my strategy for any long-term investor.
Optimism" MUST be the "default" setting to build wealth over time."
There is no change to that underlying philosophy. However, market participants have to also deal with potholes and roadblocks along the way, in what is known as reality. A reality where "resets" occur that correct periods of excess. We've experienced that in this BEAR market. The investment setting has changed from the excess caused by low interest rates and easy money to more normalized rates and less liquidity.
There is a lot of negativity around now and rightfully so. That leaves little doubt that this is a poor MACRO scene. We've rightfully identified the BEAR market trend and acknowledged what "could go wrong" as both the technical and fundamentals have aligned perfectly (negatively). Along with that, I've advised "defense" and caution for what is now about one full year.
In the here and now, investors are starting to focus on what "could go right". The equity market needs economic Goldilocks, a bit of slowing to continue to cool inflation expectations, but not too much to spark a "hard landing".
Trust me, I've been in the markets for a LONG time and I also realize the equity market can often march to its tune. We've seen these periods play out in what we now know are BEAR market rallies. There is NOTHING NEW here. With so much negativity already built in there exists a possibility the stock market is in the process of putting together a recovery rally. I've left the door open for a potential rally to S&P 4200-4300 since the start of January. That first rally failed at S&P 4182 and now we are witnessing another attempt to move higher.
I can now envision a scenario that will resemble the 2015-2016 time frame. A period where stocks were concerned about the global economy and reacted to every headline (sound familiar?). That could usher in more false starts and stops that I believe will keep investors confused. From a MACRO perspective, the probability that this present BEAR market cycle has wrung out years of excess is LOW. So I'm prepared to see plenty of false starts before we see a rally to put an end to the ongoing bear cycle, however, I don't see the pieces in place for such a scenario to unfold today.
I draw that conclusion predominantly from a "technical" point of view. As the opening picture suggests many doors lead to many different results. Steve Jobs' quote is also applicable now. "Simple" can oftentimes be harder, but we have to do our best to keep our strategy simple and avoid getting swayed by the market swings.
The situation can surely change. But until it does the calls for a NEW BULL market are very premature.
The Week On Wall Street
Investors witnessed narrow trading ranges and modest gains for the indices in the first three trading days of the week. Thursday's price action took the indices lower to verify what appears to be an official pause in the recent rally.
Stocks put in another quiet performance on Friday, to cap off a flat week, in what is also a flat month. All of the major indices posted modest losses for the week, and the four-week winning streak for the DJIA was broken.
The Fed
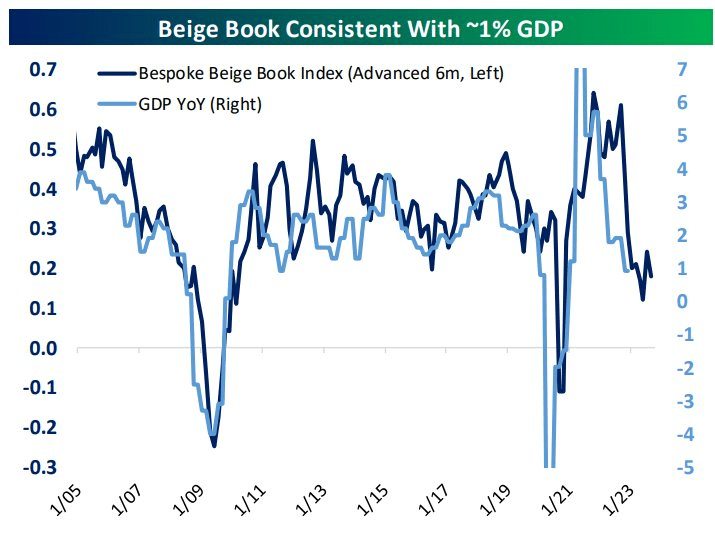
The Fed's Beige Book summary of qualitative economic conditions around the country was released yesterday and showed some weakness in key areas. That took some of the shine off the spike we saw in March.
April's results are now more in line with ~1% GDP growth.
Now we are about two weeks away from the next FOMC meeting. I have been looking for the Fed to raise rates again on May 3rd. Most of the investment community was leaning the other way during much of March and earlier this month. As evidence has mounted that inflation is still relatively high and that Powell and other Fed leaders are still worried about inflation, the pendulum has swung in the other direction.
The new week has brought a turn in sentiment regarding the May 2-3 FOMC meeting. The Fed funds futures are now pricing in an 86 percent chance that the Fed will hike rates by 25 basis points at that gathering. A month ago, the futures were placing the odds at only 21 percent. Both the inflation data and the numbers on the broader economy have remained on their established flight paths. Inflationary pressures are subsiding - but they remain well above the average levels of recent decades and also the downside target near 2% that U.S. central bankers have in mind for the next few years. The economy has been showing increasing signs of stress from higher rates.
The Economy
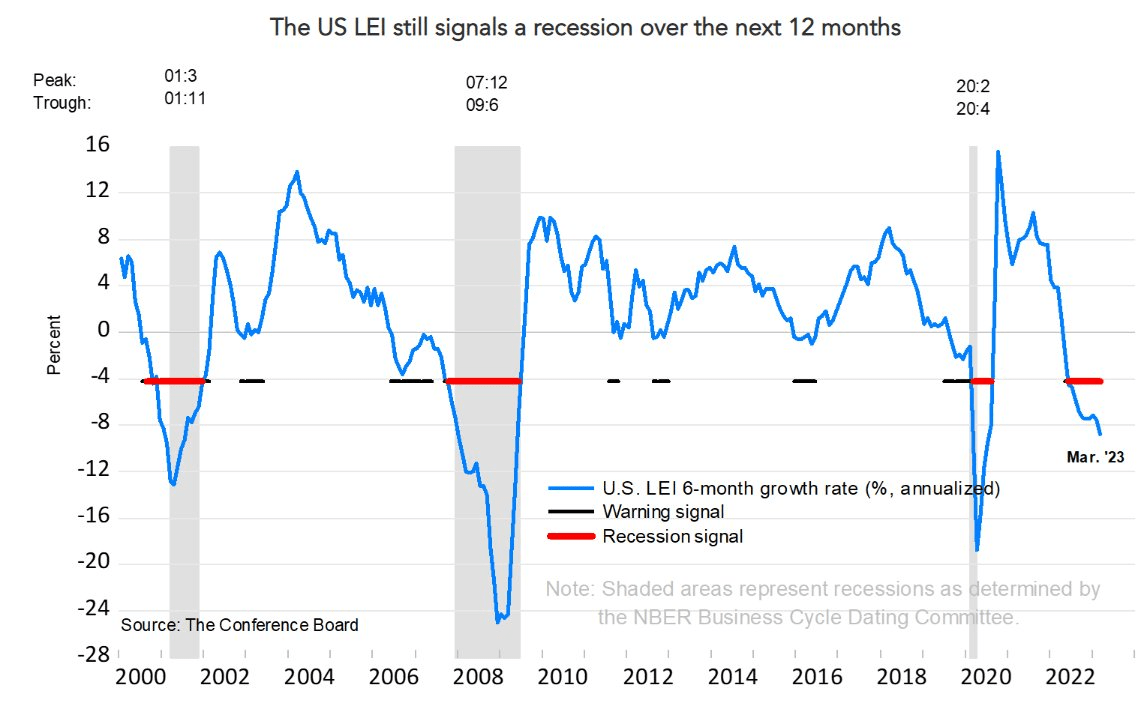
The Conference Board's leading indicator plunged 1.2% to 108.4 in March, well below expectations, after the 0.5% decline to 109.7 in February. The index has been in decline since April and has not posted an increase since February 2022.
LEI (www.conference-board.org/topics/us-leading-indicators)
Today's drop is the largest since the 5.6% from April 2020 and the index ties November 2020 for the lowest since October 2020. Seven of the 10 components were negative.
Manufacturing
Mixed data for manufacturing this week . New York is UP, and Philadelphia is DOWN.
The Empire State Manufacturing index surged 35.4 points to 10.8 in April, much higher than forecast after dropping 18.8 points to -24.6 in March. This breaks a string of four consecutive months in contraction.
NY Fed (www.newyorkfed.org/survey/empire/empiresurvey_overview.html)
It is the highest print since July. Strength was broad-based. Nearly all of the components increased with almost all in positive territory after nearly every metric was in negative territory in March.
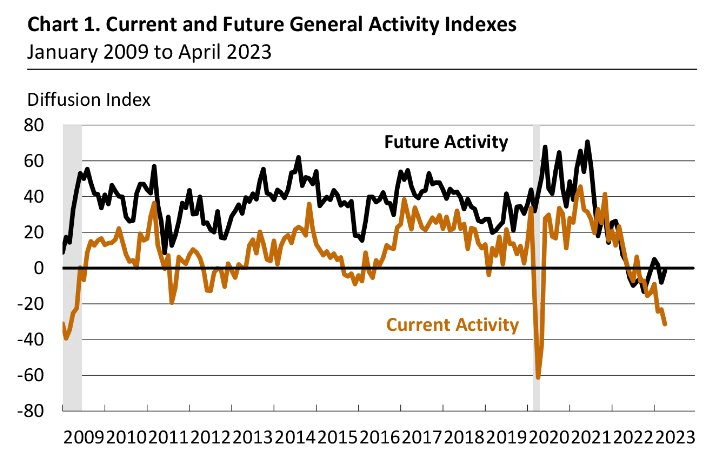
The Philly Fed Manufacturing index declined 8.1 points to -31.3 in April, much weaker than forecast, after inching up 1.1 tick to -23.2 in March. The index has been in contraction since September and in ten of the last eleven months.
This print is the weakest since May 2020 and was at 13.1 last April. Many of the components improved but most remained in negative territory.
Housing
Weaker Data reported this week.
Homebuilder sentiment from the National Association of Home Builders was released yesterday. As expected, the headline index rose from 44 in March to 45. Of the sub-indices, increases in both present and future sales drove the headline reading higher. While those readings remain relatively muted versus most of the past decade, it reiterates the modest improvement in sentiment we have seen this year.
NAHB
The streak of monthly increases stretches to four. Before we break out the champagne note how far the index remains below the pre-pandemic levels.
Housing starts declined 0.8% to 1.42 million in March, weaker than forecast. This follows February's 7.3% pop to 1.43 million. Strength was in single-family starts which rose 2.7% to 0.86 million. Building permits dropped 8.8% to 1.41 million in March after surging 15.8% to 1.55 million in February.
Housing (Bespoke Premium)
On a 12-month average basis, they have declined for ten straight months, which is a streak of declines that has often been associated with recessions.
Existing home sales fell 2.4% to 4.44 million in March after bouncing 13.8% to 4.55 million in February. The February jump broke a string of twelve straight monthly declines. Weakness was in single-family sales which slid 2.7% to 3.99 million. The month's supply of homes was steady at 2.6 for the second month in a row, down from 2.9 in December and January. The median sales price rose to $375,700 after increasing to $363,600 in February and compares to the historic peak of $413,800 in June 2022.
The week ended with a positive PMI report, and that keeps everyone guessing about the strength/weakness of the US economy.
US PMI Composite Output Index at 53.5 (March: 52.3). 11-month high.
Services Business Activity Index at 53.7 (March: 52.6). 12-month high.
Manufacturing Output Index at 52.8 (March: 50.2). 11-month high.
Manufacturing PMI at 50.4 (March: 49.2). 6-month high.
The Global Scene
China's GDP rose at the fastest pace in over a year coming in at 4.5% for Q1. Retail sales jumped 10.6% in March as online sales of physical goods picked up. Industrial output rose 3.9%, slightly lower than Reuters' forecasts of 4%.
All positives for the global economy, and help to keep the price of oil stable.
The U.K.
PMI Composite Output Index at 53.9 (Mar: 52.2). 12-month high.
Services PMI Business Activity Index at 54.9 (Mar: 52.9). 12-month high.
Manufacturing Output Index at 48.5 (Mar: 49.0). 3-month low.
Manufacturing PMI(4) at 46.6 (Mar: 47.9). 4-month low.
Japan
Composite Output Index, April: 52.5 (March Final: 52.9)
Services Business Activity Index, April: 54.9 (March Final: 55.0)
Manufacturing Output Index, April: 47.5 (March Final: 48.4)
Earnings
Food For Thought
Recession
Just weeks ago the major newspapers and even Fed Chairman Powell were talking about how strong state tax revenues were, which provides a buffer to the US economy. This was despite all of the leading indicators of state tax revenues pointing to a sharp slowdown. The narrative is finally beginning to shift as we move into the budget season and revenue estimates are being updated to reflect slower nominal GDP, wealth, and corporate profits.
The estimates for next fiscal year, starting July 1st, are coming down and the blame game is beginning. It's VERY simple. States that increased spending permanently with temporary revenue are struggling the most.
California is already looking at a recession.
California tax revenues fell 42 % in March and finished 1Q down 38% compared to 1Q of 2022. When we look at how revenues grew to new highs in '21, this level of decline is enormous. California revenue is at a 16-Month Low. Corporate tax revenues in California are telling us where the profit recession is starting. Corporate tax revenues are down 80% in March on top of February's 50% decline.
The state is leading the way on the downside of this cycle and the speculative parts of the economy are leading the declines. Thankfully, not all states are on the same path as Texas revenues are at an all-time high.
Nationally, corporate tax revenues remain near all-time highs and have not been in free fall like California's. This is consistent with the growth rate of corporate profits decelerating in 2022, but will likely turn to year-over-year declines in 2023.
The "buffer" that many economists and the Fed believe would help support the general economy is likely going to fade away. Time and time again it has been shown that you can't tax and spend your way to prosperity. When it comes to the economy nothing ever changes. It always comes down to Private enterprise - Corporate America that will have to remain resilient so the economy can survive the issues that have been tossed at it in the last 2 years. That is going to be a challenge due to the present mindset that isn't supportive of big business.
Pushback on the EV Mandates.
The EU is starting to reject EV mania . Italy started with EV mandates that led to auto industry job cuts , and that pushback has started to gain momentum. At the very least it has caused some to rethink their ambitious goals as the realization that there will not be enough EV charging stations or battery-making plants to satisfy demand in such a short timeframe has set in.
The still-fledgling industry remains entrenched with performance and safety concerns - as well as concerns over the environmental and societal damage done by the mining of critical metals used in EV batteries.
The irony of it all. There is little evidence that the use of EVs is going to bring down carbon emissions one iota. However, unless the pushback slows down the associated costs and unintended consequences of this faulty plan, this transition will be negative for the global economy for years.
The Daily chart of the S&P 500 ( SPY )
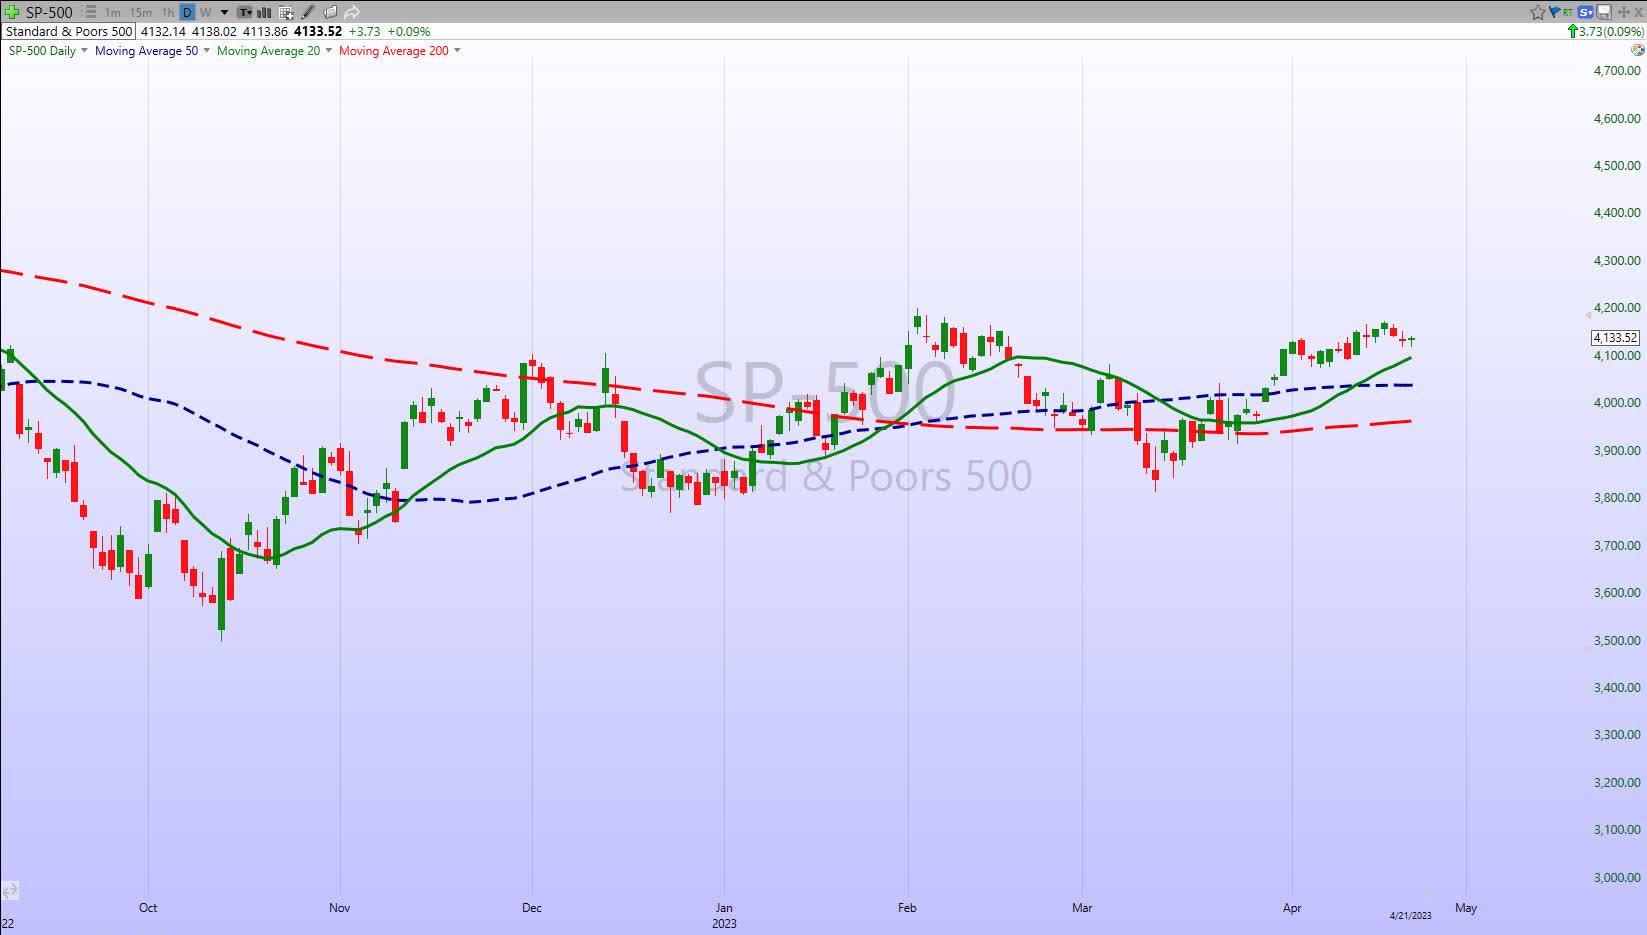
This week can best be described by using the word "flatline". The S&P 500 started the week at 4137 and closed Friday afternoon at 4133.
The recent weakness in the S&P this week is nothing to get excited about as the index is riding along the very short term trading line. And that continues to trend higher. A pause at resistance is also to be expected.
We'll need to see what direction the S&P takes in the early trading next week, and perhaps we can get a clue as to what comes next.
Investment Backdrop
When you watch the markets closely every day for many years, you start to develop a sense of intuition. It does not always rise to the surface (and it's not always correct), but occasionally we all will get feelings about what is going to happen in the markets. In my case, it is a result of the charts and data that are constantly being processed.
A couple of weeks ago I mentioned that my biggest takeaway from the market action was that stocks were hanging in there relatively well considering all of the issues they had to absorb. Given the market's inability to lift off strongly since October, sticky inflation, the Fed continuing to hike rates, and a banking crisis thrown in for good measure, it seemed conditions were ripe for some sort of significant downside price action. Instead, the indices stopped going down around March 13 and while they weren't rallying, they weren't falling apart either.
The short-term takeaway; Stocks were probably going to trade higher and if the S&P gets back above the recent February reaction highs (not there yet), it could kick off some short covering to push stocks even higher. Admittedly, I did not have a firm enough conviction to start making large 'bets' on that outcome, yet here we are and it looks as if the price action has played out by my "instincts".
This glass-half-full mindset can keep the market drifting higher, but at S&P 4100+, investors are going to ask themselves the question if the risk/reward is worth it. The onus is on the BULLS to prove they can take the S&P 500 above 4300 AND keep it there before I start to believe that there may be some more significant upside in play. With major resistance levels just ahead, I don't have enough evidence for me to advise gearing up, urging everyone to "play hard" and "go for it." And in light of the potential issues that have been discussed ad nauseam in the weekly updates, there are far too many downside risks with the potential to rock the proverbial boat.
Hence I remain generally cautious while taking my shots with stocks that are in bull trends that are breaking to the upside. In other words it's about stocks showing strength and momentum to put the odds in your favor.
Small Caps
The Russell 2000 continues to meander along in the middle of its trading range. Unlike the S&P and the DJIA, the index is nowhere near its February highs. Unless there is a change in sentiment toward this group, it appears that the last high was another in a series of lower highs since the November '21 peak. A clear and defined BEAR market trend that will continue to face headwinds in a slowing economy. In addition to all of the other issues plaguing corporate America, the small caps are typically in need of capital. That next round of financing is going to come at a higher cost.
Sectors
Energy
Just when it appeared the Energy sector ETF ( XLE ) was ready to roll off a cliff, support held, and the rally off the lows (14%) has been strong. This past week the sector gave back (-2%) some of those gains. Energy BULLS would now like to see the XLE take out the February highs and eventually challenge the all-time high. At no point in the March decline did the ETF violate its long-term trends, and it is why it is best not to leave a positive direction too soon. Energy stocks should remain in an overweight position in portfolios.
Financials
The noise surrounding the banking crisis of last month has quieted down for now, but the chart of the SPDR S&P Regional Banking ETF ( KRE ) still looks pretty crummy. If I had to place a bet, I'd say it looks like we're at least going to get to test the $41 level and maybe set a quick lower low to try to shake out a lot of the retail money betting on a bottom.
In the interim, there is the chance for bottom pickers to set up a trade using a level just below the recent low of $41 as a Mental STOP. The fact that the overall stock market has held in there as well as it has throughout all of this still surprises me. A lower low in KRE would be another test of that, however.
The large center money banks started the earnings season off on a positive note, providing a nice bounce for the Financials ETF ( XLF ). However that rally left the ETF at resistance, and as noted to my subscribers on Thursday;
It's a LOW probability that we get any sustained advance from the sector."
The XLF gave back a little more on Friday.
Homebuilders
We've seen the latest data on Housing starts reported this week. On a 12-month average basis, they have declined for ten straight months , which is a streak of declines that has often been associated with recessions.
Housing (Bespoke Premium)
The divergence between the housing stocks and the fundamental data is remarkable. While the housing data is nothing to write home about, Lennar ( LEN ), Pulte Home ( PHM ), Toll Brothers ( TOL ), and a host of others put in fresh new 52-week highs this week. The data says recession, but the stocks are saying recovery is in the wind. The stock market is always looking ahead, so here is a case where we shouldn't dismiss this message, but it keeps the confusion index HIGH.
Admittedly, I have missed this resurgence in the Housing stocks.
Commodities
It's been a rough year for Commodity Bulls. The iShares S&P GSCI Commodity Indexed Trust ( GSG ) has spent much of 2022 just drifting lower, with many false dawns along the way. However, to a lesser extent, the surge in momentum lately in commodities like Gold, Silver, Oil, and even Natural Gas looks like it could be genuine.
The fact that the explosion higher has come after GSG broke down to new reaction lows below such obvious support in March makes me even more confident since that is typically how situations have played out lately. I like to see shakeout action like that, followed by a surge in buying.
That keeps me interested and Bullish on Commodities even as most of the market has once again ignored them. GSG is in a Long term BULL trend. Another Commodity tracking ETF ( DBC ) and the Metals and Mining ETF ( XME ) are both in BULL trends as well.
Investors should also take note of the "soft" commodities. It's not just the major markets like Oil, Gold, Silver, and other Metals that everyone is familiar with. The Invesco DB Agriculture Fund ( DBA ) looks to be breaking out of a multi-month base with strong momentum.
Maybe it's just another cruel fakeout but given the strength across the commodity spectrum, I think we have to take it seriously until provided with evidence of a failure. DBA is in a Long Term BULL trend as well.
Healthcare
Healthcare ( XLV ) has rallied 8.8% in 5 weeks before weakening a bit this week. However, the rally was enough to put the sector back above the long-term trendlines. During the Q1 selloff, I mentioned it would be unwise to abandon this group. Their products and services will be in demand whether the economy slows or remains resilient.
Biotech
Admittedly I was ready to abandon my position in the group (XBI) in March, and only for a distraction or two, I wound up doing nothing. Sometimes dumb luck works well, and in this case, the Biotechs found support and have rallied to resistance. I don't expect a whole lot more from the group, but this bounce was a welcome relief. We could easily see some weakness now, but I suspect XBI will settle into an expanded trading range. I'll continue to HOLD.
Gold
In past updates to members of my service, I've shared the longer-term chart of Gold, pointing out the potential for a significant pattern developing in the precious metal. The action over the past several years has at least the rough look of a cup and handle-type pattern. It's not perfect but the general "shape" fits. If this is the case and Gold moves to complete this pattern, it could suggest a substantial upside for the metal in the months to years ahead.
In the near term, it looked as if the possible double top made in 2020 and 2022 (represented by the $193 level) negated the bigger picture setup, but the rally over the past few months has once again put it back on my radar. The strength in the metals looks to be real to me. The first step for Gold will be to break out to new highs above that 2020-2022 "double top." Should that occur, it might be off to the races. Of course, there is always a flip side. We get another failure at the $193 level for ( GLD ), and it is back into the trading range.
Silver
The Silver ETF ( SLV ) has broken out above its '22-'23 high. Admittedly my sale of half of my position now looks to be premature, but that was a case of wanting to harvest a quick double-digit percentage gain. As this breakout continues to play out I'll be looking for a pullback to or near the breakout point (where I sold). If that new support holds, it will be a good time to add to catch a further run.
Uranium
The ETF ( URA ) has come to life in this recent market rally. I was able to add near the lows of the trading range, as part of my long-term plan to build a position in the metal. This is a situation where I don't see a rocket launch type of move, but more of a wide trading range for the near term.
Technology
The Tech ETF ( XLK ) is showing a historic divergence between Price and Breadth. New recovery highs in price are accompanied by a very poor showing in the Advance/Decline line.
Technology (Bespoke Premium)
Given the Tech sector has managed to perform well on unimpressive breadth, it would imply mega caps are buoying the market cap-weighted index. Indicating fewer stocks are participating in the rally. While this can continue for a while, if there is no appreciable improvement in participation, it's a "warning" sign that shouldn't be ignored.
Semiconductors Sub-Sector
The semiconductor ETF ( SOXX ) is still in the uptrend that started in October. As mentioned in the opening remarks it seems to be slowing. that is not so unusual after the 22% gain to start the year. The semis ignited and led the tech rally, so it is an important key to what comes next for not only tech but the general market.
Some "giveback" would not be out of the question and that is what has occurred over the last three weeks. The ETF is down 6% since the March 31 High.
Final Thoughts
The grind continues. There are a few warning signs in the "technicals" that are beginning to pop up, but nothing that says this market is about to fold. The market feels "tired" and perhaps complacent, given that the VIX keeps drifting lower. Given all of the issues, it has likely required quite a bit of buying power just to keep stocks at these levels, so perhaps the bulls are in need of a rest.
In the long run, the stock market is all about the fundamentals. But often, in the short/intermediate term, it is about fear, hope, and greed only loosely connected to the business cycle. That is precisely where we are today.
What I have been prescribing lately is for investors not to get too BULLISH on rallies, and don't get too BEARISH on declines. Until shown otherwise this market is in a trading range and the best stance to employ is one of the most difficult to pull off - NEUTRAL.
The best way to approach that is to stay with what is working. Momentum stocks and those that are in established BULL trends. They continue to be the best 'BET", and increase any investor's chance for success in this BEAR market. This week's price action shows key indices are "coiling" and is anybody's guess as to thick ay they break,
THANKS to all of the readers that contribute to this forum to make these articles a better experience for everyone.
Best of Luck to Everyone!
For further details see:
Week On Wall Street: No 'All Clear' Signal Yet