XHB - Weekly Economic Data Summary
2023-06-26 09:32:06 ET
Summary
- Builder confidence in single-family homes increased from 50 in May to 55 in June, marking the first positive sentiment since July 2022.
- US housing starts jumped from a 1.417 million seasonally-adjusted annual rate in April to 1.631 million in May, the largest sequential increase since October 2016.
- Median existing home prices were $396,100, down 3.2% from the prior year ($408,600).
Last week's economic data continued to skew positive for equities, with homebuilder confidence improving significantly in May, as well as housing starts. Were starts delayed by the banking crisis or did homebuilders turn the corner, as their equity prices suggest?
Weekly Economic Data Scorecard
Below is our ‘Economic Data Scorecard’ – highlighting the past week’s most positive and negative datapoints from the perspective of equity markets.
Positive for Equities
- Builder confidence (single-family homes) increased from 50 in May to 55 in June
- This was the sixth straight increase and the first time sentiment has turned positive (>50) since July
- Privately-owned U.S. housing starts jumped from a 1.417 mln seasonally-adjusted annual rate in April to 1.631 mln in May
- May brought the largest sequential increase in housing starts since October, 2016
- Existing home sales increased 0.2% sequentially in May, to a seasonally-adjusted 4.30 mln annual rate
Negative for Equities
- Median existing home prices were $396,100, down 3.2% from the prior year ($408,600)
- The U.S. Global Flash Composite PMI fell from 54.3 in May to 53.0 in June
- The Manufacturing Output Index fell sharply (from 51.0 in May to 46.9 in June)
Economic Data of Interest
Monday, June 19 – NAHB Builder Confidence, June
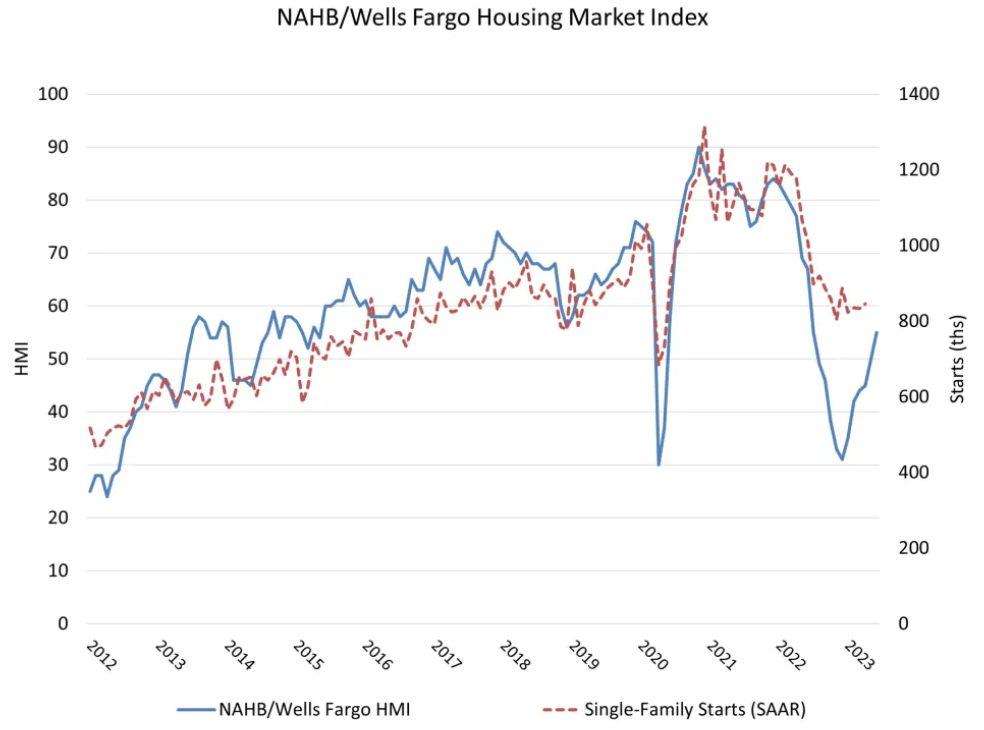
Builder confidence (single-family homes) increased from 50 in May to 55 in June, the sixth straight increase and the first time sentiment has turned positive (>50) since July, 2022. Historically there is a reasonable relationship between builder sentiment and housing starts, suggesting housing starts may increase in the second half of the year.
The following chart shows the ten year relationship between Builder Confidence and housing starts:
An uptick in homebuilder confidence (NAHB Housing Economics Update)
Tuesday, June 20 – U.S. Census Monthly New Residential Construction, May
Privately-owned U.S. housing starts jumped from a 1.417 mln seasonally-adjusted annual rate in April to 1.631 mln in May, the largest sequential increase since October, 2016. It was also noteworthy that May housing starts were above the prior year level (1.543 mln) for the first time since April, 2022. Curiously, the vast majority of the 291,000 sequential increase came from the South (+153,000) and the Midwest (+113,000). We also speculate housing starts may have shifted out of March and April and into May due to the banking crisis: Over the three month period (March, April, May) starts averaged 1.450 mln – basically inline with February (1.436 mln).
Housing permits increased only moderately – from a 1.417 mln annual rate in April to a 1.491 mln annual rate in May (+5.22%) – a more believable rate (than starts) given homebuilder sentiment is improving but far from buoyant.
Thursday, June 22 – National Association of Realtors Existing-Home Sales, May
Existing home sales increased 0.2% sequentially in May, to a seasonally-adjusted 4.30 mln annual rate – down 20.4% from the prior year (5.40 mln). Single-family home sales fell 0.3% sequentially (to 3.86 mln) and 20.0% from the prior year.
Total Housing Inventory at the end of May was 1.08 mln units, up 3.8% from April - but down 6.1% from May, 2022 (1.15 mln units). Unsold inventory sits at a 3-month supply at the current sales pace, up from 2.9 months in April and 2.6 months in May 2022.
Median existing home prices were $396,100, down 3.2% from the prior year ($408,600).
According to the press release:
"Available inventory strongly impacts home sales, too. Newly constructed homes are selling at a pace reminiscent of pre-pandemic times because of abundant inventory in that sector. However, existing-home sales activity is down sizably due to the current supply being roughly half the level of 2019."
Friday, June 23 – S&P Global Flash US Composite PMI, June
The U.S. Global Flash Composite PMI fell from 54.3 in May to 53.0 in June as the Manufacturing Output Index fell sharply (from 51.0 to 46.9). Manufacturers also reported a sharp drop in new orders at the same time cost inflation intensified. According to the report, “Despite a sharper rise in cost burdens, US firms raised their selling prices at the slowest pace since October 2020.”
Output continued to expand for both manufacturers and service companies, but manufacturing orders contracted and thus manufacturing backlogs declined.
The following chart shows the evolution of the S&P Global Composite Output Index since 2008:
S&P Global
Fed Speak
No significant speeches from Fed officials last week.
For further details see:
Weekly Economic Data Summary