TBT - Weekly Forecast Feb. 9 2024: 23 Trading Days From A Record Negative Treasury Spread Streak
2024-02-12 07:04:15 ET
Summary
- The Treasury curve moved up 12 basis points at 2 years and moved up 14 basis points at 10 years over the last week.
- As a result, the current negative 2-year/10-year Treasury spread narrowed to negative 31 basis points this week compared to negative 33 basis points a week earlier.
- The probability that the 2-year/10-year Treasury spread is still negative in the 13 weeks ending August 2, 2024 is 58.4%, compared to 59.1% last week.
- The long-term peak in 1-month forward Treasuries is now 5.27%, up 0.14% from last week but still below the near-term peak at 5.47%.
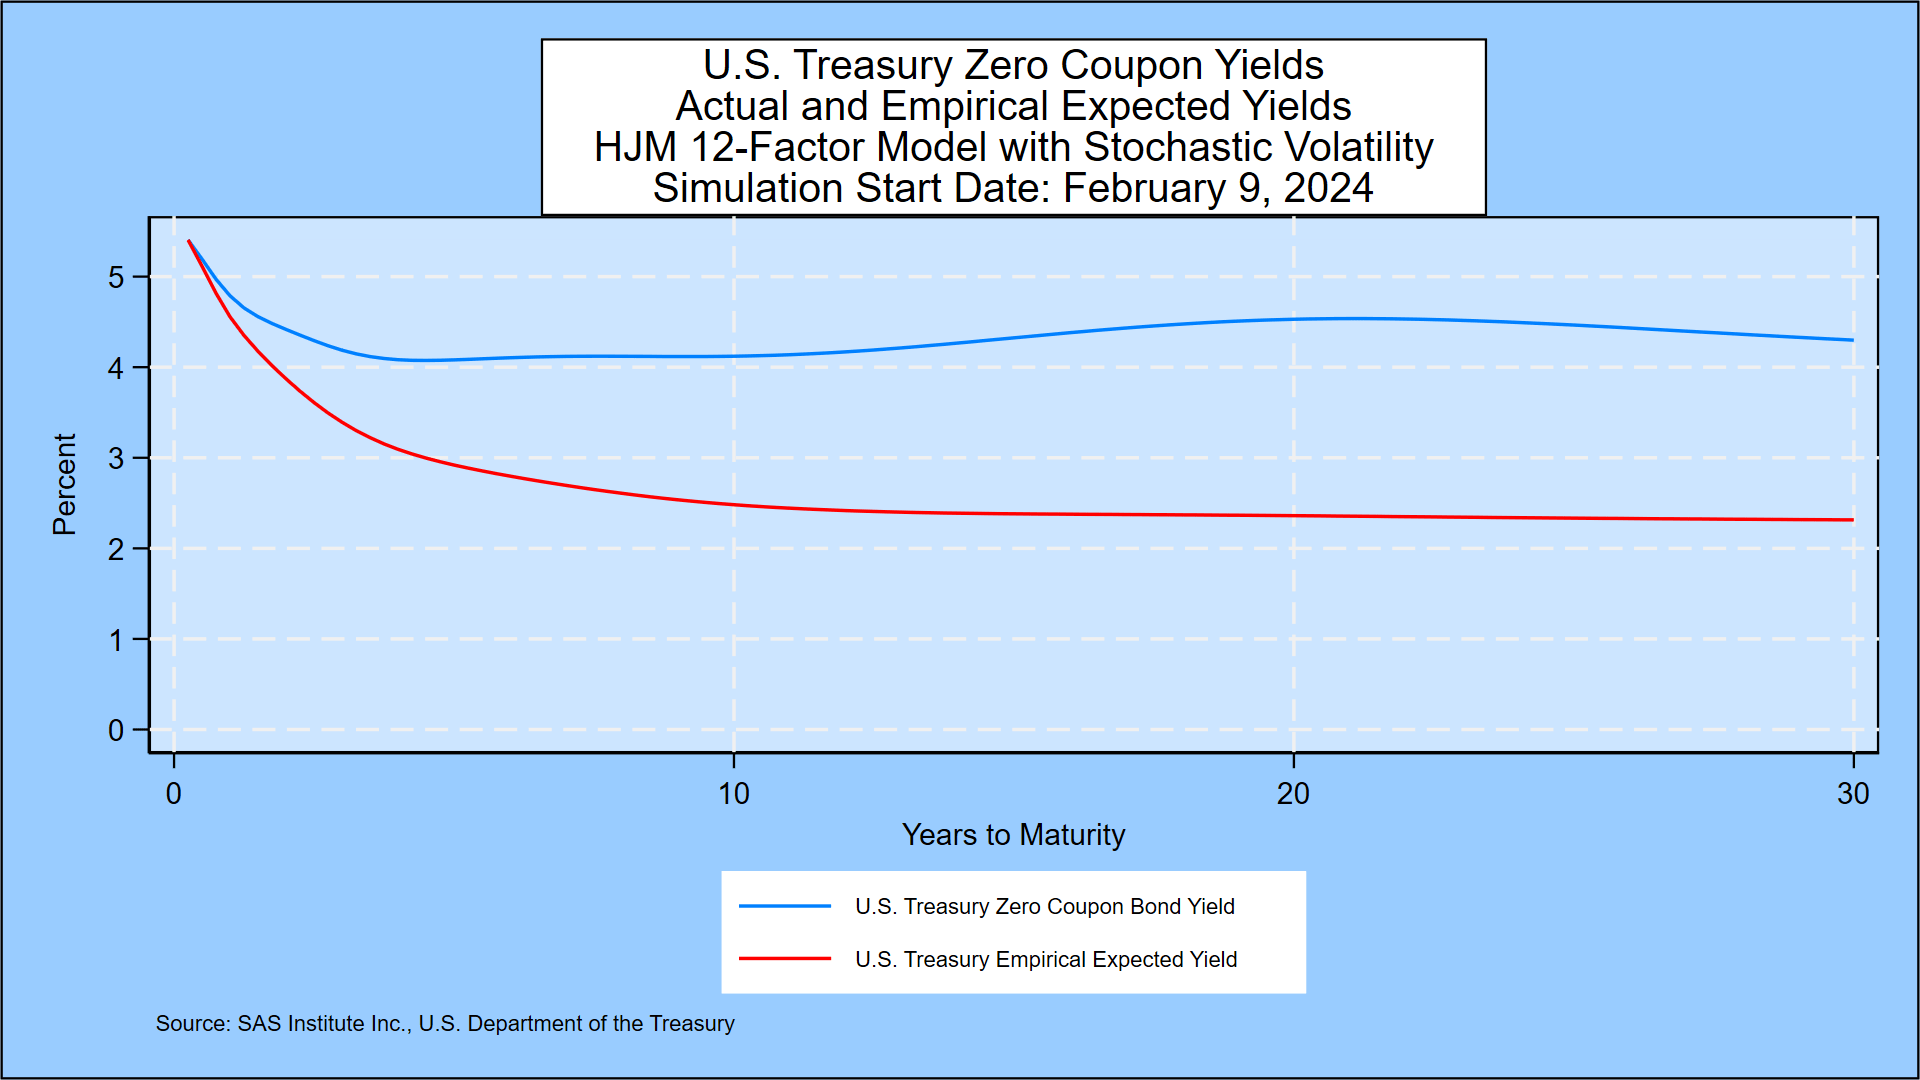
As explained in Prof. Robert Jarrow’s book cited below, forward rates contain a risk premium above and beyond the market’s expectations for the 3-month forward rate. We document the size of that risk premium in this graph, which shows the zero-coupon yield curve implied by current Treasury prices compared with the annualized compounded yield on 3-month Treasury bills that market participants would expect based on the daily movement of government bond yields in 14 countries since 1962. The risk premium, the reward for a long-term investment, is large and widens over most of the 30 year maturity range. The graph also shows a sharp downward shift in expected yields in the first few years, then the decline continues at a slow but steady pace for the full 30 years. We explain the details below.
For more on this topic, see the analysis of government bond yields in 14 countries through December 31, 2023 given in the appendix....
Weekly Forecast, Feb. 9, 2024: 23 Trading Days From A Record Negative Treasury Spread Streak