WRK - WestRock Acquisitions Did Not Create Shareholder Value
2023-11-23 20:58:22 ET
Summary
- WRK's revenue grew at a 7.8% CAGR over the past 9 years. This was due to the combination of organic growth, acquisitions and product price tailwinds.
- The operating returns achieved by the company were lower than its cost of funds. Growth did not create shareholders' value. It also incurred high impairment charges.
- Given the poor fundamentals and poor margin of safety, it is not an investment opportunity. Looking at the return and price trends, it is also not a short candidate. Hold.
Investment Thesis
WestRock Company ( WRK ) revenue grew at 7.8 % CAGR over the past 9 years. This was due to a combination of organic growth, acquisitions and past 2 years high product price tailwinds.
The growth did not create shareholders’ value as its return was lower than its cost of capital. At the same time, it incurred significant goodwill impairments. This suggests issues with its ability to negotiate good prices for the acquisitions.
While it is a cash cow, this was negated by its poor capital allocation plan. At the same time, while there are signs of operating improvements, this has yet to translate into better returns.
In addition to these fundamental issues, there is not enough margin of safety. This is neither an investment opportunity nor a short one. I recommend a hold.
Business background
The WRK that you see today resulted from 2 major restructuring/corporate excises.
- The 2019 acquisition of KapStone. This a leading North American producer and distributor of containerboard, corrugated products, and specialty papers.
- The 2015 formation of WRK to merge the businesses of several companies in the paper and packaging sector. Technically, WRK did not have any operations before this 2015 formation.
The business of WRK today is different from that in 2015. However, to get a sense of where the company is heading, I looked at its performance from 2015 onwards. But greater emphasis was placed on the post-2019 performance.
Note that the financial year end for WRK is Sep. As such, unless stated otherwise, the various years stated in this article refer to the financial years.
WRK is a multinational provider of sustainable fiber-based paper and packaging solutions. In 2023, about ¾ of the company’s revenue came from the US.
The company has 4 business segments.
- Corrugated Packaging. This segment generates its revenue from the sale of corrugated containers and other corrugated products. In 2023, it accounted for about half of the company’s revenue.
- Consumer Packaging. This segment generates its revenue from the sale of consumer packaging products such as folding cartons, inserts, and labels. In 2023, this segment accounted for about ¼ of the company’s revenue.
- Global Paper. This consists of the company’s commercial paper operations. It generates its revenue primarily from the sale of containerboard, paperboard, and specialty grades. In 2023, it accounted for about 1/5 of the company’s revenue.
- Distribution. The segment revenue comes from the distribution of packaging products and the assembly of display products.
Operating trends
I looked at 3 metrics to get an overview of the overall performance – revenue, PAT, and gross profitability (gross profits / total assets). Refer to Chart 1.
Over the past 9 years, despite the merger and acquisitions, revenue only grew at 7.8 % CAGR. This is not a high-growth company.
PAT was volatile with losses in 3 years out of the 9 years.
- The losses in 2016 were mainly due to a USD 0.5 billion impairment charge relating to a discontinued operation.
- There was a USD 1.3 billion goodwill impairment in 2020 in the Consumer Packaging segment.
- There was a USD 1.9 billion goodwill impairment in 2023 in the Global Paper and Corrugated Packaging segments.
Over the past 9 years, the company incurred a total of USD 3.7 billion for impairment charges. During this period, its total PBT (after accounting for the impairments) was USD 4.1 billion.
You can see the significant impact of the impairments. It makes you wonder about management’s ability to negotiate the acquisition/merger prices.
You should be concerned as the company “…continue to evaluate potential acquisitions…” 2023 Form 10k.
Chart 1: Performance Index (Author)
Note to Chart 1. To plot the various metrics on one chart, I have converted the various metrics into indices. The respective index was created by dividing the various annual values by the respective 2015 values.
Operating returns
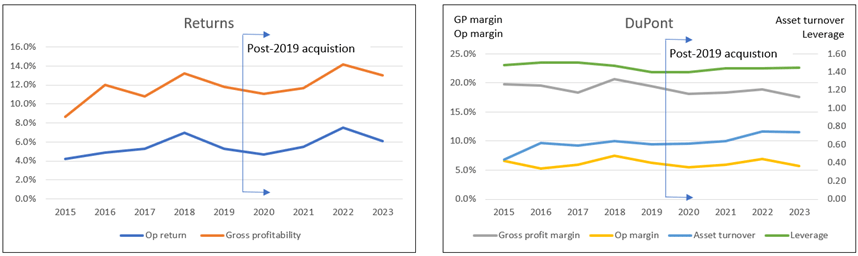
We also see a dismal picture in the operating returns. I defined this as after-tax operating profit divided by Total Capital Employed or TCE.
TCE = Equity + Debt – Cash.
From 2015 to 2023, the return ranged from 4.2 % to 7.5 % with an average of 5.6 %. This is a very low return when compared to its WACC of 8.5 % as shown in Table 1.
According to Damodaran , growth will not create shareholders' value if you have such a scenario.
Table 1: Estimating the WACC (Various)
Note to Table 1. Based on a Google search for the term “WRK WACC.”
I also conducted a DuPont Analysis based on this operating return as shown in Chart 2. Looking at post-2019:
- While still low, there were improvements in the operating returns.
- The operating margin accounted for the bulk of the variability of the return.
- There were improvements in the gross profitability and asset turnover. These indicated some improvement in capital efficiency.
- There was also no significant deterioration of the leverage.
Chart 2: Returns and DuPont Analysis (Author)
Operating profit
To understand the operating return better, I broke down the operating profits into fixed costs and variable costs.
Fixed cost = Selling, General and Administration expenses + Depreciation & Amortization.
Variable cost = Cost of Sales – Depreciation & Amortization.
Contribution = Revenue – Variable Cost.
Operating profit = Contribution – Fixed cost.
Chart 3 summarizes the past 9 years' performance. You can see that the Fixed cost is a relatively small portion of the total cost.
Chart 3: Operating profit analysis (Author)
Note to Chart 3: There is an operating profit if the Revenue is above the combined Fixed costs and Variable costs.
Volume vs Price
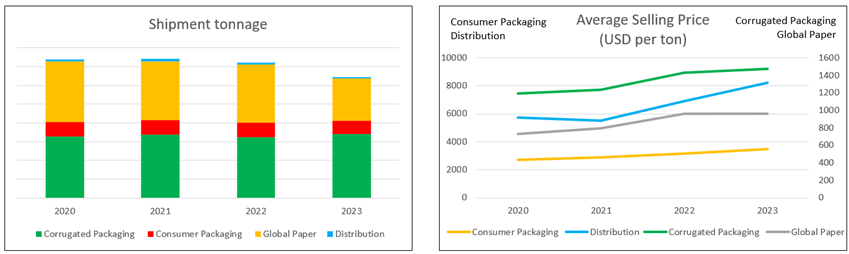
Looking at Chart 3, you can see that revenue had been increasing post-2019. A breakdown of the revenue into shipment tonnage and average selling price is shown in Chart 4.
- There was hardly any shipment volume growth. In fact. the volume for Global Paper and Distribution declined by 11.4 % CAGR and 7.4 % CAGR respectively.
- Revenue growth was driven by price growths for all the 4 segments.
Chart 4: Volume and Price Trends (Author)
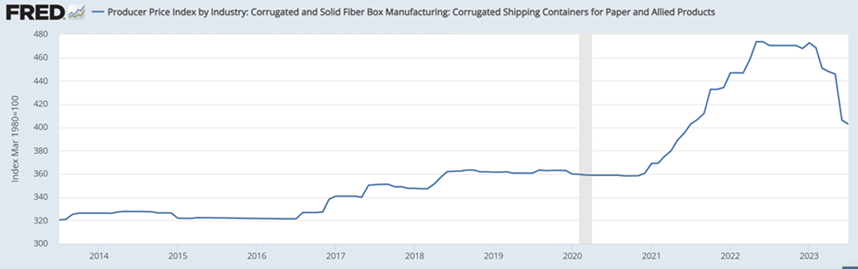
You should not be surprised by the growing selling prices. The price for corrugated and fiber boxes over the past 3 years have been extraordinarily high as illustrated in Chart 5.
There are signs that product prices are currently reverting to the long-term growth trends. If this happens and the company is not able to arrest the declining shipment volume, revenue growth will be a challenge.
I have another concern. If you look at Chart 2, you can see that gross profit margin declined post-2019. This occurred when average selling prices were trending up.
What would happen to the gross profit margins if we have lower average selling prices?
Chart 5: Producer Price Index (FRED)
Growth
As mentioned earlier, revenue grew at 7.8 % CAGR over the past 9 years. I have already mentioned the contribution from the tailwinds of high product prices.
Furthermore, despite the acquisitions, most of the revenue growth over the past 9 years came from organic growth.
The company did not provide a breakdown of its revenue growth into those due to acquisitions and organic growth. But my back-of-envelope estimate is that organic growth contributed to a bigger portion of the revenue growth. I used 2 ways to deduce this.
- Over the past 9 years, the company spent USD 7.7 billion on CAPEX compared to USD 5.1 billion on acquisitions. Assuming a proportionate contribution to growth, you would expect organic growth to account for more.
- From 2019 to 2022, revenue grew at 5.1 % CAGR. I would treat this as all from organic growth as there was no acquisition during 2020 to 2022.
Industry growth
The packaging industry is not a high-growth one as reported by various market researchers.
“The Packaging Industry in the United States is estimated at USD 193.31 billion in 2023… growing at a CAGR of 3.97% during the forecast period (2023-2028).” Source: Mordor Intelligence
“The United States packaging market…is anticipated to register a CAGR of more than 1% during 2022-2027.” Source: GlobalData.
“…between 2018 and 2028 the global packaging market is set to expand by almost 3% per annum, reaching over $1.2 trillion.” Source: Smithers
These results suggest that the company cannot rely on organic growth if it wants high growth. The dilemma is that its acquisitions have resulted in high impairments.
Reinvestments
Growth needs to be funded and one metric for this is the Reinvestment rate. This is defined as:
Reinvestment with acquisitions = CAPEX & Acquisitions – Depreciation & Amortization + Net Changes in Working Capital.
I then determined the Reinvestment rate = Reinvestment / after-tax EBIT.
Acquisitions are an integral growth driver for the company. As such I have included the annual acquisition expenditure as part of the CAPEX.
I compared the Reinvestment rates for 2 periods.
- 2020 to 2022 when there was no acquisition.
- 2016 to 2018 where there were some acquisitions every year.
For the former period, the annual Reinvestment rate was negative. This meant that the amount spent on net CAPEX & Acquisitions and Net Changes in Working Capital was smaller than the Depreciation & Amortization charges.
But we have a different picture for 2016 to 2018. The average Reinvestment rate was 38 % during this period.
The key takeaway here is that for organic growth, the business does not need "additional funds".
Financial position
I would rate WRK's financial position as acceptable. I have concerns about the high interest expenses that over the past 4 years averaged about 33 % of the operating profit. But it is a cash cow.
The negative side of its financial position can be summarized as follows:
- It has a 0.43 Debt Capital ratio as of the end of Sep 2023. As per the Damodaran Jan 2023 dataset, the Debt Capital ratio for the packaging and container sector was 0.38. It was 0.30 for the paper/forest products sector.
- As of the end of Sep 2023, it had USD 393 million in cash. This was only about 1.4 % of its total assets.
- I have concerns about its capital allocation plan as discussed in the next section.
But on the positive side, it does not have a liquidity problem. Over the past 9 years, it generated positive cash flow from operations every year. It generated about USD 16.8 billion in cash flow from operations compared to its PAT of USD 3.1 billion. This is a good cash conversion ratio.
Capital allocation
I also have concerns about its capital allocation plan. Over the past 9 years, it generated about USD 16.8 billion of funds from cash flow from operations. Refer to Table 2.
You can see that the cash flow from operations was more than sufficient to fund the dividends & buybacks as well as CAPEX. However, it had to issue new net debt to help fund its acquisitions.
As mentioned earlier, my concern was the acquisitions. The company spent USD 5.1 billion on its net acquisitions (acquisitions less divestitures). Of these, it impaired about USD 3.7 billion. Then the acquisitions accounted for less than half of the revenue growth.
Of course, these are back-of-the-envelope estimates. But it makes you wonder whether the company would be better off giving the monies to shareholders or even reducing its debt.
The conclusion is that while it is a cash cow, it seemed to be negated by the poor capital allocation plan.
Table 2: Sources and Uses of Funds (Author)
Valuation
What are the key takeaways when valuing WRK?
- This is not a high-growth sector. Given that its return is less than its cost of funds, pursuing high growth will not create shareholders’ value. It may be more appropriate to value WRK based on the single-stage model.
- It is possible to have organic growth without any additional reinvestments. We can model a low organic growth situation with a zero Reinvestment rate.
- It is facing declining shipment tonnage. In the immediate to mid-term, product prices relative to those over the past 2 years may decline. We should model revenue based on shipment volume and average selling price.
- To be conservative, the model should account for the impairments that seemed significant.
I considered 4 Scenarios in my valuation:
- Scenario 1 - base. This is based on the 2023 volume and average selling price. I do not consider this realistic as I expect declining selling prices.
- Scenario 2 - conservative. The volume was based on the past 4 years' average volume while the selling price was based on the 2020 value.
- Scenario 3 - expected. This assumes that the company can achieve the best past 4 years’ performance for the volume. But the selling price is an average of the past 4 years.
- Scenario 4 – best. This assumed that the volume, selling price, and contribution were from the respective past 4 years best. I do not expect this to be achieved.
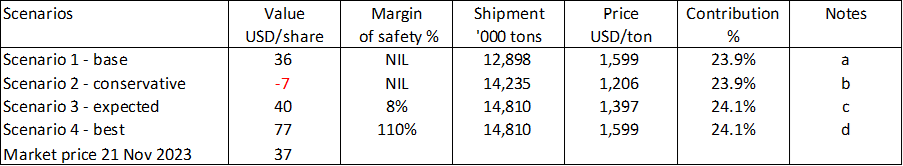
The results of the valuations are shown in Table 3.
- There is no margin of safety under Scenarios 1 and 2.
- Note that the value of equity is negative under Scenario 2. This is because I first derived the value of the firm. The value of equity was obtained by deducting debt from the value of the firm. The equity was negative because debt was more than the derived value of the firm.
- There is not enough margin of safety in the expected Scenario given my 30% target margin of safety.
- You can only get more than a 30% margin of safety in Scenario 4.
I do not expect the company to achieve Scenario 4. As such, I would conclude that WRK is not an investment opportunity.
Table 3 Summary of valuation (Author)
Notes to Table 3:
a) Shipment and price based on 2023. Contribution based on the 2020 to 2023 average.
b) Shipment and contribution based on the 2020 to 2023 average. Selling price based on 2020.
c) Shipment and contribution based on the best of 2020 to 2023. Selling price based on the 2020 to 2023 average.
d) All based on the respective best of 2020 to 2023
Valuation model
I valued WRK using the Free Cash Flow to the Firm (FCFF) model as represented by:
Value of firm = FCFF X (1+g) / (WACC - g)
Value of equity = Value of firm - Debt - Minority Interests + Cash & Non-Operating Assets.
FCFF = EBIT(1-t). I ignored Reinvestment in this model.
My valuation model is based on the operating profit model shown in Chart 3.
- Revenue is broken down into volume X selling price.
- EBIT = Contribution – Fixed costs.
- Contribution = Revenue X Contribution margin
The key variables in my model are:
- Shipment volume. This was based on the total tonnage data for all the segments.
- Price. This was the average selling price. I derived this by dividing the total segment Revenue by the total shipment tonnage.
- Contribution margin = I derived the annual margin by dividing the annual Contribution by the respective annual Revenue.
- Fixed costs. I assumed this to be based on the 2020 to 2023 average of USD 3,197 million.
- Other costs. The bulk of these are impairments. I assumed the average 2020 to 2023 average of USD 678 million.
If you want to see the details of the valuation model, I have provided a link to my worksheet . In this worksheet, you can carry out your sensitivity analysis by varying the following 5 parameters – shipment volume, selling price, contribution margin, fixed costs, and other costs.
Risks and limitations
There are 3 key risks or limitations with my valuation.
- No-acquisition.
- No changes in the product mix.
- Impairments.
In my valuation, I have essentially focused on the “no-acquisition” situation. As discussed earlier, WRK should pursue this strategy until they can improve the operating returns.
The packaging sector is not a high-growth one. I am concerned that the company may seek to achieve higher growth through acquisitions. However, given its impairment track record and low returns, this will not create shareholders’ value. The risk is that the company may pursue this and give the impression of growth. Yet shareholder's value would be destroyed.
Should WRK pursue acquisitions without improving the return, the intrinsic value would be lower than what I have estimated. This is because growth would not create value in such a situation.
But if the returns can be improved to be better than the cost of capital, it would be more appropriate to value it based on a 2-stage growth model. But this is a story for another day.
Secondly, I assumed that the historical product mix would continue to apply. Looking at Chart 4, you could challenge this. Different segments have different average selling prices. If there are significant changes to the product mix, the historical average selling prices would not be realistic. One way to mitigate this is to undertake some sensitivity analysis of the selling prices.
I have also assumed that there will continue to be impairments based on the 2020 to 2023 average values. If we ignore these impairments, there will be more than a 30 % margins for Scenario 1 and 3. But given the possible declining product prices and shipment volume, I dare not ignore this.
In 2019, the company had USD 11.3 billion of goodwill and intangibles. These were equal to about 38 % of the total assets. After the write-offs in 2020 and 2023, and the annual amortization, these had reduced to USD 6.8 billion. But these are still sizable at about 25% of the total assets. Would you invest in WRK on the basis that there would not be further impairments? I leave it up to you to carry out your sensitivity analysis.
Conclusion
2 issues caused WRK valuation to be low:
- Its low operating returns. The average return is lower than its cost of funds.
- Its historically high impairments.
WRK is not a growth company. On top of this, I have other concerns about its fundamentals.
- Over the past 2 to 3 years, it benefitted from the high product price tailwinds. But its shipment volume did not grow.
- The packaging sector is a mature one.
- Its capital allocation plan can be improved. This is of course tied to its acquisitions track record.
The positive thing is that it was able to generate positive cash flow from operations every year over the past 9 years, despite 3 years of losses. If there was no acquisitions, it would be a cash cow.
At the same time, there are signs of improving operating efficiencies. However, these are not sufficient yet to translate into higher operating returns.
Unless the company addresses all of them, it does not look like a company with good prospects. My valuation reflects this outlook. That is why there is no margin of safety.
There would be a sufficient margin of safety if you assumed that there is no future impairment charges. But I am not confident of such a scenario and have incorporated the historical impairment charges. This contributed to the zero or low margin of safety.
Given the poor fundamentals and margin of safety, I do not consider WRK an investment opportunity.
But is there an opportunity to short it? If you look at the Chart 6, its current share price is not the peak price. It does not make sense to short it. A hold seemed more reasonable.
Chart 6: Return vs share price trend (Author from TIKR.com)
I am a long-term value investor and my analysis and valuation are based on this perspective. This is not an analysis for those hoping to make money over the next quarter or so.
For further details see:
WestRock Acquisitions Did Not Create Shareholder Value