QYLD - What Kind Of Returns Can You Expect From QQQY?
2023-10-23 07:46:27 ET
Summary
- Defiance Nasdaq 100 Enhanced Options Income ETF sells daily 0DTE options on the Nasdaq index, which excited many investors when it paid a 6% monthly dividend yield.
- Selling daily options can result in severe NAV decays in a highly volatile market, causing potential losses while the upside is limited.
- Back-testing results show that buying and holding QQQ outperforms selling daily options, indicating lower returns for the ETF in the long run.
- The fund can still generate decent amount of income and outperform its rivals like QYLD but you must set your expectations realistic about what it can and can't do.
The Defiance Nasdaq 100 Enhanced Options Income ETF (QQQY) is a newly launched "covered call" ETF that is slightly different from others because, unlike many other covered calls funds that sell options on a monthly basis, it sells daily 0DTE options (more specifically cash covered puts but they work the same way as covered calls) on Nasdaq index ( QQQ ). The fund paid its first monthly dividend distribution a few weeks ago which had a yield of 6% (meaning 72% annual yield) which created a lot of excitement among many investors but while I think this fund can be a good addition to your income portfolio, I don't think those yields are anywhere close to sustainable.
Daily options (0DTE) on index funds such as SPDR® S&P 500 ETF Trust ( SPY ) and QQQ were launched about a year ago and there has been a lot of hype around them. Defiance recently created this ETF in an effort to capitalize on this excitement. The idea of making money by selling 0DTE options seems simple on paper. Basically, there are 252 trading days in a year which means 252 daily contracts to sell. Typically daily contracts that are slightly out of money have a time value of 0.25% which means if you sell 252 of such contracts, you should make about 63% of a yield on time values alone.
In a perfect world, this would work perfectly and you would be able to generate yields like this selling 0DTE QQQ options but unfortunately, we don't live in a perfect world. There are many days when the market is either up or down wildly. When you sell covered calls or cash secured puts on an index, you cap your upside in exchange for a premium payment but you participate in almost all of the downside. In other words, if you sell a covered call or cash secured put at the money and the market rises 5% the next day you will miss out on most of it but if the market drops 5% the next day, you will suffer most of the damage. This is why funds like Global X NASDAQ 100 Covered Call ETF (QYLD) see their NAV drop over time but these funds sell covered calls on a monthly basis so their NAV drop might not be as severe. In a highly volatile market that swings up and down wildly, selling 0DTE options can result in severe NAV decays.
In order to back-test this ETF's strategy, I downloaded daily price information for QQQ for the last 5 years into an Excel file. This includes a period where QQQ was highly volatile but generally trended up. In fact, QQQ climbed 105% during this period despite all this volatility.
In order to teach the value of buy-and-hold strategy, there is a famous saying that says "if you miss out on the 10 best days of the market, you will miss out on the biggest gains". Below are the best 10 days of QQQ in the last 5 years. If you missed out on these days you would have missed out on combined gains of 65% which happens to be two-thirds of all of QQQ's gains in the last 5 years. It turns out that the saying is true after all. The problem with selling out 0DTE options is that you will miss out on all of these days because your gains will be capped out.
Nasdaq's best 10 days (Author)
On the other hand, you will suffer the grunt of the worst 10 days because selling daily options provides so little protection. So if you are going to miss out on the best days but still suffer on the worst days of the market, you better generate a good amount of premium to make up for it.
Nasdaq's Worst 10 Days (Author)
Using the daily QQQ data in Excel I created a scenario that duplicates QQQY's strategy of selling daily puts slightly in the money to see what kind of gains I could have generated in the last 5 years. Since daily options have only been around for only 13 months, I had to make some assumptions and assume an options value based on VIX at the time which fluctuated wildly in 2018 and 2020 not to mention last year. There were a total of 1,259 trading days during this period so we are assuming that many instances of selling daily options.
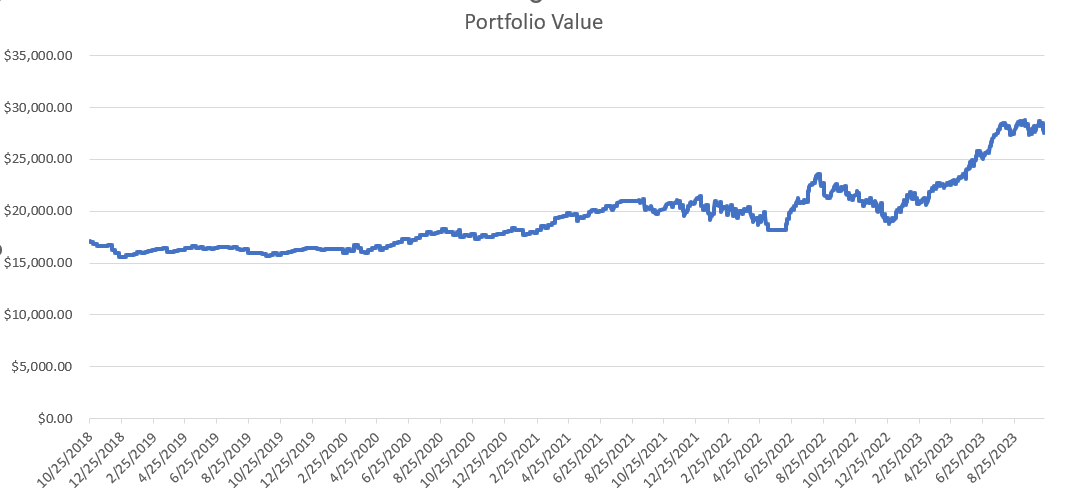
First, let us look at how our portfolio value would fluctuate over time. We are starting out with $17,100 because at the beginning of our experiment, QQQ was trading at $171 and we needed that much capital in order to write puts against the fund. Notice that our portfolio was mostly in a range from 2018 to 2021 while the market was highly volatile. Since VIX was higher, we were collecting a higher premium but we were also suffering on those big red days and not participating as much in the big green days. Still, we were generally positive. Most of the gains came in the last year because Nasdaq was climbing at a slow but steady pace which is the ideal condition for selling daily options. In 2020 when the Nasdaq was climbing it had a lot of days where it jumped 4-5% or more but this year the index climbed in a more orderly fashion with a lot of ~1% days which helped capture these gains.
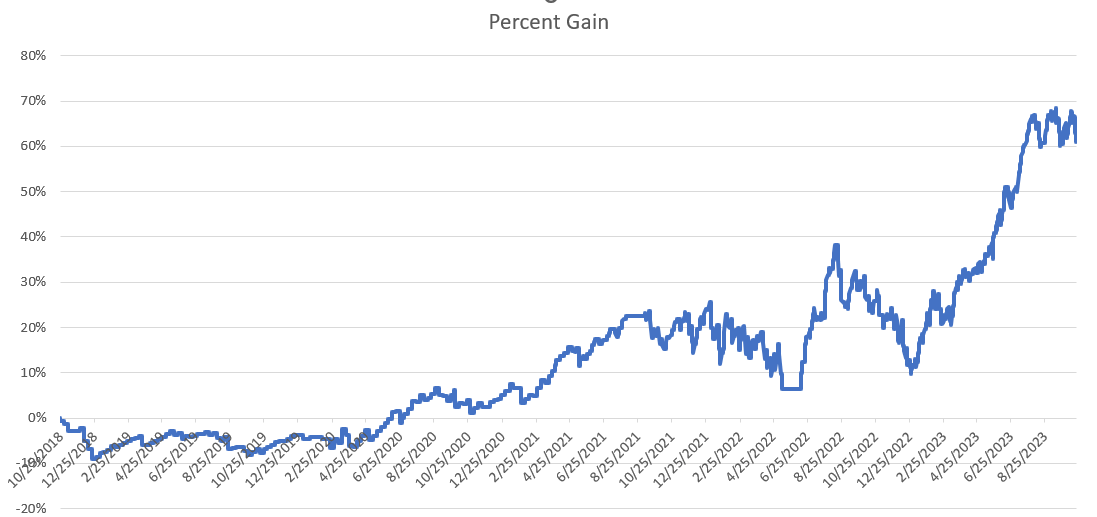
Now let us look at percentages which is what matters the most. Notice that the fund's play initially went to negative in the fall of 2018 which is no surprise since the market had a -20% correction during this period. What's less surprising is that the play remains in negative territory until well into 2020 even though 2019 was a solid green year where Nasdaq was up by about 35%. Keep in mind that the average VIX in 2019 was in low teens so there wasn't much money to be made by selling options. The play returned to green in 2020 and 2021 but gave back most of its gains in 2022 but luckily started climbing again in 2023.
All in all, the play ended this five-year period being up 62% which averages about 12% per year (10% per year if you account for compounding). It's not bad per se but it's still falling behind in buying and holding QQQ which saw gains of 105% during the same period. Buying and holding Nasdaq still wins by a large margin.
What did QYLD do during this period? Well it was up only 26% in total returns so we can say that selling daily options would have outperformed selling monthly options during this period but both would underperform buying and holding QQQ. Then again the difference between two strategies isn't just selling daily vs monthly options. Keep in mind that QYLD sells at-the-money options which means they don't participate in any upside whereas QQQY sells options a few dollars above the current price which means they get to participate in at least some of the gains.
I honestly don't know why QQQY announced such a high dividend distribution in its first month (annualized 72%) when QQQ was down during that period and it may not be sustainable in the long term. Realistically the fund should generate about 10% return in a year when QQQ is generally trending up but it might also not generate any returns at all if QQQ is down. For example based on my back-testing results, QQQY would have been down about -20% last year which would be better than QQQ's drop of -35% but still a big loss. If the company were to pay such large distributions last year it could have eroded most of its NAV.
You can look at a fund's NAV to see if its plays are making money or losing money and whether it can cover its distributions. If a company's NAV is constantly going up (even after making distributions) that's a good sign and means that it can cover future distributions. If a fund's NAV is eroding every time it makes a distribution, maybe it's time for it to cut or eliminate distributions because those distributions might not be sustainable. I'll be keeping an eye on this fund's distributions to see how sustainable they are in the near future. So far it's been trending down and signals to me that they need to be more conservative with their distributions.
When it comes to this fund, it's not a bad fund and it's likely to result in decent results in a bull market and supplement your income but it is likely to underperform QQQ in the long run. You should keep your expectations realistic about what kind of returns to expect from this fund.
For further details see:
What Kind Of Returns Can You Expect From QQQY?