SAND - Wheaton Precious Metals: Salobo Made The Difference This Quarter
2023-08-15 06:42:25 ET
Summary
- Wheaton Precious Metals reported a 12.5% decrease in revenues for Q2 2023 compared to the previous year.
- The company produced 147,699 GEOs in 2Q23, down from the prior year quarter's 156,570 GEOs, and sold 138,835 GEOs.
- I believe it is safe to accumulate WPM stock between $42.3 and $41.20, with a possible lower support of $41.2.
Introduction
The Canadian company Wheaton Precious Metals Corp. ( WPM ) released its second-quarter 2023 results on August 10, 2023.
Note: This article updates my previous article published on June 30, 2023. I have been following WPM quarterly results since Sep. 2018.
WPM has 19 operating mines and 13 development projects throughout the Americas, unchanged from 1Q23.
WPM Assets Map (WPM Presentation)
1 - A quick snapshot of the second quarter of 2023
The company generated revenues of $264.97 million during 2Q23, down 12.5% year-over-year. The adjusted Income was $143 million .
Wheaton Precious Metals reported an operating cash flow of $202.38 million in the second quarter of 2023, compared with $215.38 million in the second quarter of 2022.
The company produced 147,699 GEOs in 2Q23 , down from the prior-year quarter's 156,570 GEOs, and sold 138,835 GEOs .
The average annual production guidance for 2023 of 600K to 660K GEOs is maintained, with sector-leading growth resulting in five and ten-year average annual production guidance of approximately 810K and 850K GEOs .
CEO Randy Smallwood said in the conference call :
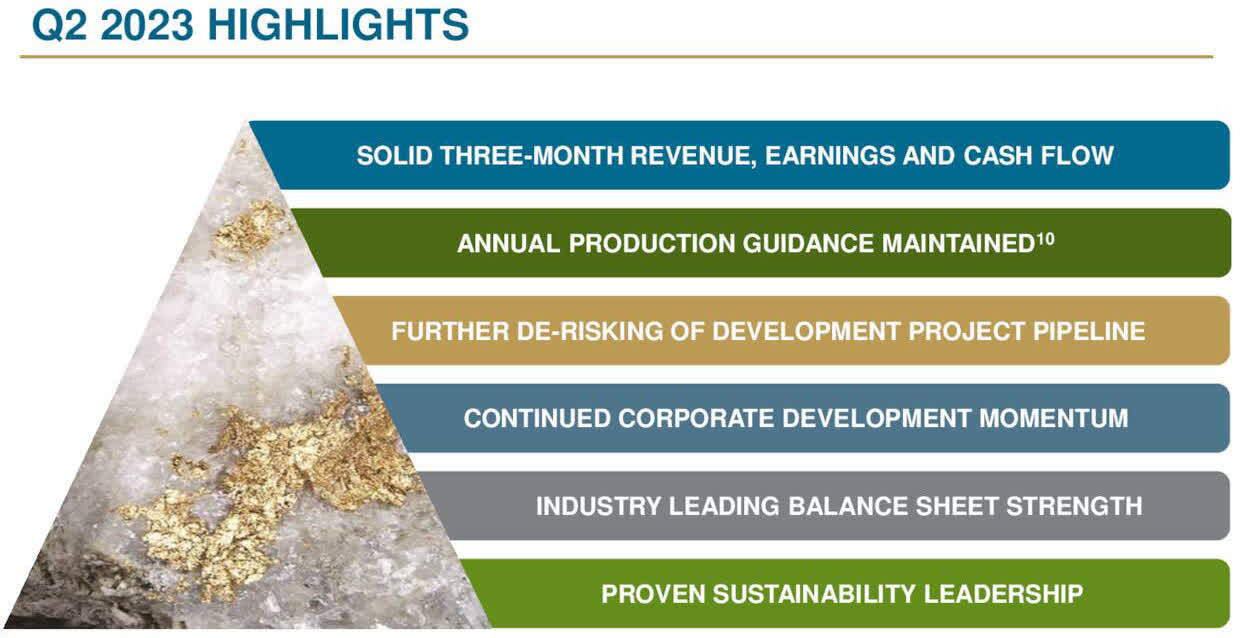
Our strong performance was underscored by significant progress at the recently commissioned expansion at our largest asset, Salobo, the ramp-up of which we expect to continue throughout 2023. And despite operations at Peñasquito being suspended in early June due to a labour dispute, we achieved quarter-over-quarter gold-equivalent production growth, highlighting the resilience of our high-quality, diversified portfolio.
WPM 2Q23 Highlights (WPM Presentation)
2 - Stock performance
Wheaton Precious Metals and Franco-Nevada ( FNV ) are my long-term core streamers. WPM has outperformed its peers and is up 30% on a one-year basis. Sandstorm Gold ( SAND ) continues to underperform the group.
I strongly recommend reading my recent article on SAND by clicking here .
3 - Investment Thesis
WPM is one of my long-term investments in the royalties & streams segment with Franco-Nevada. I also own a small long-term position with Sandstorm Gold that I trade more frequently.
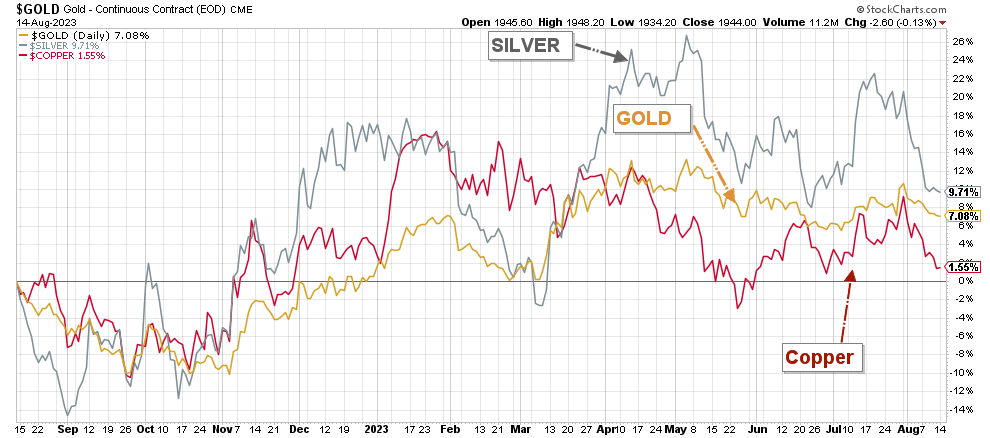
Wheaton Precious Metals Corp. is highly correlated to the gold price, representing 56.4% of the total revenues 2Q23.
Unfortunately for gold, Jerome Powell hinted that it would be necessary to hike interest rates another 25 points before the end of 2023 due to a surprisingly resilient economy encouraging higher inflation.
Despite this not-so-good short-term forecast, the gold price has traded above $1,900 per ounce until now, which is positive. Gold will probably trade between $1,875 and $1,950 per ounce for the remainder of 2023 unless something new and serious happens.
However, I assume the FED will signal a definitive pause early next year, boosting gold to a range of $2,000 and $2,100 per ounce.
WPM 1-Year Chart Gold, Silver, Copper (Fun Trading StockCharts)
Thus, the best strategy to respond to such a trend is regularly trading short-term LIFO , at least 30%-40% of your long-term position.
Wheaton Precious Metals: Financials And Production History ending in 2Q23
Note: All numbers are in US$
| Wheaton Precious |
| 2Q22 |
| 3Q22 |
| 4Q22 |
| 1Q23 |
| 2Q23 |
| Total Revenues in $ Million |
| 302.92 |
| 218.84 |
| 236.05 |
| 214.47 |
| 264.97 |
| Net Income in $ Million |
| 149.07 |
| 196.46 |
| 166.13 |
| 111.39 |
| 141.45 |
| EBITDA $ Million |
| 210.74 |
| 264.62 |
| 207.31 |
| 151.58 |
| 202.44* |
| EPS diluted in $/share |
| 0.33 |
| 0.43 |
| 0.38 |
| 0.25 |
| 0.31 |
| Cash from operating activities in $ Million |
| 206.36 |
| 154.50 |
| 172.03 |
| 135.10 |
| 202.38 |
| Capital Expenditure in $ Million |
| 15.55 |
| 47.56 |
| -87.45 |
| 32.30 |
| 88.71 |
| Free Cash Flow in $ Million |
| 190.81 |
| 106.93 |
| 259.48 |
| 102.80 |
| 113.67 |
| Total cash $ Million |
| 448.63 |
| 494.62 |
| 696.09 |
| 799.70 |
| 828.84 |
| Long-term debt in $ Million |
| 0.0 |
| 0.0 |
| 0.0 |
| 0.0 |
| 0.0 |
| Dividend per share in $ |
| 0.15 |
| 0.15 |
| 0.15 |
| 0.15 |
| 0.15 |
| Shares outstanding (diluted) in Million |
| 452.4 |
| 452.39 |
| 452.71 |
| 453.16 |
| 453.58 |
| Production details |
| 2Q22 |
| 3Q22 |
| 4Q22 |
| 1Q23 |
| 2Q23 |
| Production in Gold Equivalent K Oz GEO |
| 162.6 |
| 159.9 |
| 148.3 |
| 141.8 |
| 147.7 |
| Gold price realized $/Oz |
| 1,795 |
| 1,728 |
| 1,725 |
| 1,904 |
| 1,986 |
| Silver price realized $/Oz |
| 23.71 |
| 19.16 |
| 21.52 |
| 22.85 |
| 24.13 |
| The gold/silver ratio |
| 75.0 |
| 90.2 |
| 80.2 |
| 83.3 |
| 82.3 |
Source: Company release .
Note: WPM sold its 138,835 GEOs at $1,909 per ounce in 2Q23.
Mining Operations Wes Carson said in the conference call:
Overall production in the second quarter came in higher than expected, primarily driven by significant sequential improvement at Salobo. In the second quarter, Salobo produced 54,800 ounces of attributable gold, an increase of 61% relative to the second quarter of 2022. Vale reported production in the quarter was driven by better-than-expected ramp-up of Salobo 3
Analysis: Revenues, Earnings Details, Free Cash Flow, Debt, And Gold Production Details
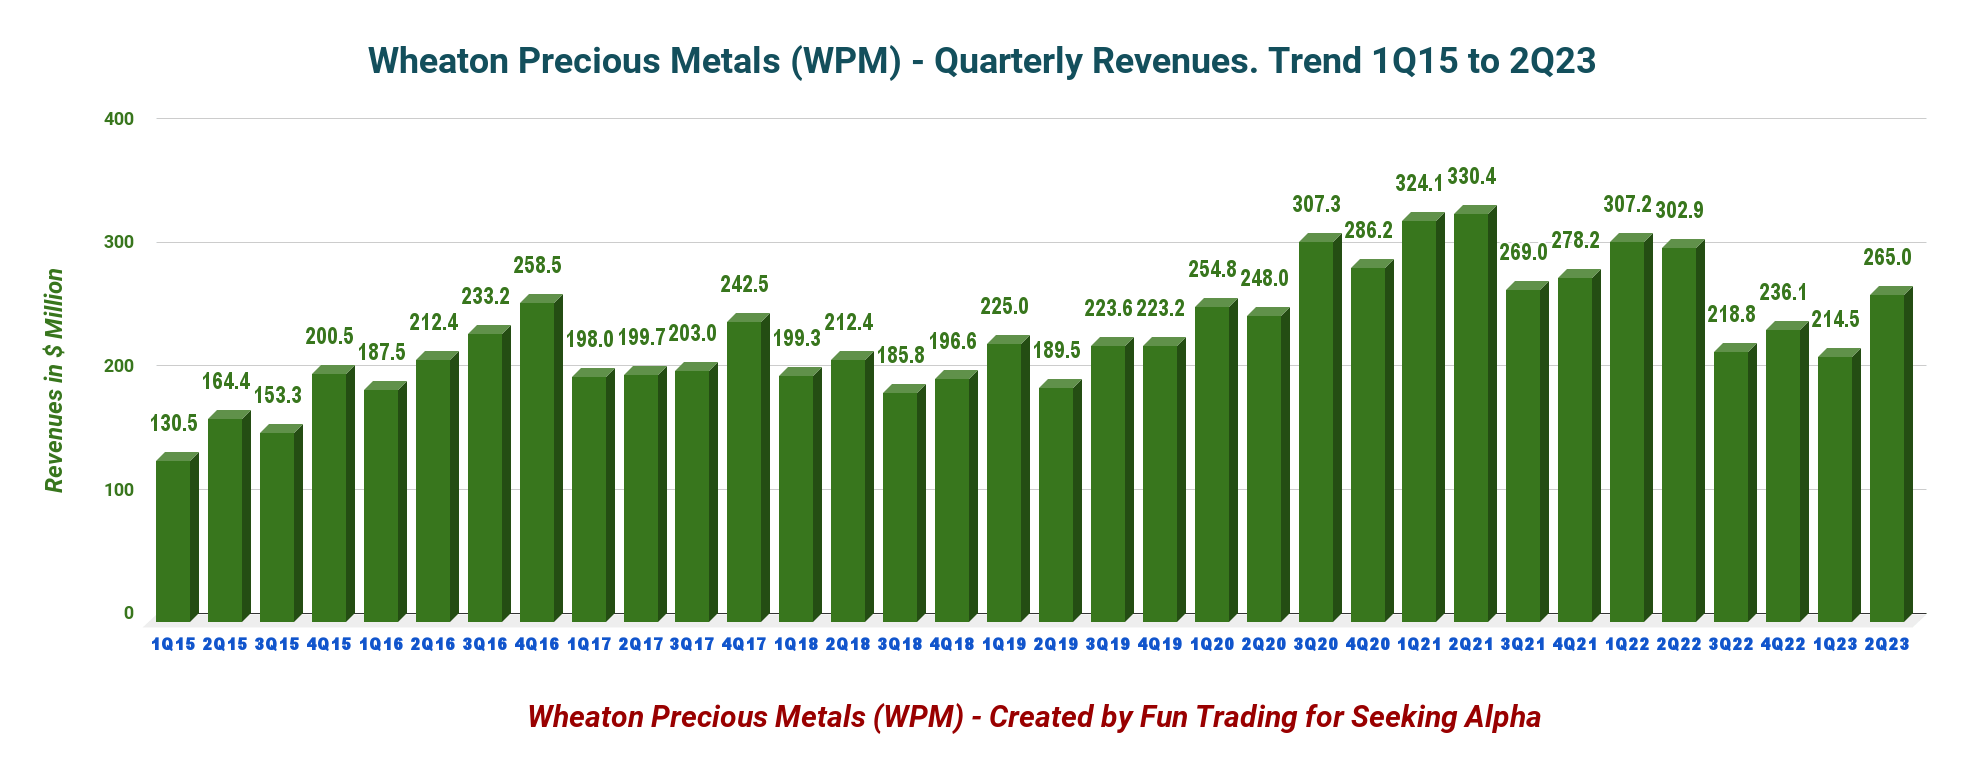
1 - Revenues: Wheaton Precious Metals posted $264.972 million in revenue for 2Q23
WPM Quarterly Revenue History (Fun Trading) The second quarter of 2023 revenues were $264.97 million (56% gold, 41% silver, 2% palladium, and 1% cobalt), down 12.5% on a year-over-year basis and up 23.5% sequentially.
The adjusted net earnings were $142.584 million , or $0.32 per share, down 4.5% YoY. The cash operating margin was $1,487 per GEO sold , an increase of 8% compared to the second quarter of 2022.
Cash from operating activities for the second quarter of 2023 was $202.38 million compared to $206.36 million in the prior year.
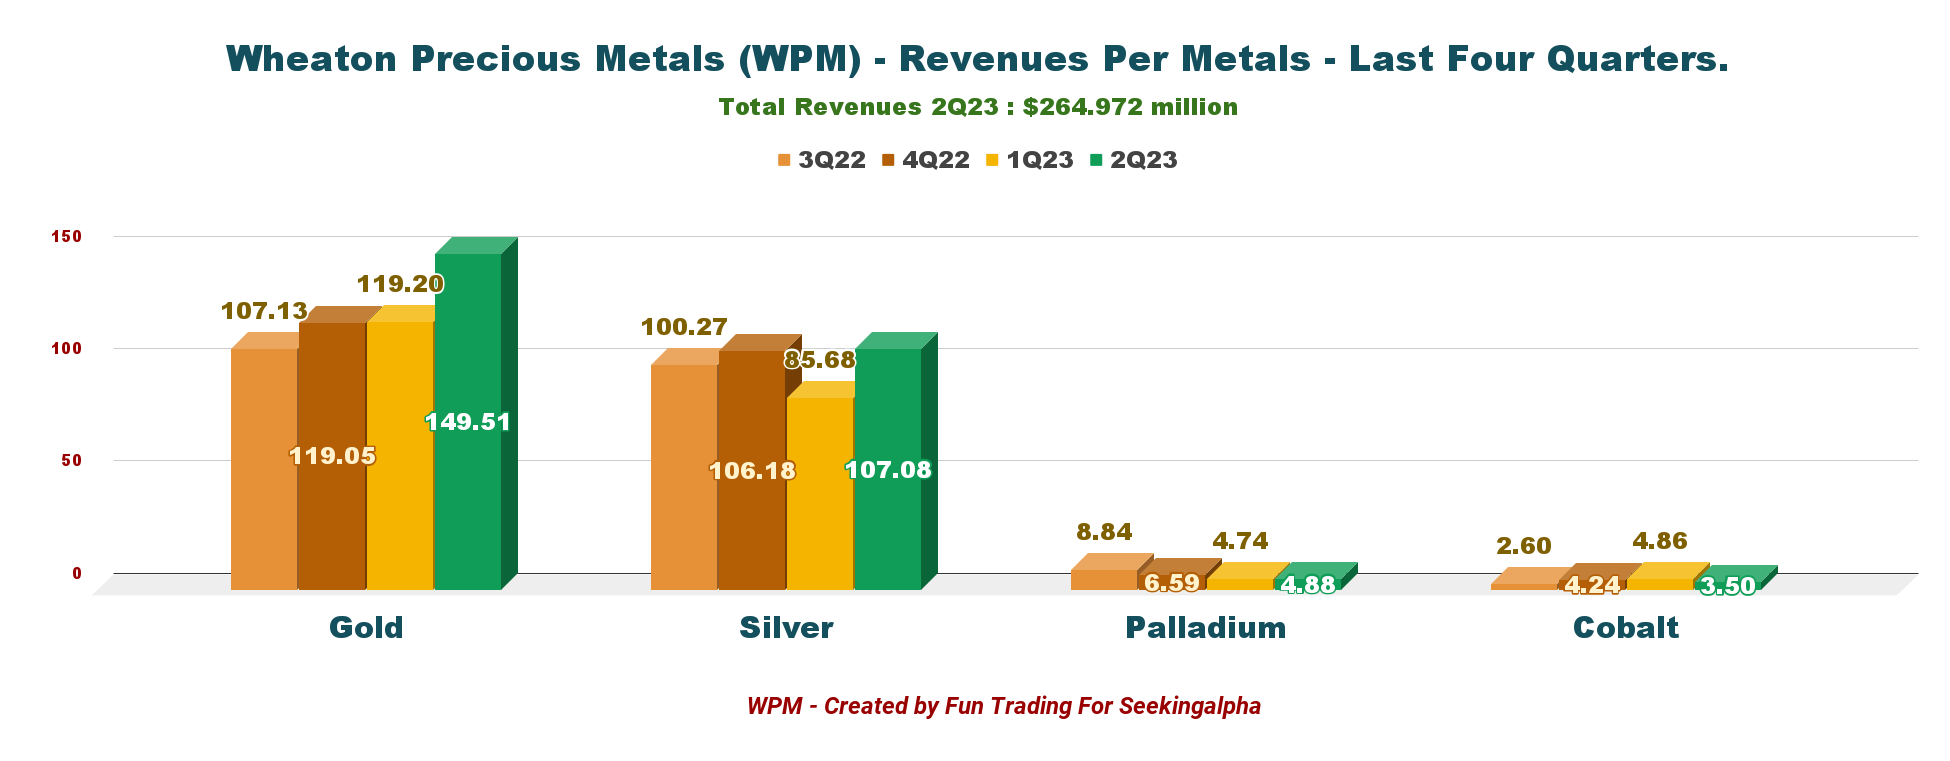
Below is shown the revenue per metal for the last four quarters.
WPM Quarterly Revenues per Mine (Fun Trading)
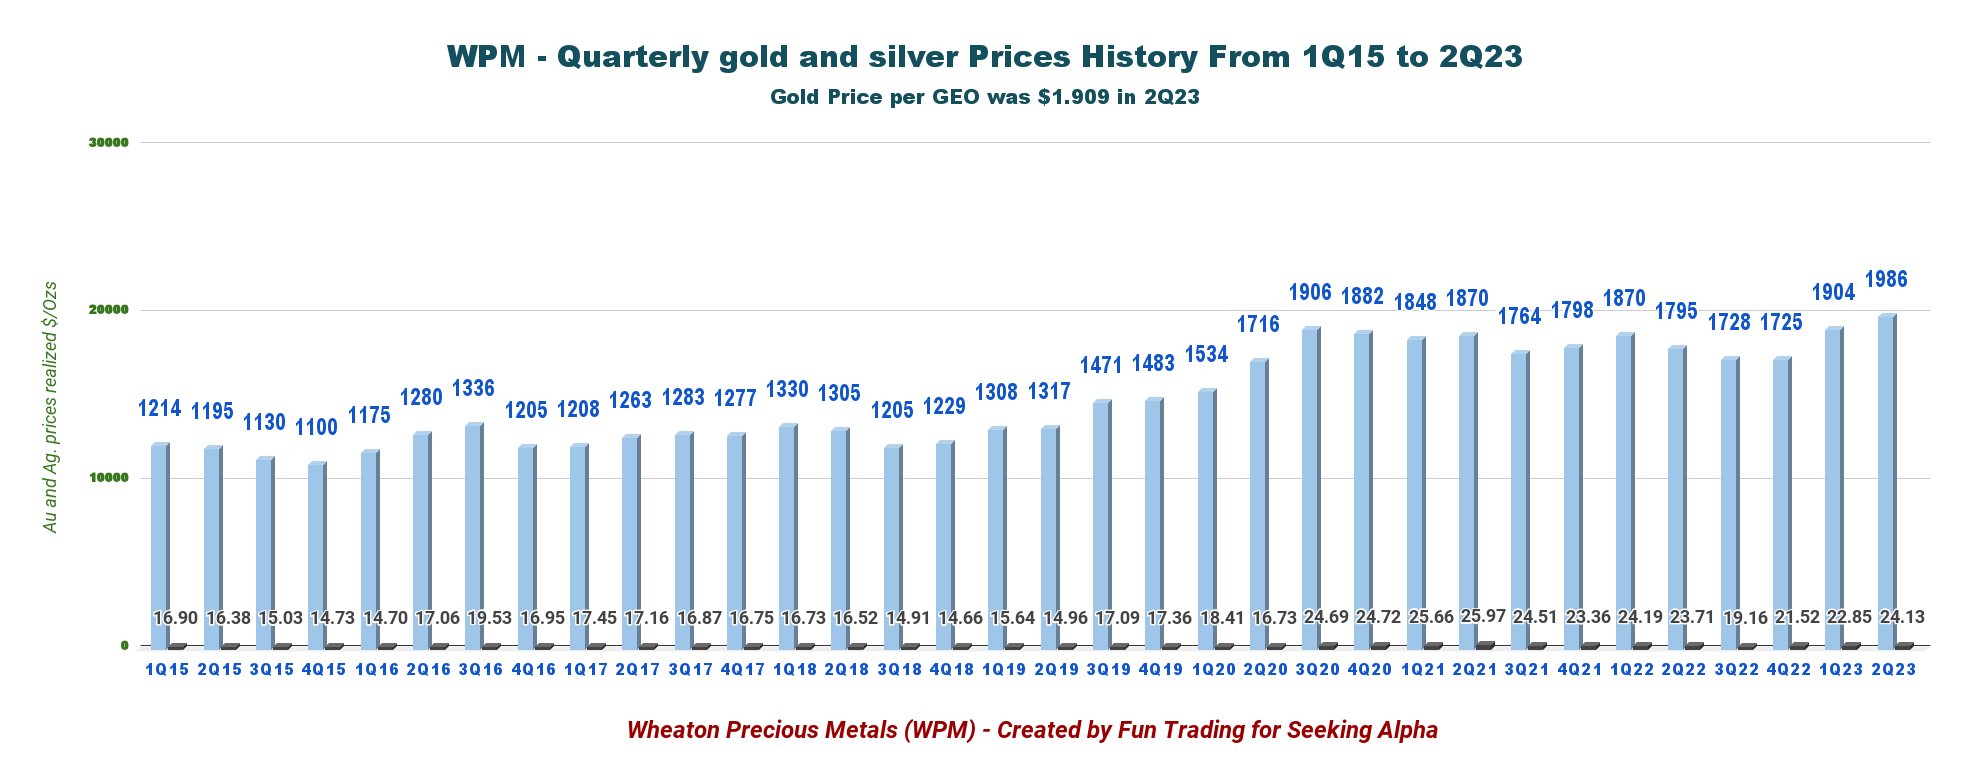
The gold price increased sequentially to $1,986 per Au ounce , while the silver price increased to $24.13 per Ag ounce . Palladium was $1,438 per ounce , and Cobalt was $13.23 per ounce .
The gold price per GEO was $1,909 .
Please see the chart below:
WPM Quarterly Gold and Silver Prices History (Fun Trading)
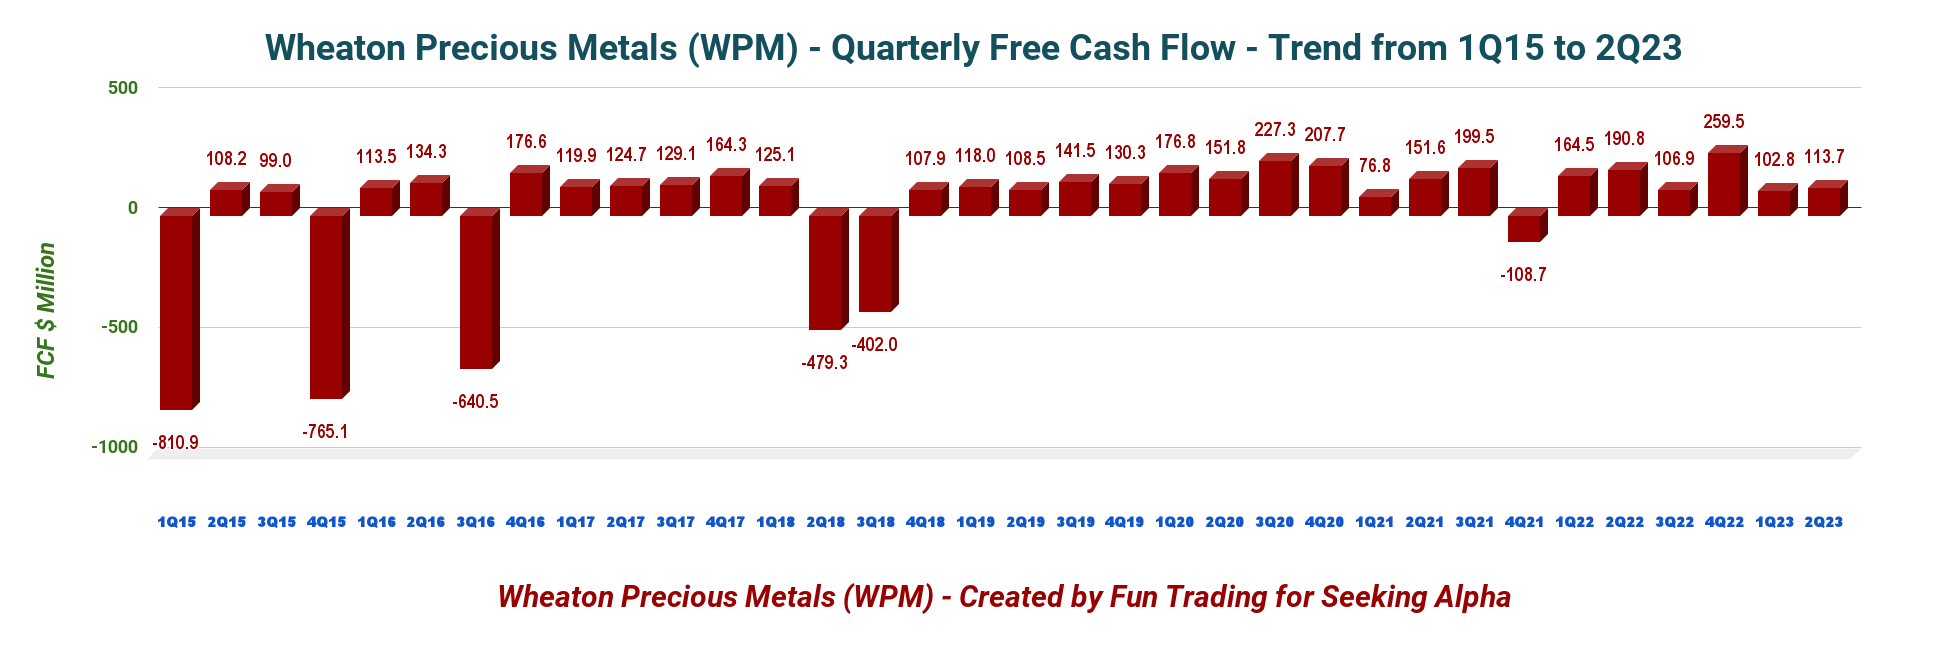
2 - Free cash flow was estimated at $113.67 million in 2Q23
WPM Quarterly Free Cash Flow History (Fun Trading)
On June 30, 2022, the trailing 12-month free cash flow ("FCF") was $582.88 million ; the second quarter of 2023 free cash flow was estimated at $113.67 million .
The Board of Directors declared a quarterly dividend of $0.15 per common share or a yield of 1.36% . The dividends are linked to operating cash flows.
Considering the balance sheet strength, I believe the quarterly dividend is too low and should be doubled at the minimum.
Warning: Wheaton Precious Metals is a Canadian company, and dividends are subject to Canadian tax (15%) taken directly for non-Canadian investors, reducing the amount paid to investors outside Canada. Please get in touch with your broker.
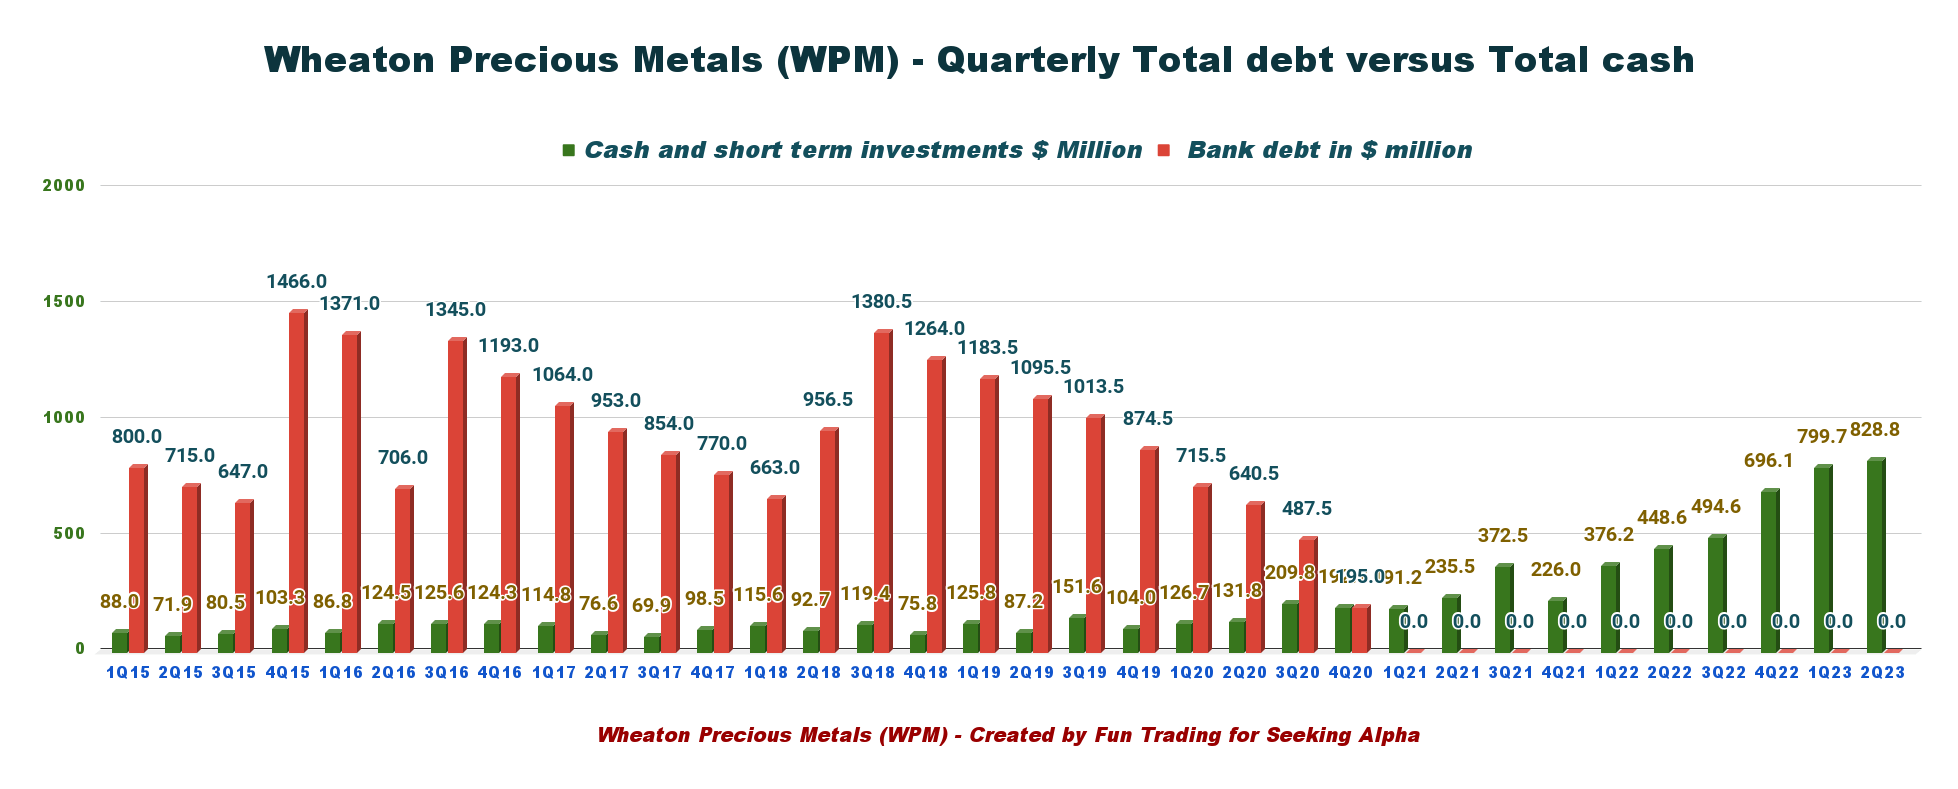
3 - Available capital, no debt, and $2.8 billion in liquidity
On June 30, 2023, Wheaton Precious Metals had cash and cash equivalents of $828.84 million and no debt outstanding under its Revolving Facility, which is excellent backing from a long-term investor's perspective. Cash position has been growing steadily since 2Q22 ($448.63 million).
The company has a $2 billion revolver facility extended again to June 22, 2028 . Total liquidity is now $2.83 billion .
The chart below shows a significant net cash position:
WPM Quarterly Cash versus Debt History (Fun Trading)
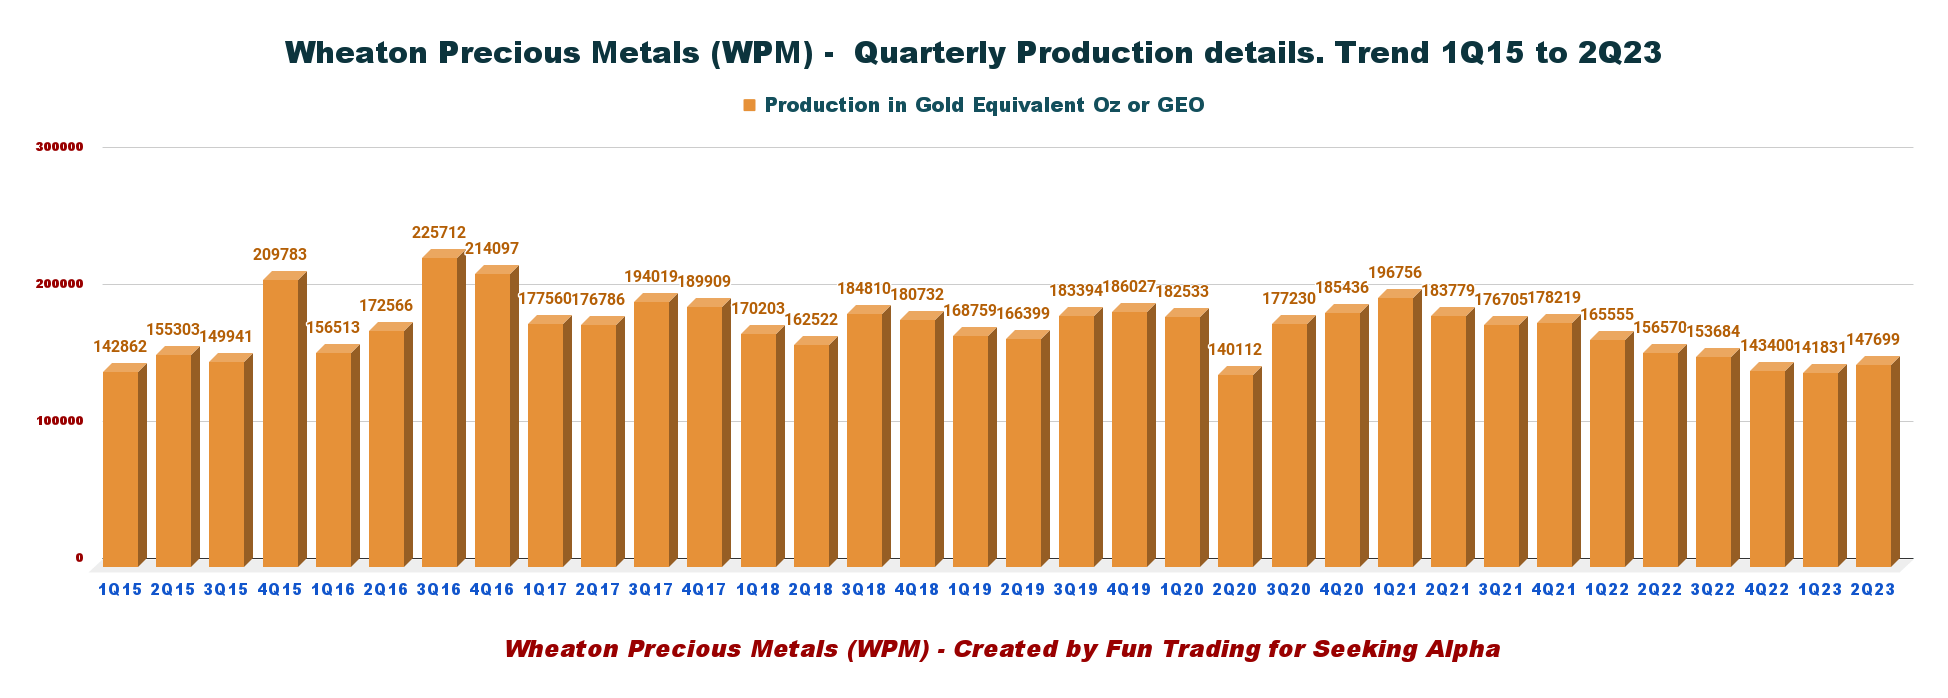
4 - Production in gold equivalent ounce and trend details
WPM Quarterly GEO Production History (Fun Trading)
This quarter's gold equivalent production was 147,699 GEOs compared to 156,570 GEOs last year. Furthermore, Wheaton sold only 138,835 GEOs this quarter.
In the second quarter of 2023, the Salobo mine produced 54,800 ounces of attributable gold, an increase of approximately 61% relative to the second quarter of 2022, driven by higher throughput and grades. It more than offset the lower production at the Peñasquito mine owned by Newmont Corp. ( NEM ), which reported that it had suspended operations at the Peñasquito mine due to another labor dispute.
Wheaton's metals production in 2Q23 was:
- 85,083 Au ounces.
- 4.417 M Ag ounces.
- 3,880 Pd ounces.
- 152 Lbs of Cobalt.
WPM Quarterly Gold to Silver Ratio History (Fun Trading) The gold/silver ratio is 1:82.3 this quarter (see chart above).
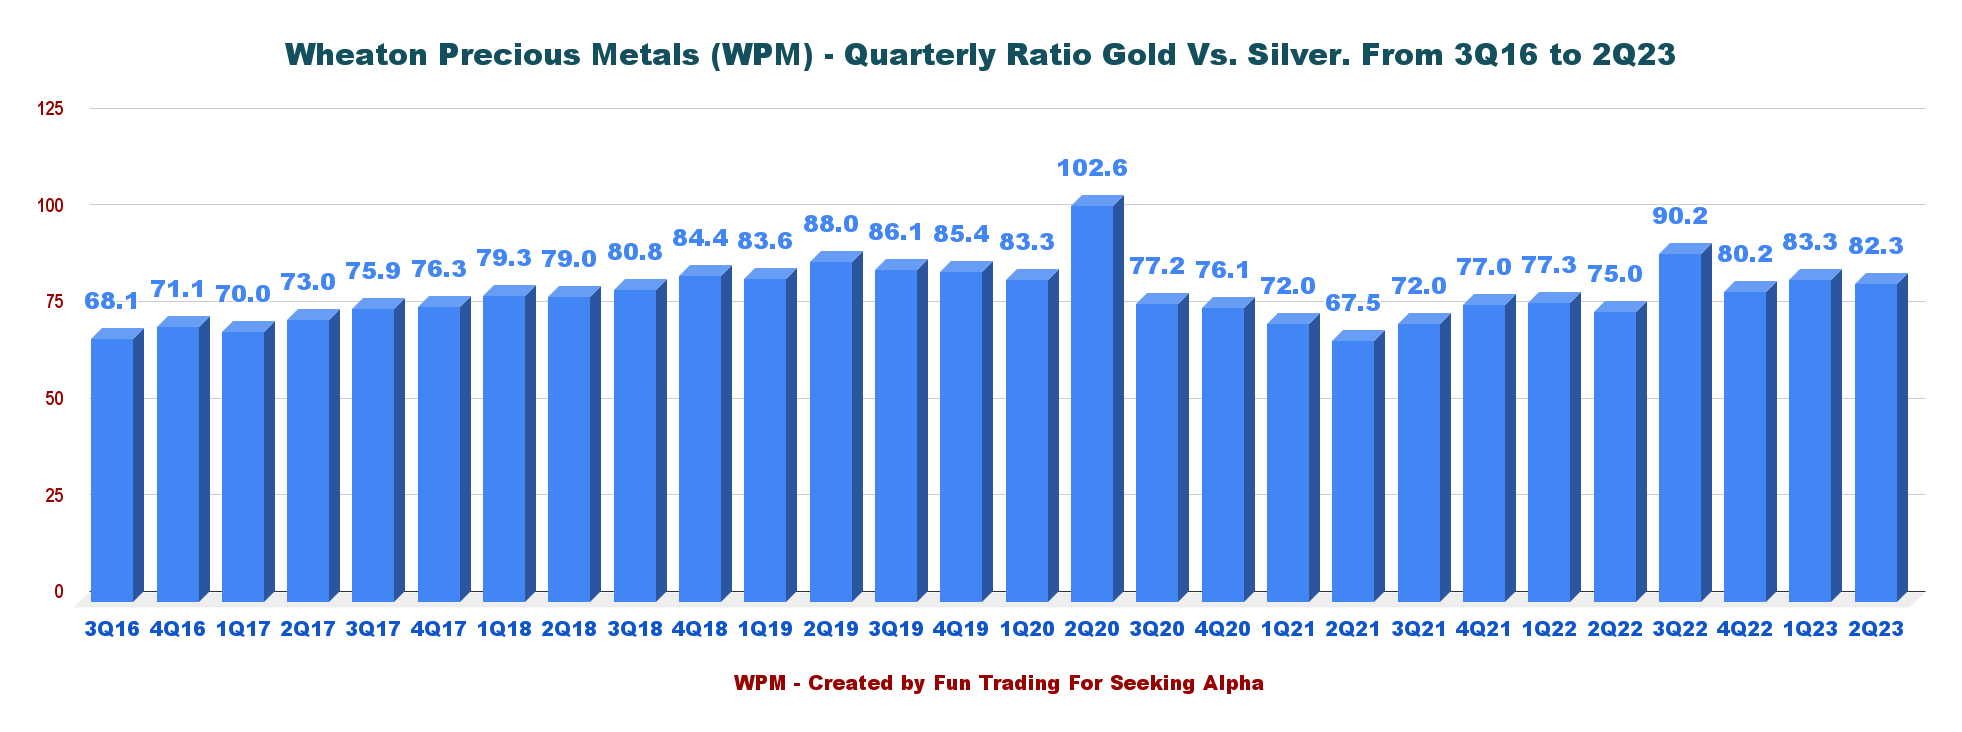
5 - 2023 Guidance unchanged from last quarter
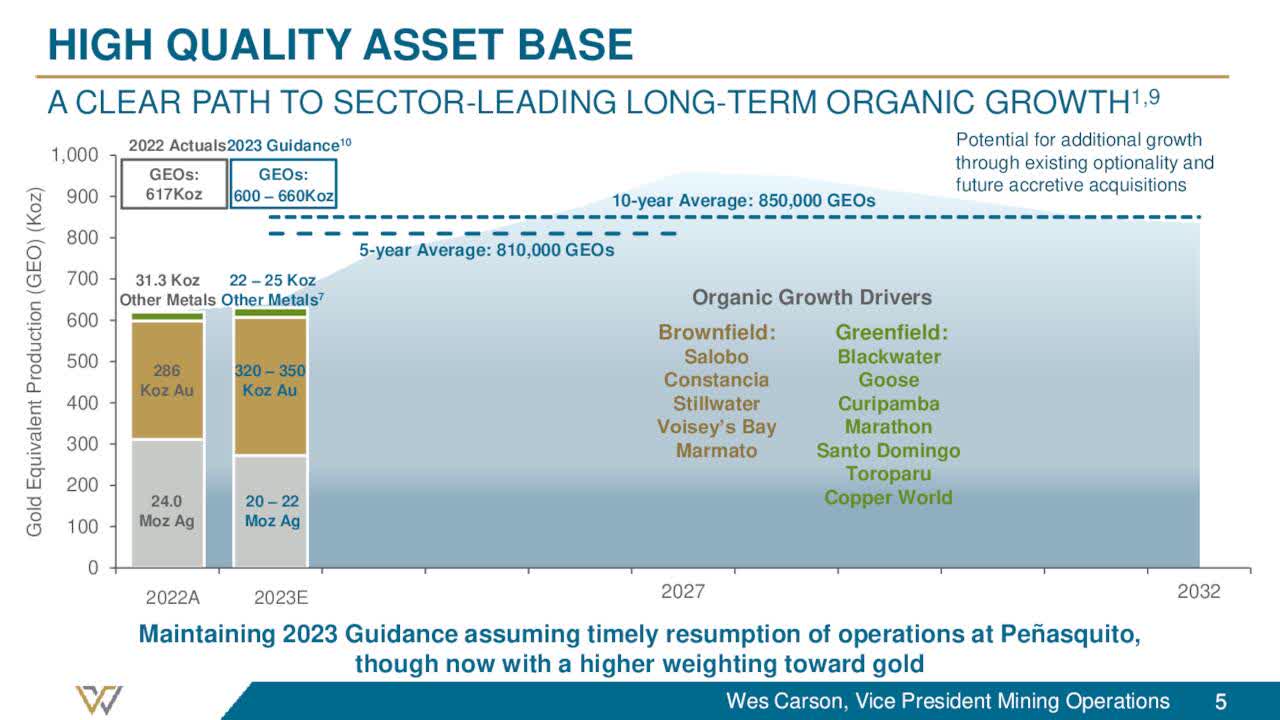
Wheaton's estimated attributable production for 2023 is forecast to be 320K to 350K ounces of gold , 20 to 22 million ounces of silver , and 22K to 25K gold equivalent ounces ("GEOs") of other metals, resulting in the production of approximately 600K to 660K GEOs .
WPM Guidance details (WPM Presentation)
Furthermore, Mining Operations Wes Carson said in the conference call:
Wheaton's estimated attributable production in 2023 is forecast to be approximately 600,000 to 660,000 gold equivalent ounces, unchanged from previous guidance, but predicated on Penasquito's restarting production in the end of the third quarter. For the five-year period ending in 2027, the company estimates that average annual production will amount to 810,000 gold equivalent ounces, and for the 10-year period ending in 2032, the company estimates the average annual production will amount to 850,000 gold equivalent ounces.
Technical Analysis and Commentary
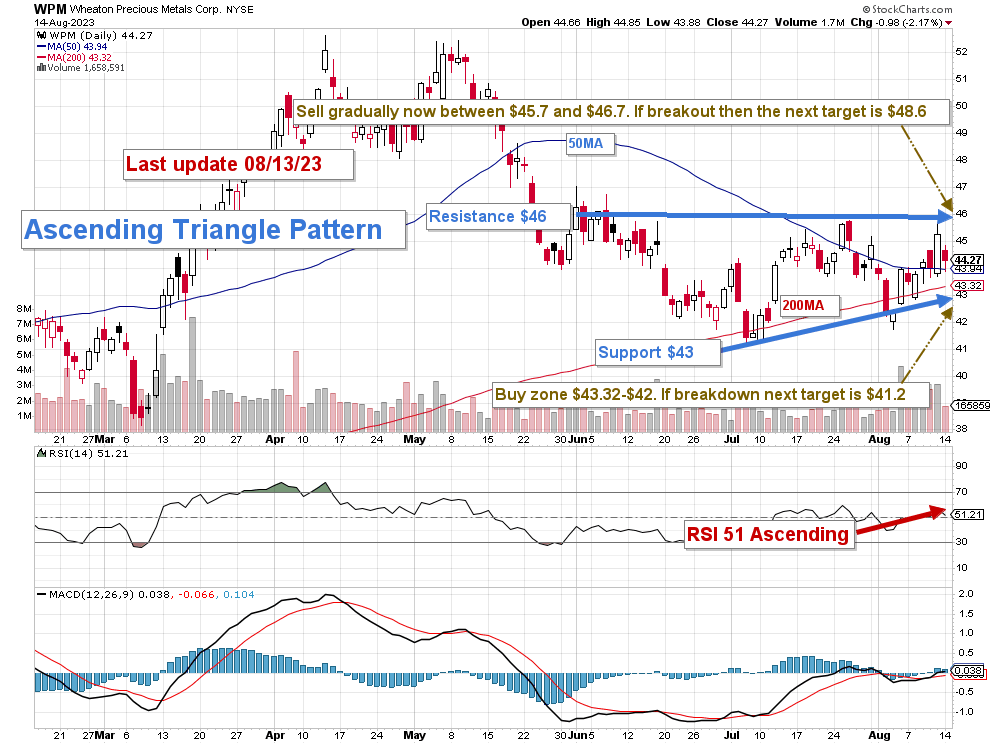
WPM TA Chart Short-term (Fun Trading StockCharts)
Note: The chart is adjusted for the dividend.
WPM forms a descending channel pattern with resistance at $46 and support at $43 .
The ascending triangle is a bullish formation that usually forms during an uptrend as a continuation pattern. There are instances when ascending triangles form as reversal patterns at the end of a downtrend, but they are typically continuation patterns. Regardless of where they form, ascending triangles are bullish patterns that indicate accumulation.
The strategy is to keep a core long-term position and use about 30%-40% to trade LIFO while waiting for a higher final price target for your core long-term position above $50 .
Trading LIFO allows you to sell your most recent purchases, assuming a profit while keeping your long-term position until it is up enough to consider selling it.
The trading strategy is to sell about 30%-40% of your position between $45.7 and $46.7 with potential higher resistance at $46.9 .
I believe it is safe to accumulate WPM between $42.3 and $41.20 , with a possible lower support of $41.2 .
Warning: The TA chart must be updated frequently to be relevant. It is what I am doing in my stock tracker. The chart above has a possible validity of about a week. Remember, the TA chart is a tool only to help you adopt the right strategy. It is not a way to foresee the future. No one and nothing can.
For further details see:
Wheaton Precious Metals: Salobo Made The Difference This Quarter