SGOL - Where Is Gold Going? Watch Sentiment Not Fundamentals
2023-11-14 11:06:55 ET
Summary
- Evidence shows that commonly cited fundamental drivers of gold's price such as inflation, the dollar, and Fed Policy are on shaky ground.
- The Socionomic Theory of Finance tells us sentiment drives gold prices.
- A review of gold trader positioning at the extremes demonstrates strong support for the theory.
- Current trader positioning doesn't provide a clear signal for gold's direction.
There have been many articles lately about gold. They usually include analysis of economic indicators, government and Fed policy, and geopolitical forces that will determine gold’s price. Typical narratives include:
- High inflation drives gold up; lower inflation dampens prices.
- A strong dollar is bad for gold; a weak dollar is good.
- Higher interest rates depress gold; lower rates help.
- Adverse geopolitical events and instability fuel gold gains; stable times make gold less attractive.
But are these really the causes of gold’s price movements? There have been many studies, some of which contradict each other. Answering the question with complete certainty is likely impossible. However, here I provide compelling facts in a relatively compact space to help clarify this mystery. My analysis is based on decades of accumulated research and a recent deep dive into this fascinating topic.
As someone trained in fundamental analysis in MBA school, I have to say the findings were eye-opening. The punchline for those in a hurry: sentiment at the extremes is the best predictor of gold’s price movements, not oft-cited fundamental factors.
Now let’s turn to what the data - not the pundits – tell us about the ancient metal’s price movements. We will explore each of the four narratives above.
Most of the Time There Hasn’t Been A Positive Correlation Between Inflation and Gold
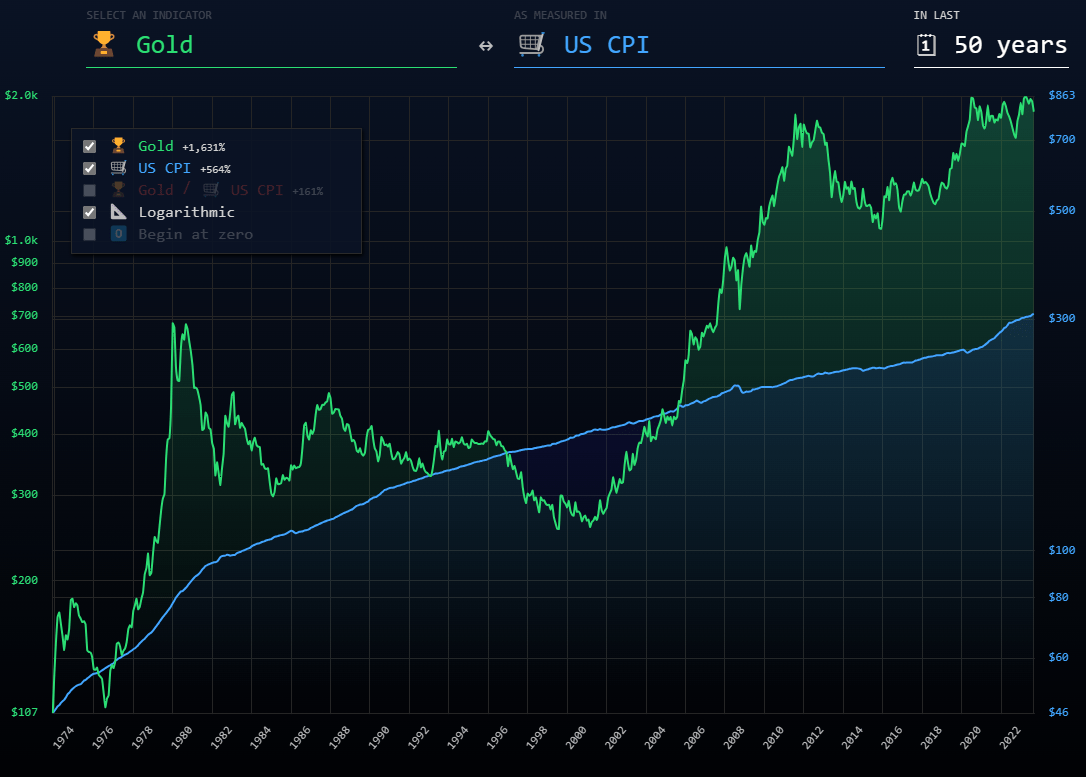
The 50-year chart below shows gold and inflation, as measured by the CPI. At a simplistic level one may conclude they both move upward. However, a more nuanced look reveals gold moves independently from inflation.
inflationchart.com
The most common period used to argue for inflation’s causative effect on gold is the 1970’s. Inflation that decade ran at 6.8% per year. Gold gained a whopping 28% per year, much of which occurred after Nixon removed the dollar from the gold standard in 1971.
If we dig deeper, “ Unpacking the Great Gold Performance of the 1970’s ” noted that gold and inflation had a correlation of 0.34 between 1967 and 1980. They add, “but after that time, the relationship between gold and inflation disappeared totally and the correlation measured -0.07.”
Indeed, gold inexorably declined from 1980 until its bottom in 1999. During this golden era for financial assets the CPI steadily rose, albeit at a modest rate. Yet, how could there be such a sustained period of negative correlation between metrics that are supposed to be positively correlated? Shouldn’t gold have at least tracked inflation by gaining modestly?
Moving forward in history, let’s consider the first decade of this century. Gold took off in 2000, moving from $221/oz. to over $2000/oz. by 2011. During that time CPI rose, but only at about 2.5% per year and on a similar trend line as in the 1990s. Why did gold increase nearly ten-fold over a sustained period when inflation was so quiescent?
More recently, at one point during 2022 inflation spiked up to an annualized rate of 8.5% and finished the full year at 6.5%. Recall this was a surprise event - the Fed repeatedly told us “inflation is transitory.” During this inflation outbreak gold essentially flatlined, gaining 0.44% in 2022.
Let’s turn to the statistical data. Evanson Asset Management cited a Wall Street Journal article from 2010:
Opdyke asked Ibbotson, a well-respected research organization and source of extensive asset class data to determine how closely inflation and gold-price movements track each other. The data, going back to 1978 and capturing an inflationary spike, show a correlation of at most 0.08%."
SA Analyst Kevin Mackie wrote an insightful piece, What Affects the Price of Gold: Conventional Wisdom vs. History . He cast further doubt about the correlation between gold and inflation:
…the trading patterns of gold relative to the consumer price index have been volatile. According to Forbes Advisor, the ratio of the price of gold to the consumer price index has averaged 3.6 since 1972. But as of May 2023, that ratio was closer to 6.4. If there was a direct correlation between inflation and the price of gold, that ratio would be more stable.”
Conclusion: Over the long-term gold outpaced inflation, proving a good inflation hedge. But it is a stretch to conclude that inflation drives gold prices.
The Relationship Between the Dollar and Gold is Inconsistent
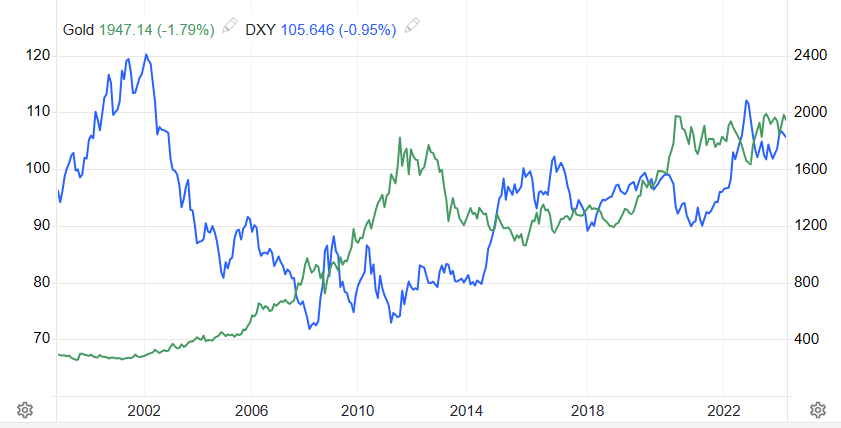
The 25-year chart below plots the dollar index and gold.
tradingeconomics.com
The DXY went from 95 in 1998 to 106 recently, a modest cumulative gain of about 12%. Meanwhile gold went from $221 to about $1950 as of this writing, a gain of 782%. That is certainly not a negative correlation.
Let’s consider some shorter time periods:
- The dollar rose dramatically from 2000-2002 while gold gently rose - a positive correlation.
- The dollar dropped dramatically (about a third) from 2003-2008 while gold rose moderately – a negative correlation, but not a corresponding degree of movement.
- Gold rose from 2008-2013 while the dollar was mostly flat - no correlation.
- Since 2015, the dollar and gold have both trended higher with some inverse movements in between – no consistent correlation.
These periods suggest a random relationship rather than a negatively correlated one.
Let’s look at actual correlation data. Evanson Asset Management , quoting a 2010 Wall Street Journal article, cites Ibbotson’s Research regarding the correlation of gold and the dollar:
However, back to 1973, a period that defines the modern non-gold backed dollar, the greenbacks’ movements closely track gold’s direction. Over the past 30 years, the correlation between the US dollar and gold is minus 0.65.”
This is the strongest data point I’ve found that supports the negative correlation argument.
Conclusion: The relationship between the dollar index and gold is inconsistent. At times there are negative and positive correlations. The data suggest the two variables often move independently, even for years at a time. The idea that gold is a currency, valued by investors on an independent basis from the dollar, is consistent with the data.
Gold Moved Inconsistently During Different Fed Policy Regimes
There is an abundance of commentary about how Fed policy influences gold. A common narrative goes something like this: “The Fed has paused rate hikes, so the prospect of lower rates is bullish for gold.”
Let’s look at the chart below to see if this thinking is valid.
Macro Micro
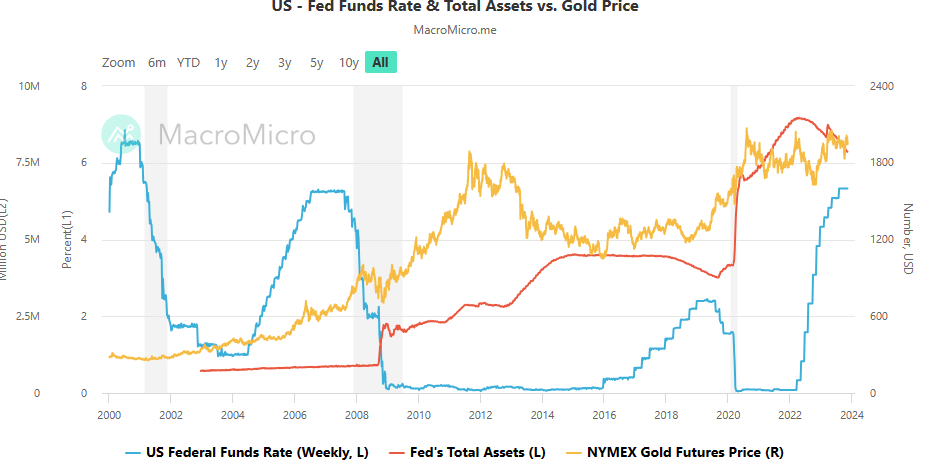
The chart data seriously undermine, if not refute, the idea that Fed policy was a key driver of gold prices over the past 23 years:
- In the aftermath of 9/11 from 2001-2004, the Fed dramatically cut rates, and gold moved modestly higher.
- During 2004-2008 the Fed hiked rates by about 400 basis points and the gold rally that was already underway accelerated - contrary to the common narrative.
- After 2008, the Fed cut rates to zero and implemented a massive Quantitative Easing (QE) program. Gold rallied – supporting the common narrative.
- Gold peaked in 2011. In the following years the Fed held rates near zero and unleashed another round of QE in 2012. Nonetheless, gold traders must have misunderstood what they were supposed to do. Gold declined nearly 50% by 2015.
- More recently the pandemic rate cuts and QE program of 2020-21 were associated with a gold rally – consistent with common wisdom.
All told, the last 23 years offers weak evidence of a consistent causal relationship between Fed policy and gold. Maybe those years were an abnormal time in history?
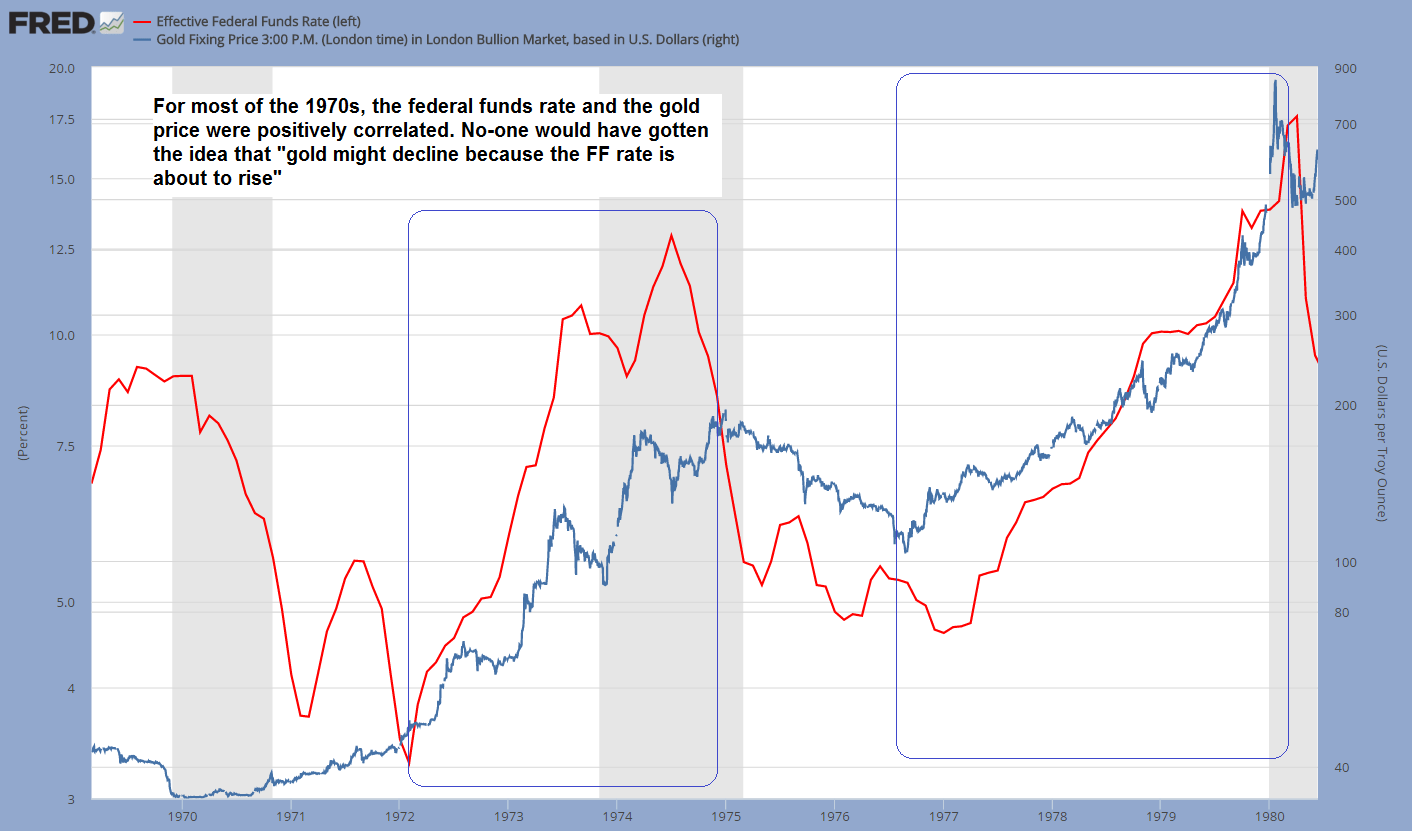
Consider that the 1980’s saw declining interest rates and a gold bear market. Even more striking is the 1970’s. Gold rose sharply as rates also moved higher . In fact, beginning in 1972 the chart below depicts a strong positive correlation between the Fed funds rate and gold!
Seeking Alpha, Gold and the Federal Funds Rate, Dec 2015
Conclusion: Investopedia sums it up very well:
Ultimately, the relationship between gold prices and interest rates is uncertain and unstable because gold is traded on a global market subject to forces far beyond the reach of the Federal Reserve.'
Most Evidence Suggests Gold is a Safe-Haven Asset, But There Are Contrary Findings
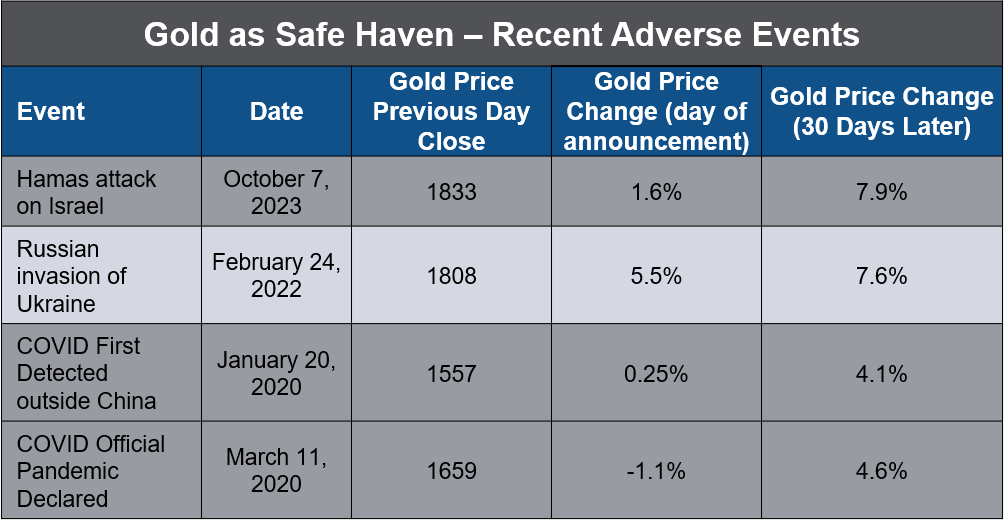
For simplicity, let’s begin by looking at how gold performed at the onset of recent major adverse world events.
Author, New York Times, bullion-rates.com
This supports the idea of gold as a safe-haven asset. Note that the onset of COVID-19 is difficult to pin down. Signs of the virus appeared in China in December 2019. News leaked out gradually. In the table we cited two key events, but neither immediately ignited gold. Curiously, on the day the World Health Organization declared COVID an official pandemic, gold declined. But the metal was significantly higher 30 days after each event. The paper, “ Is Gold a Hedge or Safe-Haven Asset in the COVID-19 Crisis? ,” concluded gold moved in and out of safe-haven status in phases.
Nonetheless we shouldn’t be quick to draw conclusions from such a small sampling of events. Let’s dig deeper.
Another Science Direct paper, “ The Gold Market as a Safe Haven Against the Stock Market Uncertainty: Evidence from Geopolitical Risk ,” states:
Gold appears to be a safe-haven asset during periods of intense political tension, prompting investors to adopt active strategies based on long-term persistence and geopolitical shocks.”
The paper also made some interesting comments about investor sentiment that tie into our discussion below:
The theoretical orientation toward dealing with the effect of armed conflicts and terrorist attacks on stock markets has been developed more specifically through investor sentiment. When considering terrorist attacks as an indicator of mood, this reflects in deteriorated investor sentiment, which in turn leads to lower prices on the financial markets.”
Returning to the COVID paper, it presented key findings from various studies covering longer timeframes and different markets (table 1).
Science Direct, Is Gold a Hedge or Safe Haven Asset in the COVID-19 Crisis?
While most of the studies supported the idea of gold as a safe-haven, there were conflicting findings:
- A study by Baur and McDermott in 2010, covering the period 1979-2009 said gold acts as a hedge and safe-haven for the US and major European stock markets but not for Australia, Canada, Japan and large emerging markets.
- A study by Shahzad et al covering 2010-2018 concluded that gold acts as a weak safe-haven asset for advanced and emerging stock markets.
- A study by Baur and Smales in 2020 covering the period 1985-2015 concluded that gold does not act as a safe-haven asset for G7 stock and bond markets.
So there you have it – gold is a safe-haven asset for some markets, a weak safe-haven for some markets, and not a safe-haven for some markets, and it depends on the time frame . Clear as mud!
Conclusion: There is substantial evidence that gold is a safe-haven asset, but the relationship is variable across time frames, markets and events. However, the relationship between adverse events and sentiment lends support to gold as a safe-haven asset.
The Most Compelling Evidence Regarding Gold Price Movements - Sentiment
Several years ago, I read Robert Prechter’s “The Socionomic Theory of Finance.” I credit Avi Gilburt for flagging this book as a must read for serious investors. He has also written much about this topic on SA.
Prechter stated:
“By far most speculators lose money, and they lose lots of it.”
However, he drew an important distinction between types of commodities traders:
The Commodity Futures Trading Commission follows the activity of three distinct groups of participants in the commodity markets: small speculators, large speculators and commercials. Small speculators are typically on the wrong side of the market at the turns. You think that the large speculators, because they have a lot more money, are right a lot, but they are likewise usually wrong at the turns. Commercials are the only participants in commodity markets who generally buy low and sell high.”
Prechter says that in financial markets unconscious herding and sentiment explain price movements, not economics or fundamentals, as many believe. An “infinitesimal few” speculators who have learned to operate independently from the herd are the exceptions who make money.
Space doesn’t permit a full discussion of the dichotomy between financial (speculative) and economic thinking that Prechter explains. However, here is a useful excerpt:
As noted in Chapter 13, our financial/economic dichotomy explains the reason: Commercials are in the business of manufacturing, not speculating, so they think economically rather than financially. They do not perceive commodities as investment items, so they are not participating in the herd. They perceive commodities as economic goods, so they search out bargains, just as a consumer does in a store. As a result, they are comfortable taking the other side of a trade from speculators at market extremes. If they think a price is exceptionally low, they might even buy futures contracts to lock in the current price and they may sell excess contracts later at a high price.”
Armed with this theory, I decided to test it with actual data. Below we review the track record of gold futures speculators and commercial traders when sentiment is at extremes. The results are fascinating, if not amazing.
Testing the Prechter Theory: What the Charts Tell Us
Each Friday the Commitment of Traders (COT) Report provides charts showing the net long and short gold futures positions for non-commercial (speculators) and commercial traders. Recent history shows that most of the time speculators are net long and commercials are net short. The latter may be explained by producers hedging their production to ensure profitable revenue streams.
The 10-year COT chart below reveals a fascinating discovery:
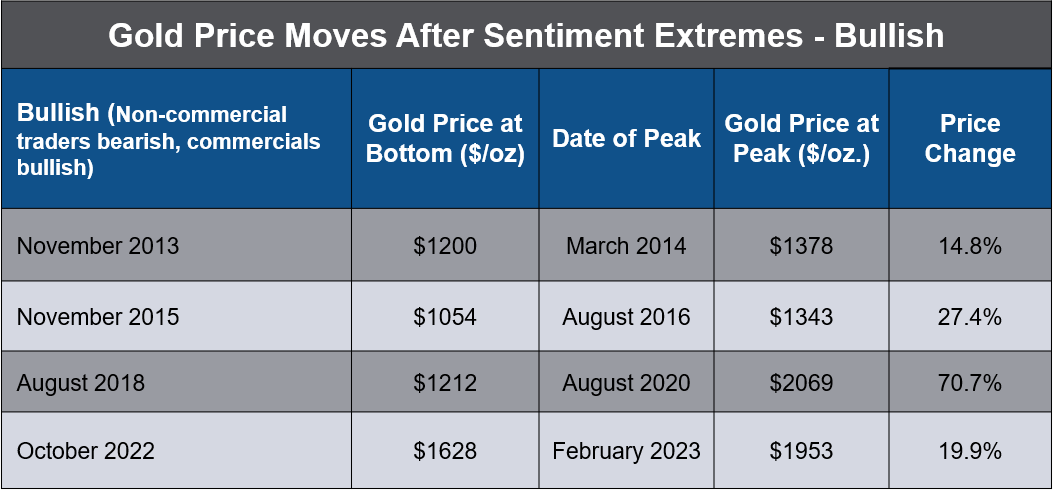
When the speculators (non-commercial traders) moved to bearish extremes (the blue line near zero) and the commercials moved to bullish extremes (black line near zero), gold made a significant bottom.
tradingster.com
This occurred in 2013, 2015, 2018 and 2022 as indicated by the green arrows. Every time that happened, gold subsequently rallied.
Author, bullion-rates.com
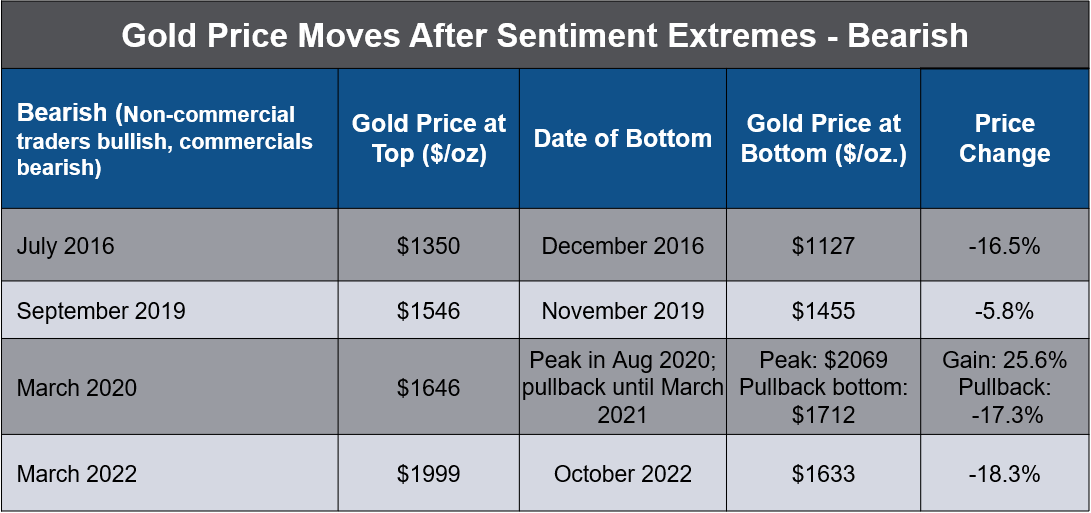
What happened at extremes when traders were highly bullish and commercials highly bearish (red arrows)? The table below shows that again sentiment was a useful indicator. The commercials were usually right at market peaks and the speculators were usually wrong.
Author, bullion-rates.com
A significant exception was March 2020, during the pandemic. Bullish traders were correct while the commercials were unduly bearish. Gold continued to rally until peaking in August 2020. However, gold subsequently declined 17% by March 2021. The false signal from the commercials might be explained by their desire to ensure cash flows to fund operations at the onset of the pandemic. Due to lockdowns, miners were unable to carry on operations at usual production levels, forfeiting revenue.
The results are impressive. Indeed, speculator sentiment alone proved to be a useful contrarian indicator. And the commercial traders proved to be the smart money - as Prechter surmised. That group acted on an economic rather than a speculative basis. When both groups reached extreme and opposite sentiment positions, the data proved a reliable indicator of gold’s future direction.
Yet, we must note that statisticians would tell us we cannot draw reliable conclusions from such a small sample. It would be interesting to analyze more data over a longer time frame to see if this relationship has been persistent.
What Sentiment Tells Us Now
Let’s turn to current trader positioning to see if it tells us anything.
tradingster.com
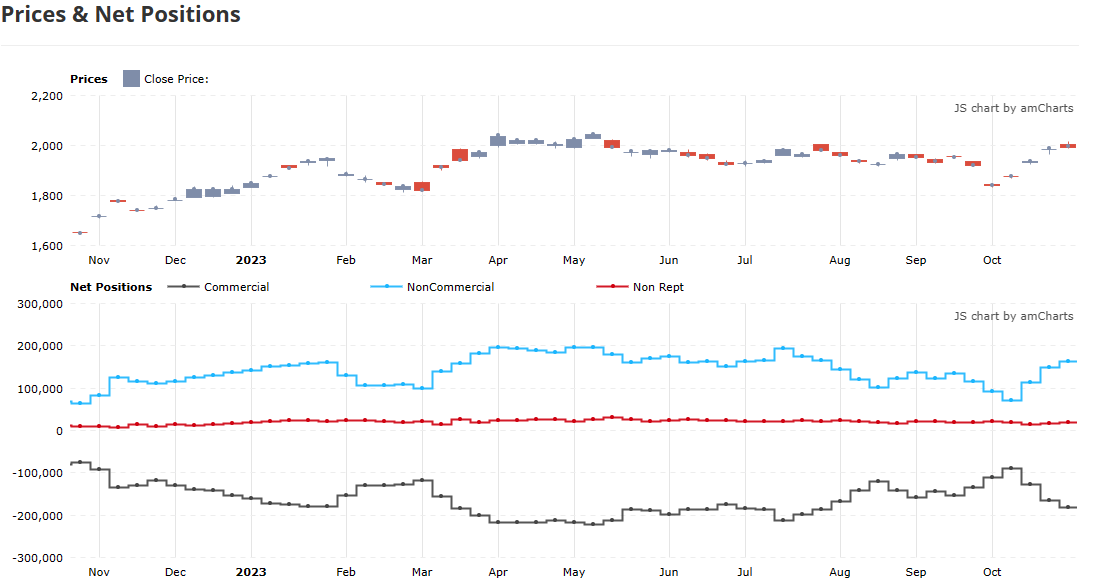
The recent 12-month chart shows that commercial and non-commercial trader sentiment has been diverging in a new direction since October. Producers have been increasing their net short positions while the speculators have been increasing net longs. At past extremes, this signaled a bearish condition.
However, the non-commercial level of 165K net longs is not extreme by historical standards. Nor is the commercials’ net short amount of 188K. For example, at the last major bearish divergence in March 2022, the speculators were long 248K and the commercials short 281K. This makes it hard to draw conclusions right now. It will be interesting to see how this unfolds.
Limitations and Risks
In my view, despite its usefulness, it is risky to use this as a short-term trading tool. We have too few data points. It is easy to see extremes retrospectively on a chart, but in real-time one must judge what constitutes an extreme. Also, price bottoms and tops didn’t correspond to the chart peaks and valleys to the exact day.
Gold is an Important Component of an All-Weather Portfolio
I am not a market timer nor chart reader. Those who follow me know I utilize an all-weather portfolio investment approach. As such, gold is a core holding in my portfolio. I explained why in my all-weather portfolio SA articles . I have been long gold for many years and will continue to do so. Since 1971 gold returned 7.8% per year and has provided useful portfolio diversification.
Last year I presented why gold could reach $5,000 in three to six years. I cited the monetary stock as a factor that could justify a much higher gold price. I also showed the Dow to Gold ratio, another sentiment measure that favors gold.
For those who want to go deeper on the topic of sentiment indicators, you may wish to consult the top Elliott Wave practitioners. I follow Avi Gilburt, who recently published this piece on gold.
Conclusion
The common narratives on what drives the price of gold prove to be on shaky ground, if not outright wrong in many cases. Investors are better served to seek out gold sentiment measures such as the COT report for more reliable clues as to gold’s direction. For long-term investors who want an all-weather portfolio, gold serves an important role.
I look forward to your comments.
For further details see:
Where Is Gold Going? Watch Sentiment, Not Fundamentals