CIFR - Where We See Crypto Mining Stocks Headed
2023-10-09 16:19:28 ET
Summary
- Crypto mining stocks have lost between 56%-64% of their value in under three months, while BTC has dropped 21.75%.
- Stocks have reached oversold levels, but are not considered investable. However, there may be potential for high return swing trades.
- The earnings of crypto mining businesses are correlated to the market prices of Bitcoin, and the industry is currently not profitable.
This article will compare, from a technical perspective, a few of the crypto mining stocks we follow closely at Crypto Waves. Specifically, we will take a look at (RIOT), (MARA), (CIFR), (CLSK), (HUT), (BITF), (HIVE), and (BTBT).
Since the summer highs, stock prices in the above list have lost between 56%-64% of their value from peak to (current) trough, in under three months! In roughly the same time frame, BTC has dropped 21.75% (from peak to (current) trough).
From a technical standpoint observing key oscillators, this class of stocks has reached very oversold levels, but are they investable? In our view on that matter, no. However, that does not mean the same as us ruling out the prospect of some very high return swing trades developing to the upside. In their current patterns, we view upside trades as quite speculative but we will lay out conditions for a prospective more attractive upside setup in a few of the miners.
The business of crypto mining is essentially companies hoping to capture the surplus value from generating newly minted coins vs. the cost of “mining” the block, which would convey to the “miner” newly minted coins as a reward. The costs consist of investment in capital expenditure in “Mining Rigs,” which are dedicated computer systems designed to perform the complex calculations required for mining. These rigs consist of multiple high-performance graphics processing units (GPUs) or application-specific integrated circuits (ASICs) that can handle the intense computational workload. The main operating cost is the power required to perform the computational workload.
Bitcoin (BTC-USD) undergoes a halving cycle roughly every four years. The event is referred to as a “halving” because when it takes place, the reward for each block mined is reduced to half of what it was preceding the event. The next expected halving is roughly six months away. Though we will not provide a deep dive into performance metrics of this industry, at the current BTC price and mining reward, this is not a profitable industry.
Much like precious metals miners, the earnings of these crypto mining businesses are strongly correlated to market prices in the underlying commodity being mined, in this case, we are primarily talking about Bitcoin.
Our thesis on BTC remains bullish. Fibonacci support ranges down to the $20k region, and so long as no sustained or meaningful break below this region develops, our confident expectation is for BTC to climb to the $40k-$49k region. Though I have less conviction about BTC moving directly above the 2021 high, and into $100k+ territory, without any breaks below the 2022 low, a technical setup has emerged for this prospect.
That said, while the thesis in BTC is more confidently bullish, especially in the long run, in which we do have strong conviction about moves well north of $100k, we can’t convey a strong investment grade thesis for the miners.
From a technical standpoint, though most miners had enormous gains from the pandemic lows into all-time highs and have held higher lows in the retrace into last year’s low, the patterns do not convey any confident prospect of reaching new all-time highs. Similarly, though the bounces from the 2022 lows into this year’s high have produced staggering gains, the patterns do not convey a confident prospect of exceeding the 2023 highs, let alone all-time highs.
The only positive aspects to report are that:
-
the charts are very oversold (but certainly can continue to become more oversold) and
-
(more importantly) some of these charts are displaying very corrective patterns in their declines off the 2023 highs. This is suggestive of these securities prospectively holding a higher low (above the 2022 low) and forming another rally segment to exceed the 2023 highs but without confidence to reach or exceed the all-time highs.
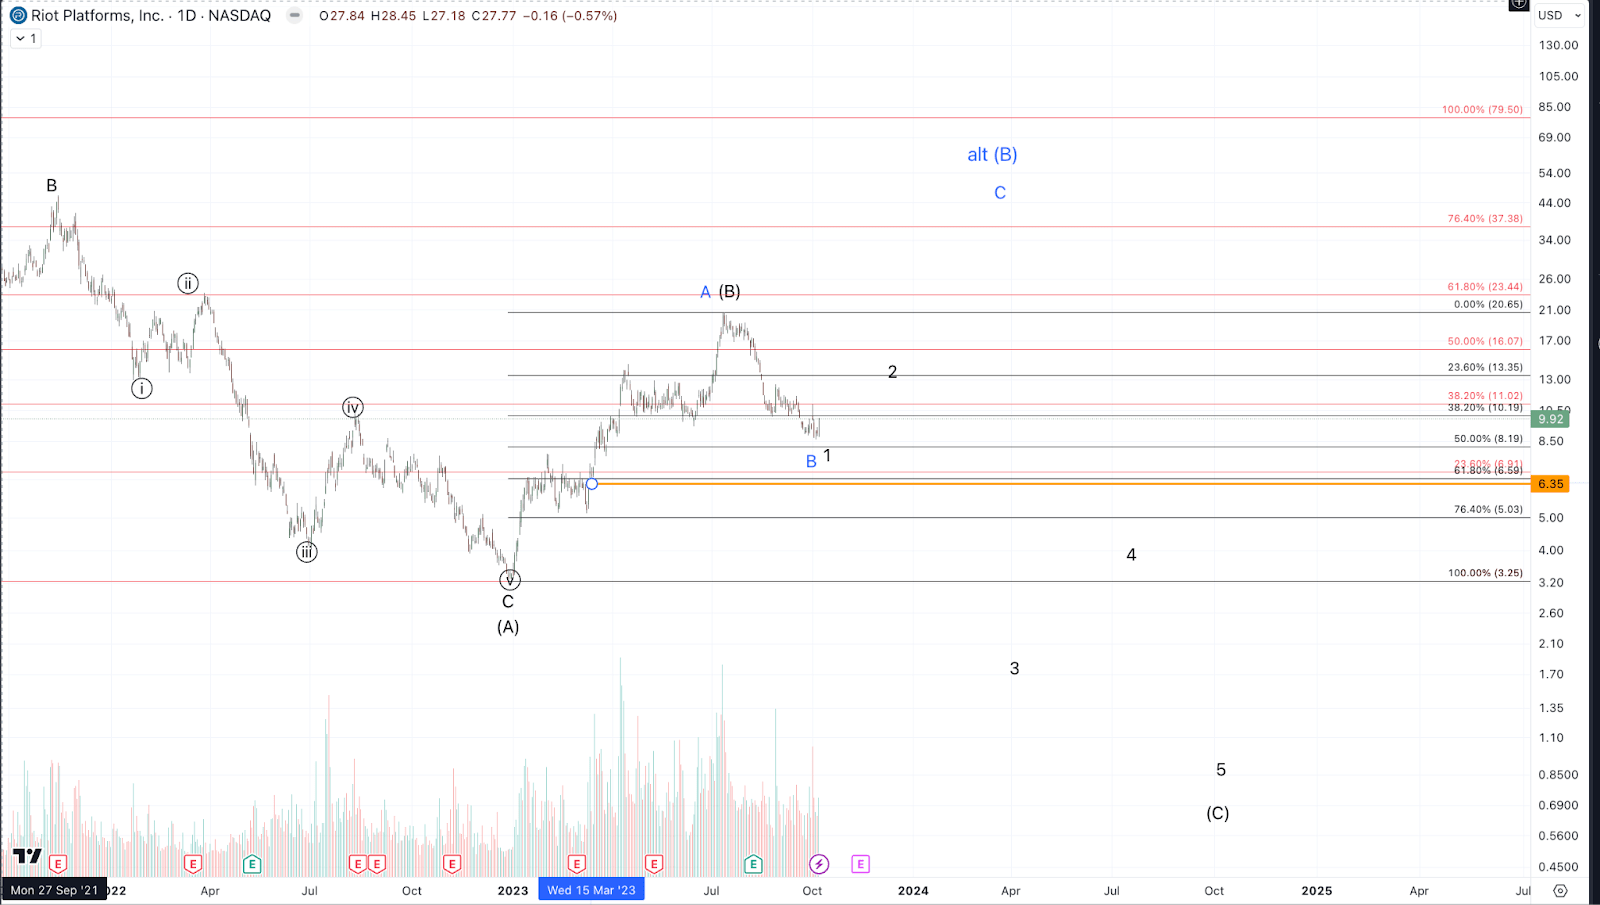
In the group with corrective decline patterns are the following tickers: MARA and CIFR. On the other hand, there are RIOT, HIVE, and BTBT. These all appear to have formed impulses from the summer highs which is very challenging to a prospective sustained bullish thesis, beyond a dead cat bounce. What’s particularly peculiar with RIOT and BTBT is that, while these have retraced considerably less of their rallies from last year’s low (while their patterns are most suggestive of downside follow-through), which sends a mixed message of sorts.
Of the remaining names mentioned near the heading of the article, HUT and BITF have patterns that appear to favor general downside continuation (with some corrective bounces) but that are less clearly impulsive to the downside. BITF possibly has 5 waves down already, but another corrective bounce followed by a lower low would make that pattern significantly more resolute (see below).
Lastly, we have CLSK. CLSK still has just three waves down from this summer’s high but is developing a potential impulse to the downside. Nevertheless, if price maintains above the 61.8% Fibonacci retrace and takes out some key resistance, a setup to the upside for considerable gains should not yet be ruled out.
Regarding all of the aforementioned names: Every single one is still maintaining its 61.8% retracement of the rally from the 2022 low into the summer 2023 highs (See charts below). So long as price is above those key levels, I can’t get strongly bearish. However, I do want to distinguish between those that are currently providing stronger signals of caution (RIOT, HIVE, and BTBT) and those that are better candidates, from an Elliott Wave perspective, for bigger bull runs in late 2023 and early 2024 (MARA and CIFR).
In summary, in the current posture, MARA and CIFR appear the least bad, even though MARA’s retrace is towards the larger end of the spectrum. All that said, a corrective decline is not sufficient, in our view, to start speculating with some positive expected value on the long side. What will be needed are micro impulsive rallies through resistance. Below we will review in detail some general conditions regarding price fluctuations in the coming weeks that would enable bullish setups to develop in MARA and CIFR. Though we’re skeptical about CLSK we have included it as well as the bullish potential is still intact albeit more farfetched.
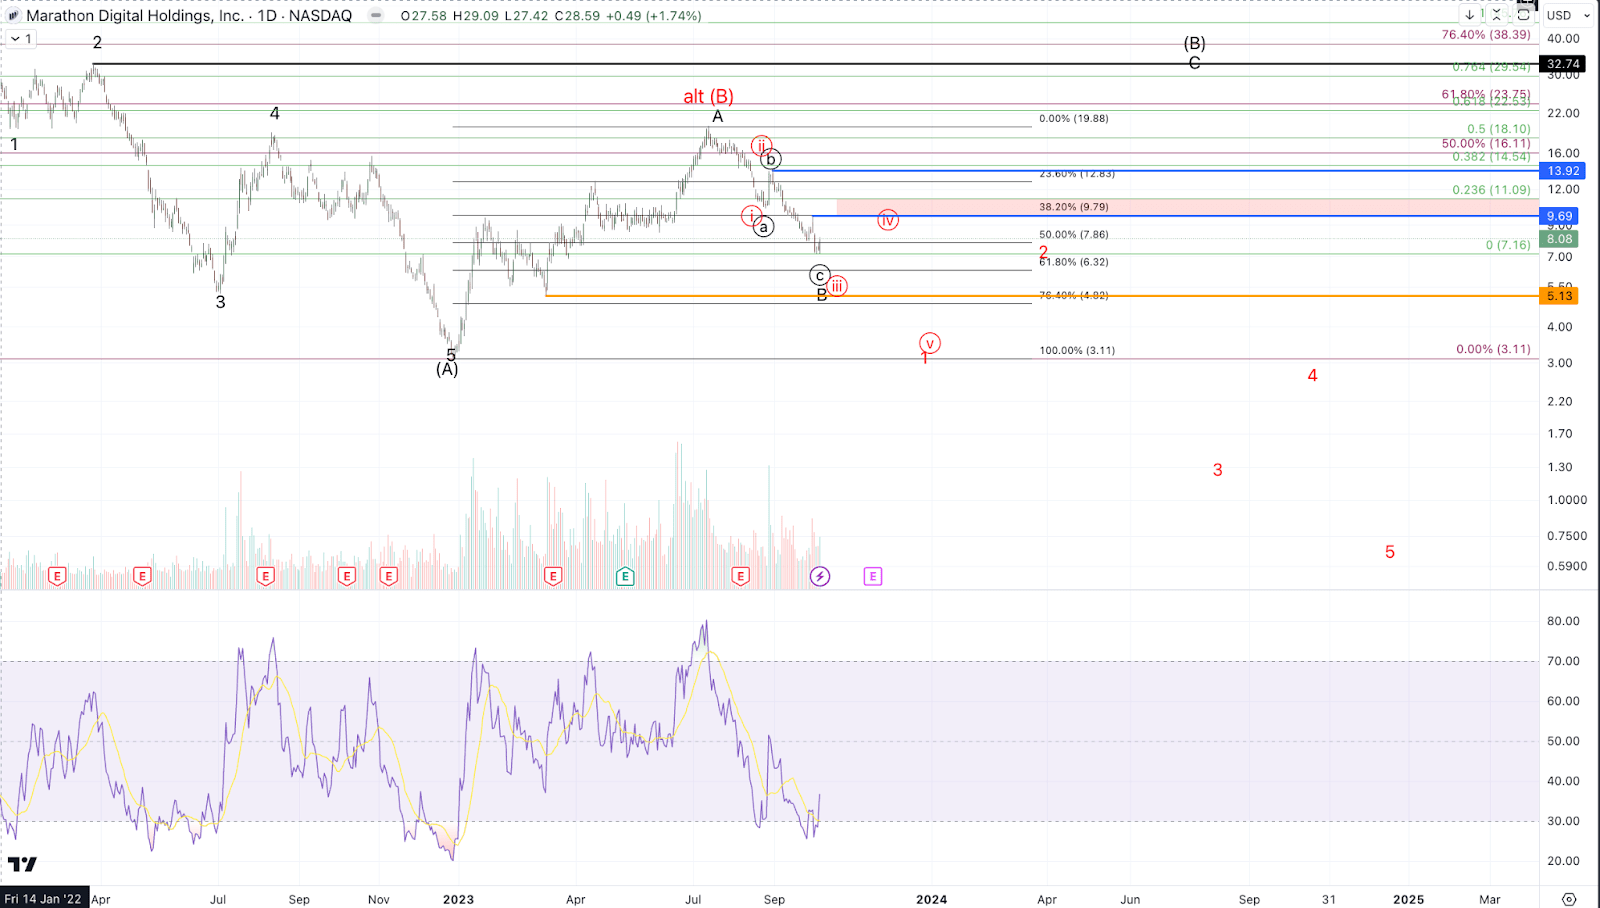
MARA (Marathon Digital Holdings, Inc.)
From the low near the end of 2022 to the 2023 high, MARA stock gained 540% and is currently (as of this writing) up 160%. From an Elliott Wave pattern perspective, MARA is interpreted to be forming a larger corrective move, in which the initial portion completed into the summer highs. The correction since then appears to be forming a higher low to set up a move to $32+ to test the March 2022 high. (Shown with the black labels on the accompanying chart)
As stated above, this is not a high confidence forecast (yet), but should price maintain support in a corrective decline and then develop impulsively to the upside from above $5~, a move to $32 is the preferred interpretation. The alternative thesis (displayed in red) is that price has completed its corrective bounce off the 2022 low and is starting a larger decline to under $2.
At a micro level, a move meaningfully over $9.70 is needed to establish at least a temporary low in place. That said, Fibonacci resistance for downside continuation sits between $10-$11.10. Ultimately, to become more confidently bullish from the current low, we’ll need to see a 5 wave rally up through the late August high of $14. Should such a move develop, I would consider pullbacks possible buying opportunities for a rally to $32-plus. Key levels to watch, should price decline further, are $6.32, which is the key Fibonacci 61.8% retrace, and $5.13, which is the March temporary low from which price launched. Sustained breaks below these levels reduce odds of upside continuation as per the black count.
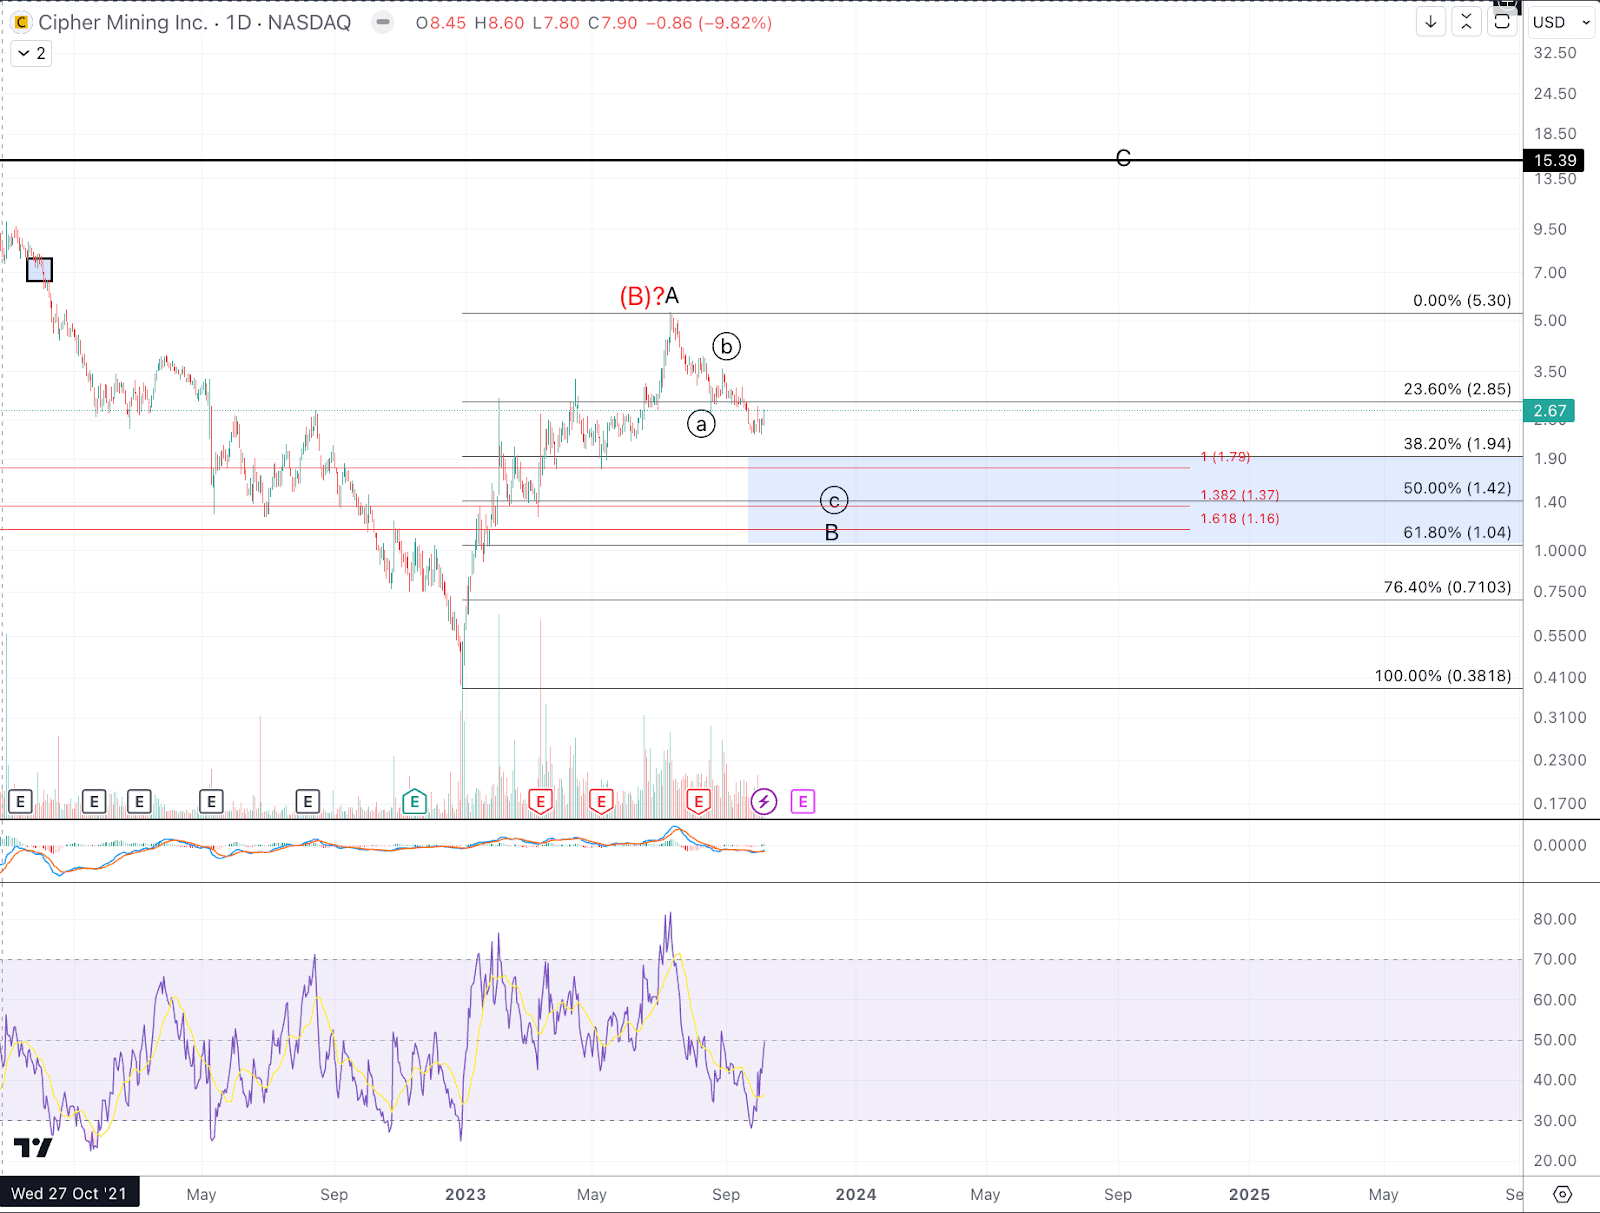
CIFR (Cipher Mining Inc.)
Cipher has so far produced the most shallow retrace of the bunch.
From the low near the end of 2022 to the 2023 high, CIFR stock gained 1288% and is currently (as of writing) up 600% from the 2022 low.
From a technical perspective (displayed in the black-lettered labels in the accompanying chart), Cipher appears to be forming a larger bounce in which the initial portion completed into the summer highs and with price pulling back correctively to form a higher low. Thus far, CIFR has retraced the least of its rally in the first half of the year, not yet having reached the key 38.2% Fibonacci retracement level. It’s reasonably likely that while price remains below $3.15, CIFR can see further extension downward into key confluence support in the $1.25-$1.80 region. That said, so long as price does not make a sustained break below $1, a rally back up to test near the all-time high at $15.39 looks like a viable prospect. All that said, for a confident set up to trade to the long side, traders will want to see a price turn up impulsively from the Fibonacci support region (roughly $1-$1.95) and take out some resistance. Considering that this decline from the July high still appears incomplete, we do not yet have key resistance levels to take out to establish a prospective low in place.
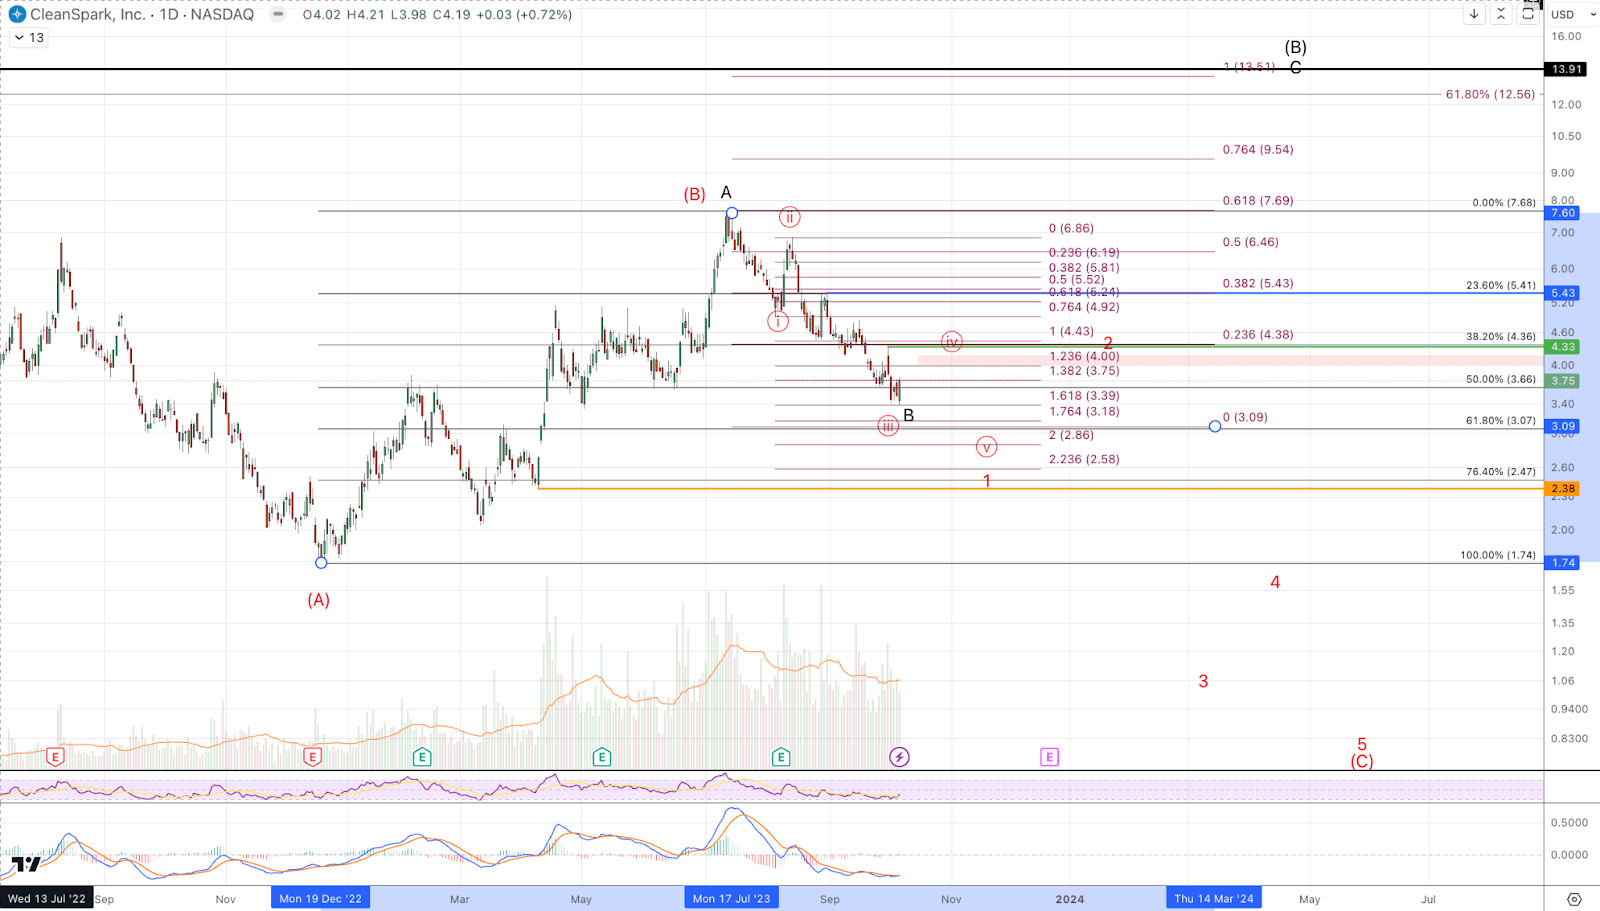
CLSK (CleanSpark, Inc.)
From the low near the end of 2022 to the 2023 high, CLSK stock gained 340% and is currently (as of writing) up 115%. The action counts best as 3 waves up which does not provide a high confidence prospect for upwards continuation. However, so far CLSK only has three waves down into Fibonacci support, which keeps alive the potential for another segment up to form a larger corrective move. Specifically, this entails a large degree 3 wave move in which the initial wave completed into the summer highs and price forming a higher low to set up a move to around $14 to test the March 2022 high. (This prospective path is displayed in black on the accompanying chart.)
As stated above, this is not a high confidence forecast (yet), but should price maintain support in a corrective decline and then develop impulsively to the upside from above $3~, a move to $14 ($13.91) is the preferred scenario though we should note this is even more speculative than with MARA. The alternative thesis (displayed in red) is that price has completed its corrective bounce off the 2022 low and is starting a larger decline to under $1.
Though the broad strokes appear set up like MARA, CLSK is in a more concerning posture. Though the decline down from the July high is still just three waves, the move is setting up more impulsively to the downside which is cause for concern to those entertaining a possible trade to the upside. On the micro level, it’s reasonable that the bounce from last week’s low continues higher and $4-$4.20 is the resistance region to watch. Should price rally correctively to resistance and then produce a lower low under $2.85, price will have a 5 wave impulsive decline from the summer highs, which suggests downside continuation as per the red count to become the favored perspective.
For the bullish case to assert itself, ideally, the low is in or perhaps one more low early this week that maintains the 61.8% Fibonacci retracement around $3 ($3.07). For a more advantageous long side setup, we will want to see an impulsive rally that resoundingly exceeds $4.33 with follow through above $5.45. At that point we’d see pullbacks as potential buying opportunities for a more reasonable prospective rally to $14.
More charts below (RIOT, HIVE, HUT, BTBT, BITF)
RIOT
HIVE
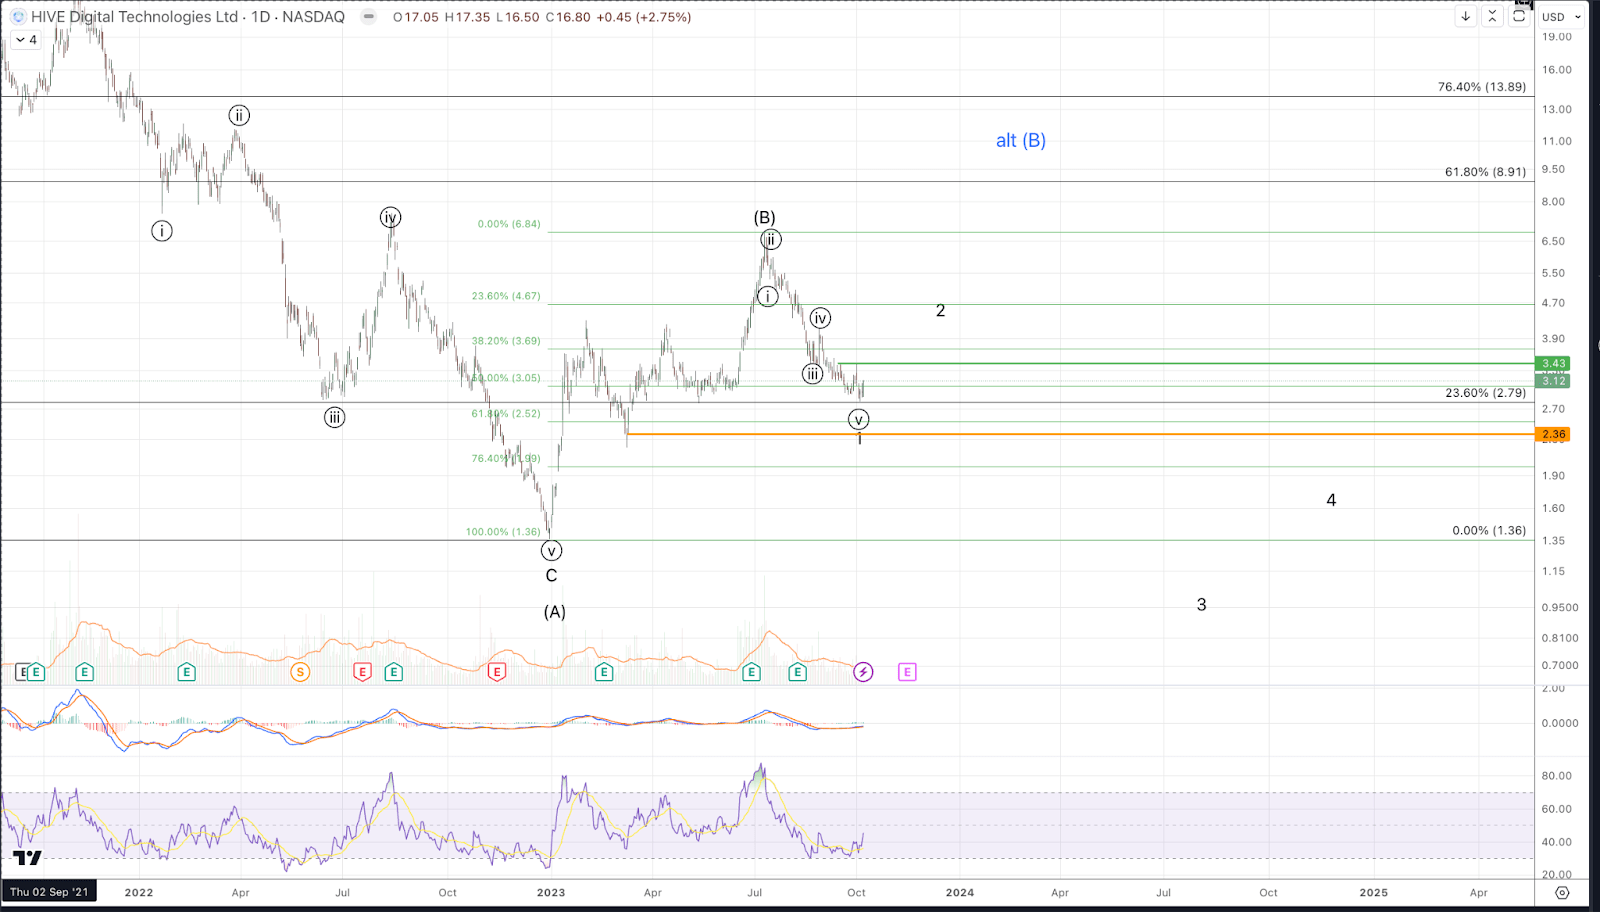
HUT
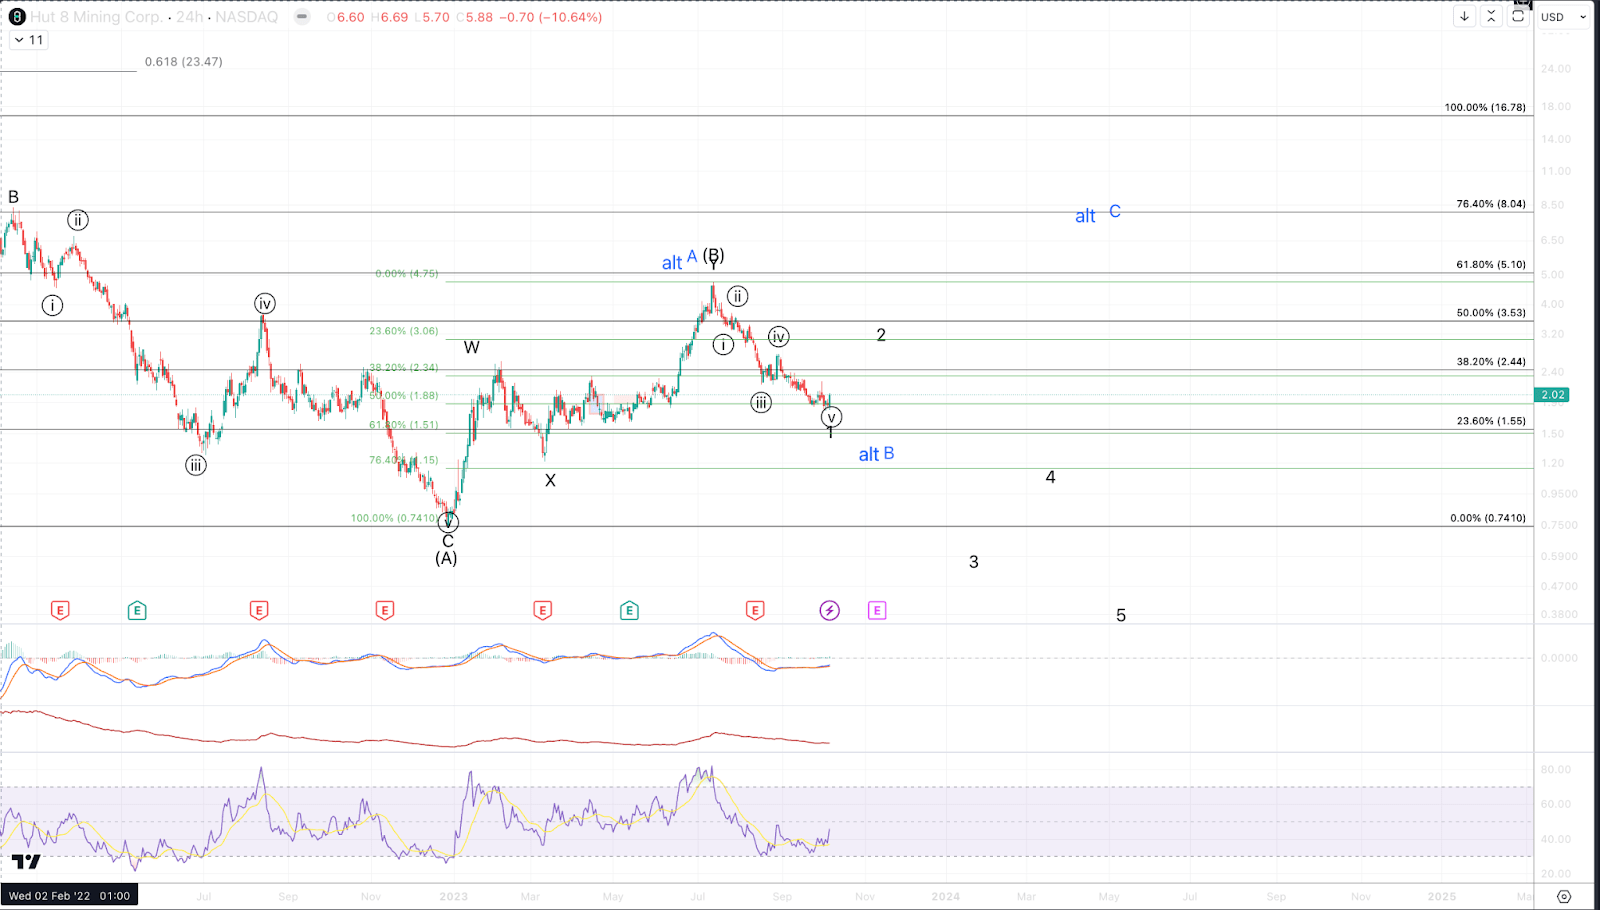
BTBT
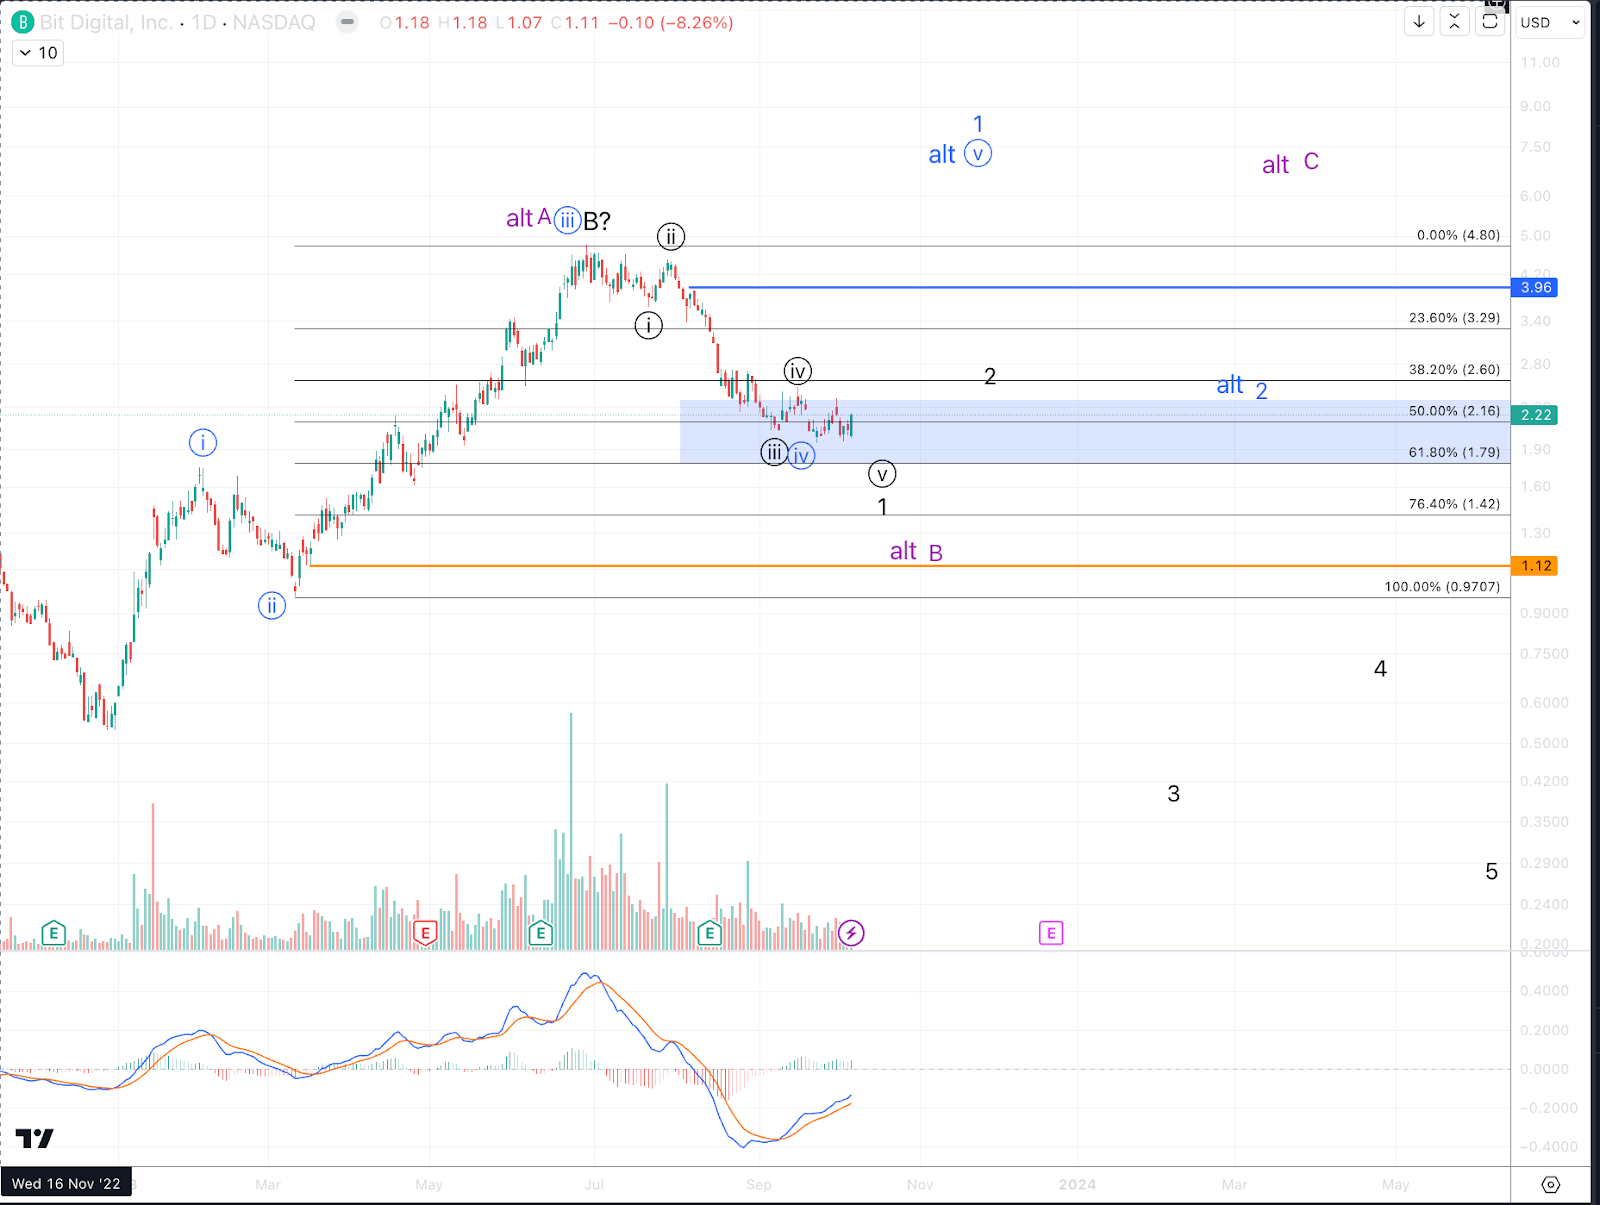
BITF
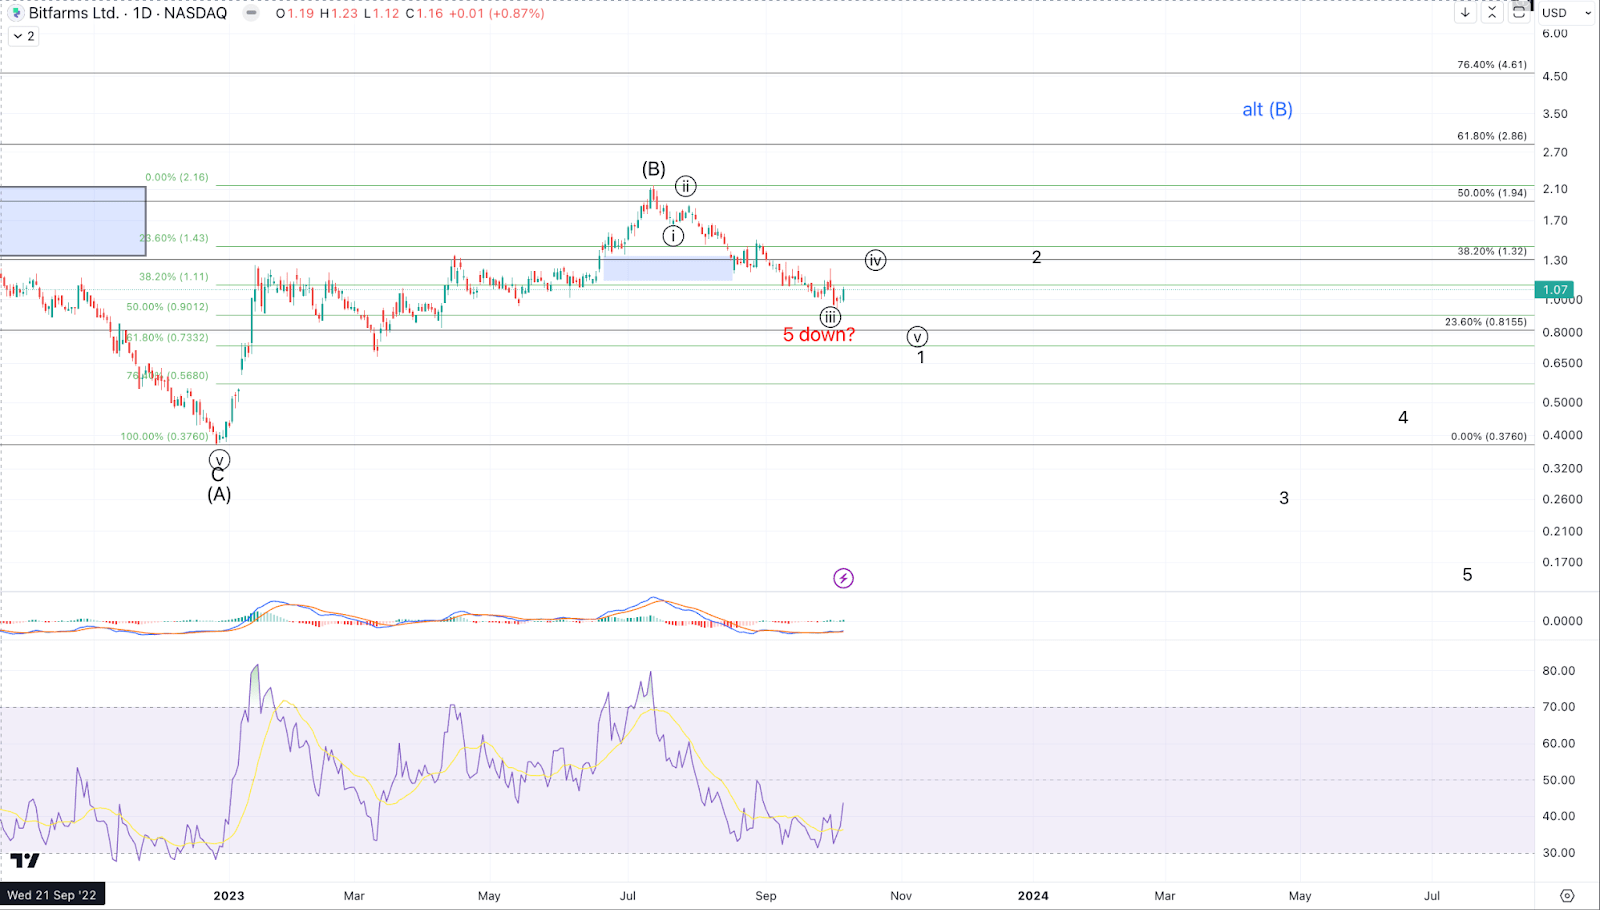
For further details see:
Where We See Crypto Mining Stocks Headed