ORLY - Where Will Advance Auto Parts Stock Be In 4 Years?
Summary
- Advance Auto Parts has been a difficult stock to own over the past several years and has underperformed its peers.
- But its basic valuation metrics make it look fairly cheap.
- In this article, I use an earnings valuation technique to estimate approximately where the stock price will be 4 years from now if those trends hold.
- Overall, I think Advance Auto Parts valuation is similar to that of the wider market, but it ultimately fails to meet one of my quality standards.
Introduction
Advance Auto Parts ( AAP ) is an interesting stock to analyze in the current market environment for a couple of reasons. First, I think it's interesting to compare them to their competitors, AutoZone ( AZO ) and O'Reilly ( ORLY ) because there are important differences between them that stand out. Secondly, AAP looks like it has an earnings growth issue that could signal trouble for the stock in the future. I currently own AutoZone stock, which I bought during the March 2020 crash, and I distinctly remember ORLY getting within a few pennies of my buy price at that time as well. But I don't remember AAP ever being particularly close to a buy for me, even during the crash. I purchased AZO on 3/20/23 (and I've written about that purchase on Seeking Alpha in the past). Here is how these three stocks have performed since that purchase of AZO (and near-purchase of ORLY):
Both AZO and ORLY have nearly tripled the returns of the S&P 500 ( SPY ) since that purchase date. And, initially, AAP was leading the pack in terms of returns off the March 2020 lows. But over the course of the past year, AAP stock has fallen substantially and is almost back in line with the performance of the wider index. This could mean the stock is potentially undervalued now, or, it could mean it was overvalued last year near its peak. In this article, I will explain why the stock may have performed this way, and we will estimate where the stock price is likely to be, based on historical earnings metrics, four years from now.
This article will be part of a new series I'm writing about the ability to roughly predict stock prices of steady-earning businesses over the medium term of four years. I often receive feedback on my articles that stock valuations of the sort I share on Seeking Alpha are not useful for predicting or improving one's returns. These critiques come in a couple of variations. One of them states that investors should just buy the stocks of quality businesses whenever they find them regardless of price. Another, the flip-side of this thought process, is that stocks shouldn't be sold based on valuation because that is "market timing" and it cannot be done successfully on a consistent basis. I strongly disagree with both critiques, so I will be systematically tracking the results of my 4-year return estimates for dozens of stocks like Advanced Auto Parts in an effort to hopefully demonstrate the usefulness of earnings-based valuations. (More on this experiment later.)
Valuation
The first thing I check with almost every stock before I start the valuation process is the business's historical earnings cyclicality. I generally require at least one recession as part of the data so I can see how earnings performed during that recession. Because 2020's recession was so unusual, I place most of the weight on the 2008/9 recession when examining the historical earnings cyclicality. This can also help me assess the long-term earnings trend, which I require to generally be growing over time. (I don't have any interest in buying the stock of shrinking businesses or turnaround stocks.)
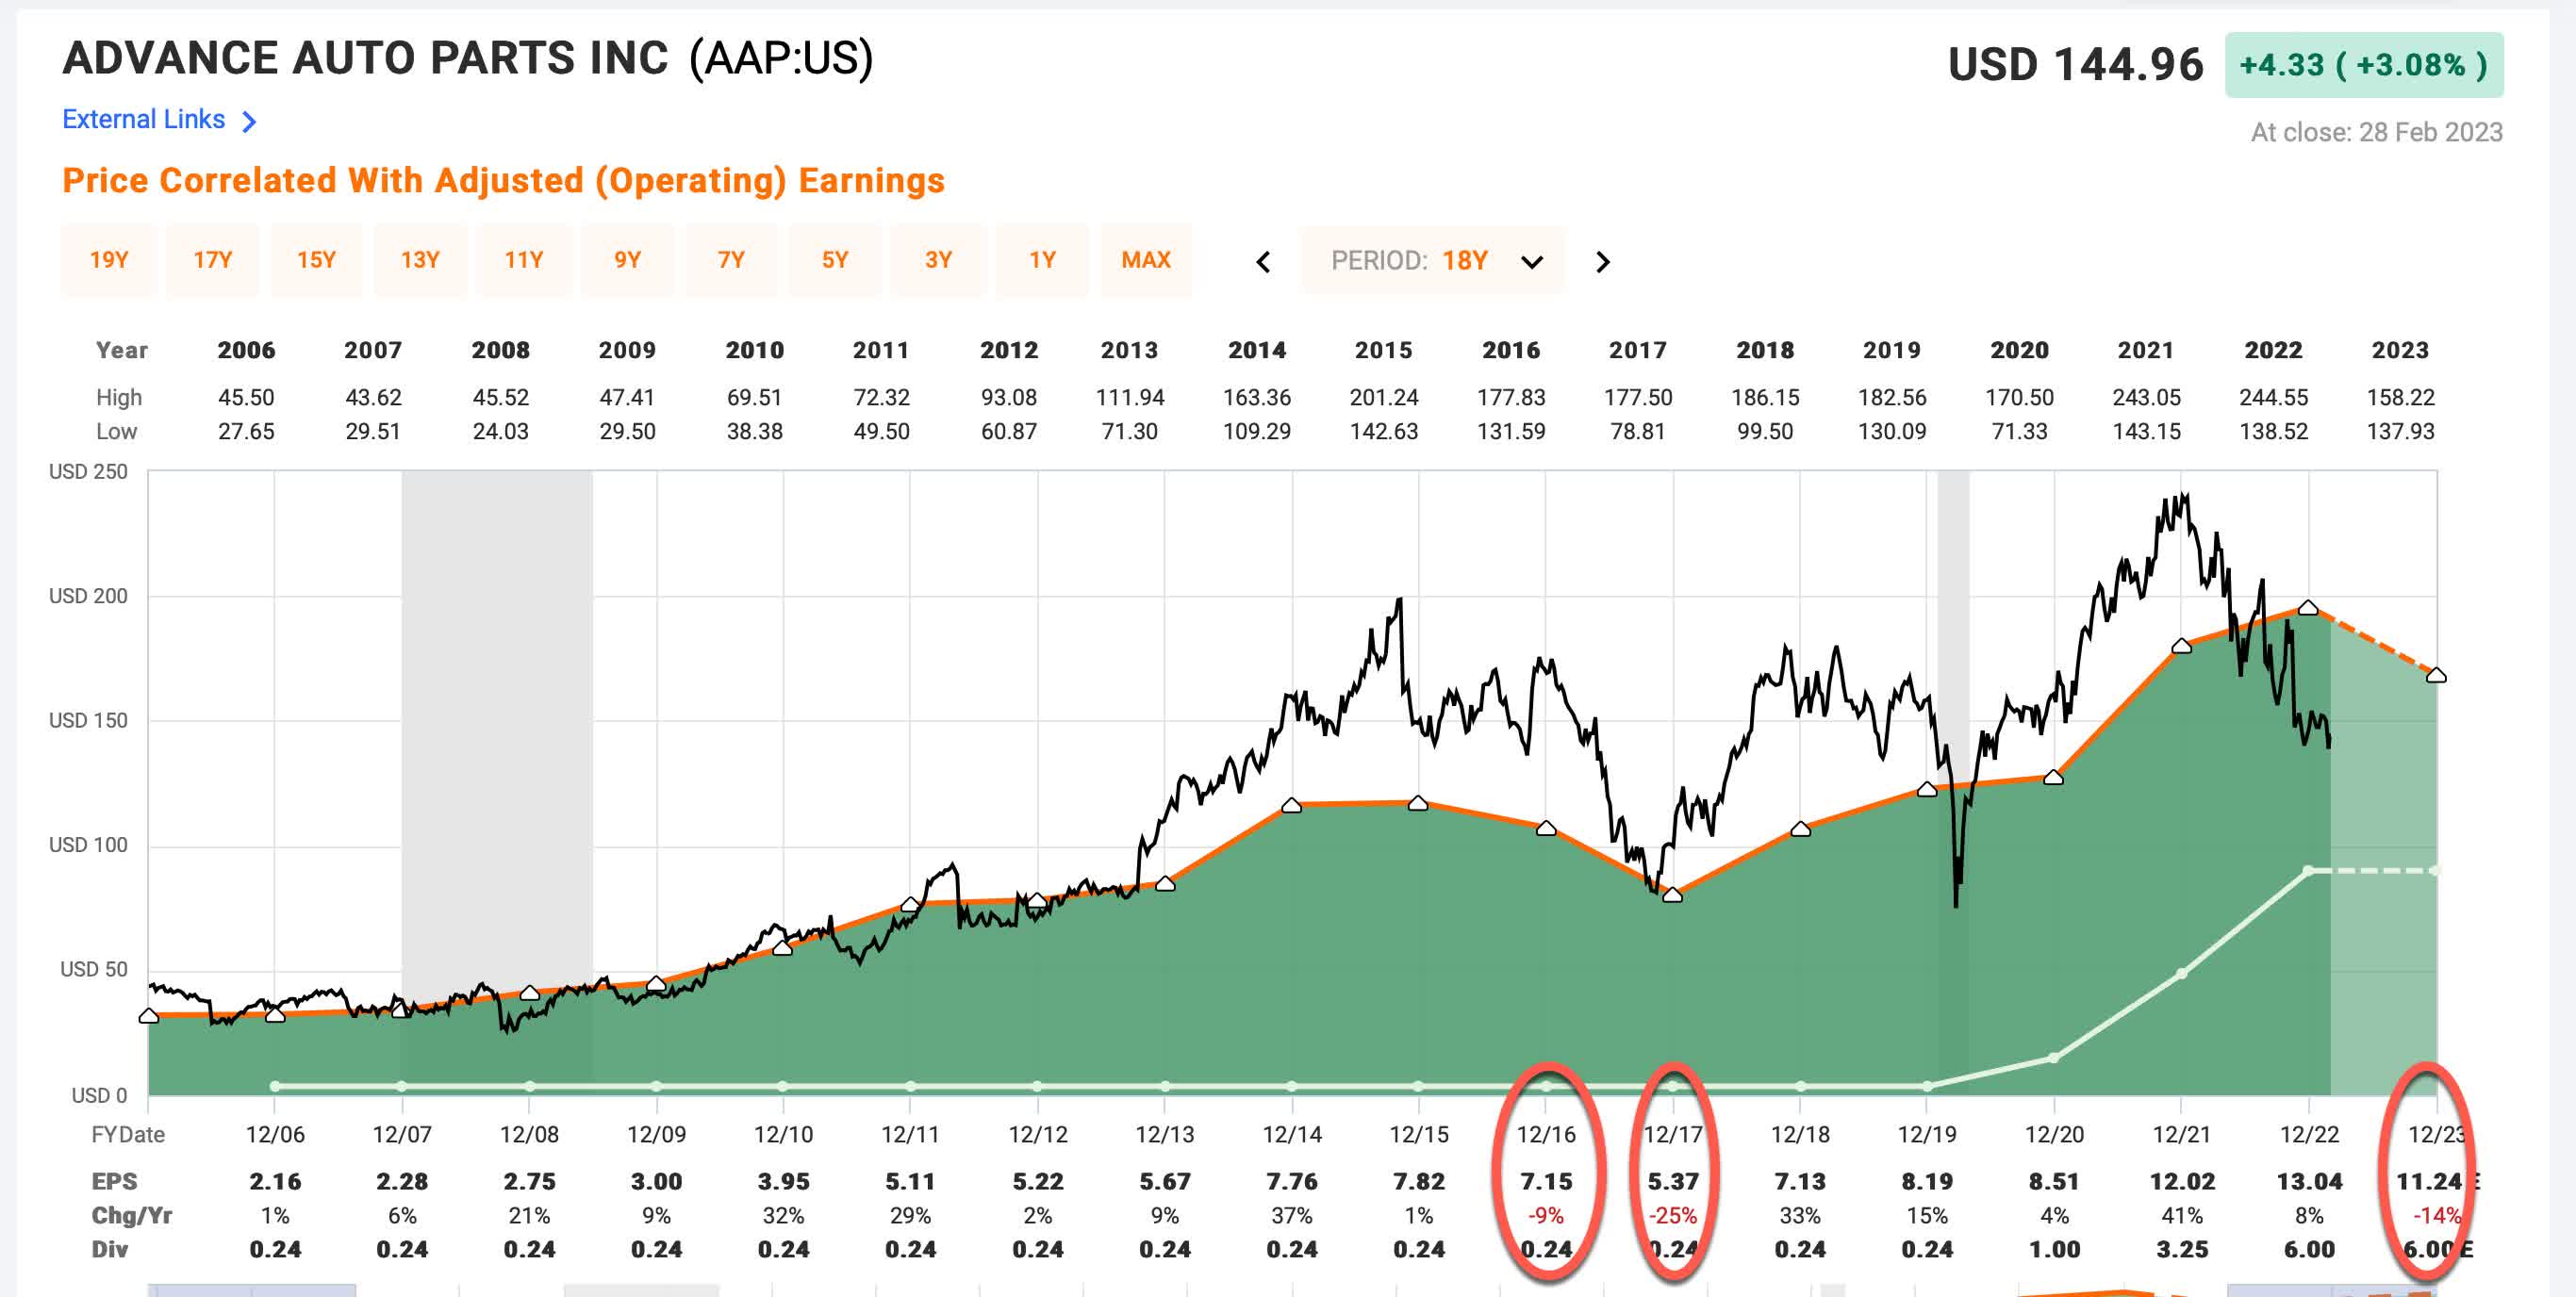
The green shaded area in the FAST Graph above represents AAP's annual earnings per share. The main thing I'm checking for here is whether or not there are any EPS growth declines that are -50% or deeper. If there are, then an earnings-based analysis will likely not be very useful. AAP has pretty unusual results because we see that earnings per share grew through the Great Recession in 2008/9, but then had a moderate decline in growth for 2016 and 2017. When I see something this unusual, typically the first thing I check is the acquisition history. (This is easy to check on SA if you go to the "News" tab, and select M&A history.) And indeed what we find is a purchase announcement to buy General Parts for about $2 billion in late 2013. I typically, don't take note of acquisitions if they are less than 20% of a business's market cap, but AAP had a market cap of a little under $6 billion at the time, so this purchase was more like 35% of the market cap. Whenever I see this sort of acquisition history in a stock whose earnings look cheap, I wait for 3-4 years before I consider buying the stock. The reason for that is usually management overpays for big purchases like this and it takes a few years before they admit it and it shows up in adjusted operating earnings. This deal came at the end of 2013, and we see that about 3-4 years later, earnings suffered (which happens about 90% of the time with big acquisitions like this one).
The revenue trend tells the story.
Initially, revenue jumped due to the new business, but then it actually shrank for a few years as the digestion and normalization of the new business occurred. This is typically not a good time to own a stock.
An investor can take an optimistic view of this dynamic when they are modeling earnings or a pessimistic view. I usually take the more conservative and pessimistic view that a business either 1) will experience the same pressure to make a similar move in the future, therefore there is a risk this may happen again, or, it is likely that the business conditions that compelled them to make a big purchase as they did in the past will remain in play, and therefore growth could be lower than expected over the long term. What this ultimately means is that I will treat those earnings growth declines from 2016 and 2017 as if they are likely to happen again at some point over the next decade. (If an investor wanted to assume they were unlikely to happen again and exclude them, then that would be a more optimistic approach.)
Even given the 2016/17 earnings growth declines, they were only moderate declines and they ultimately recovered, so, this stock isn't too cyclical to analyze using earnings trends, as long as we model in those declines for our estimates.
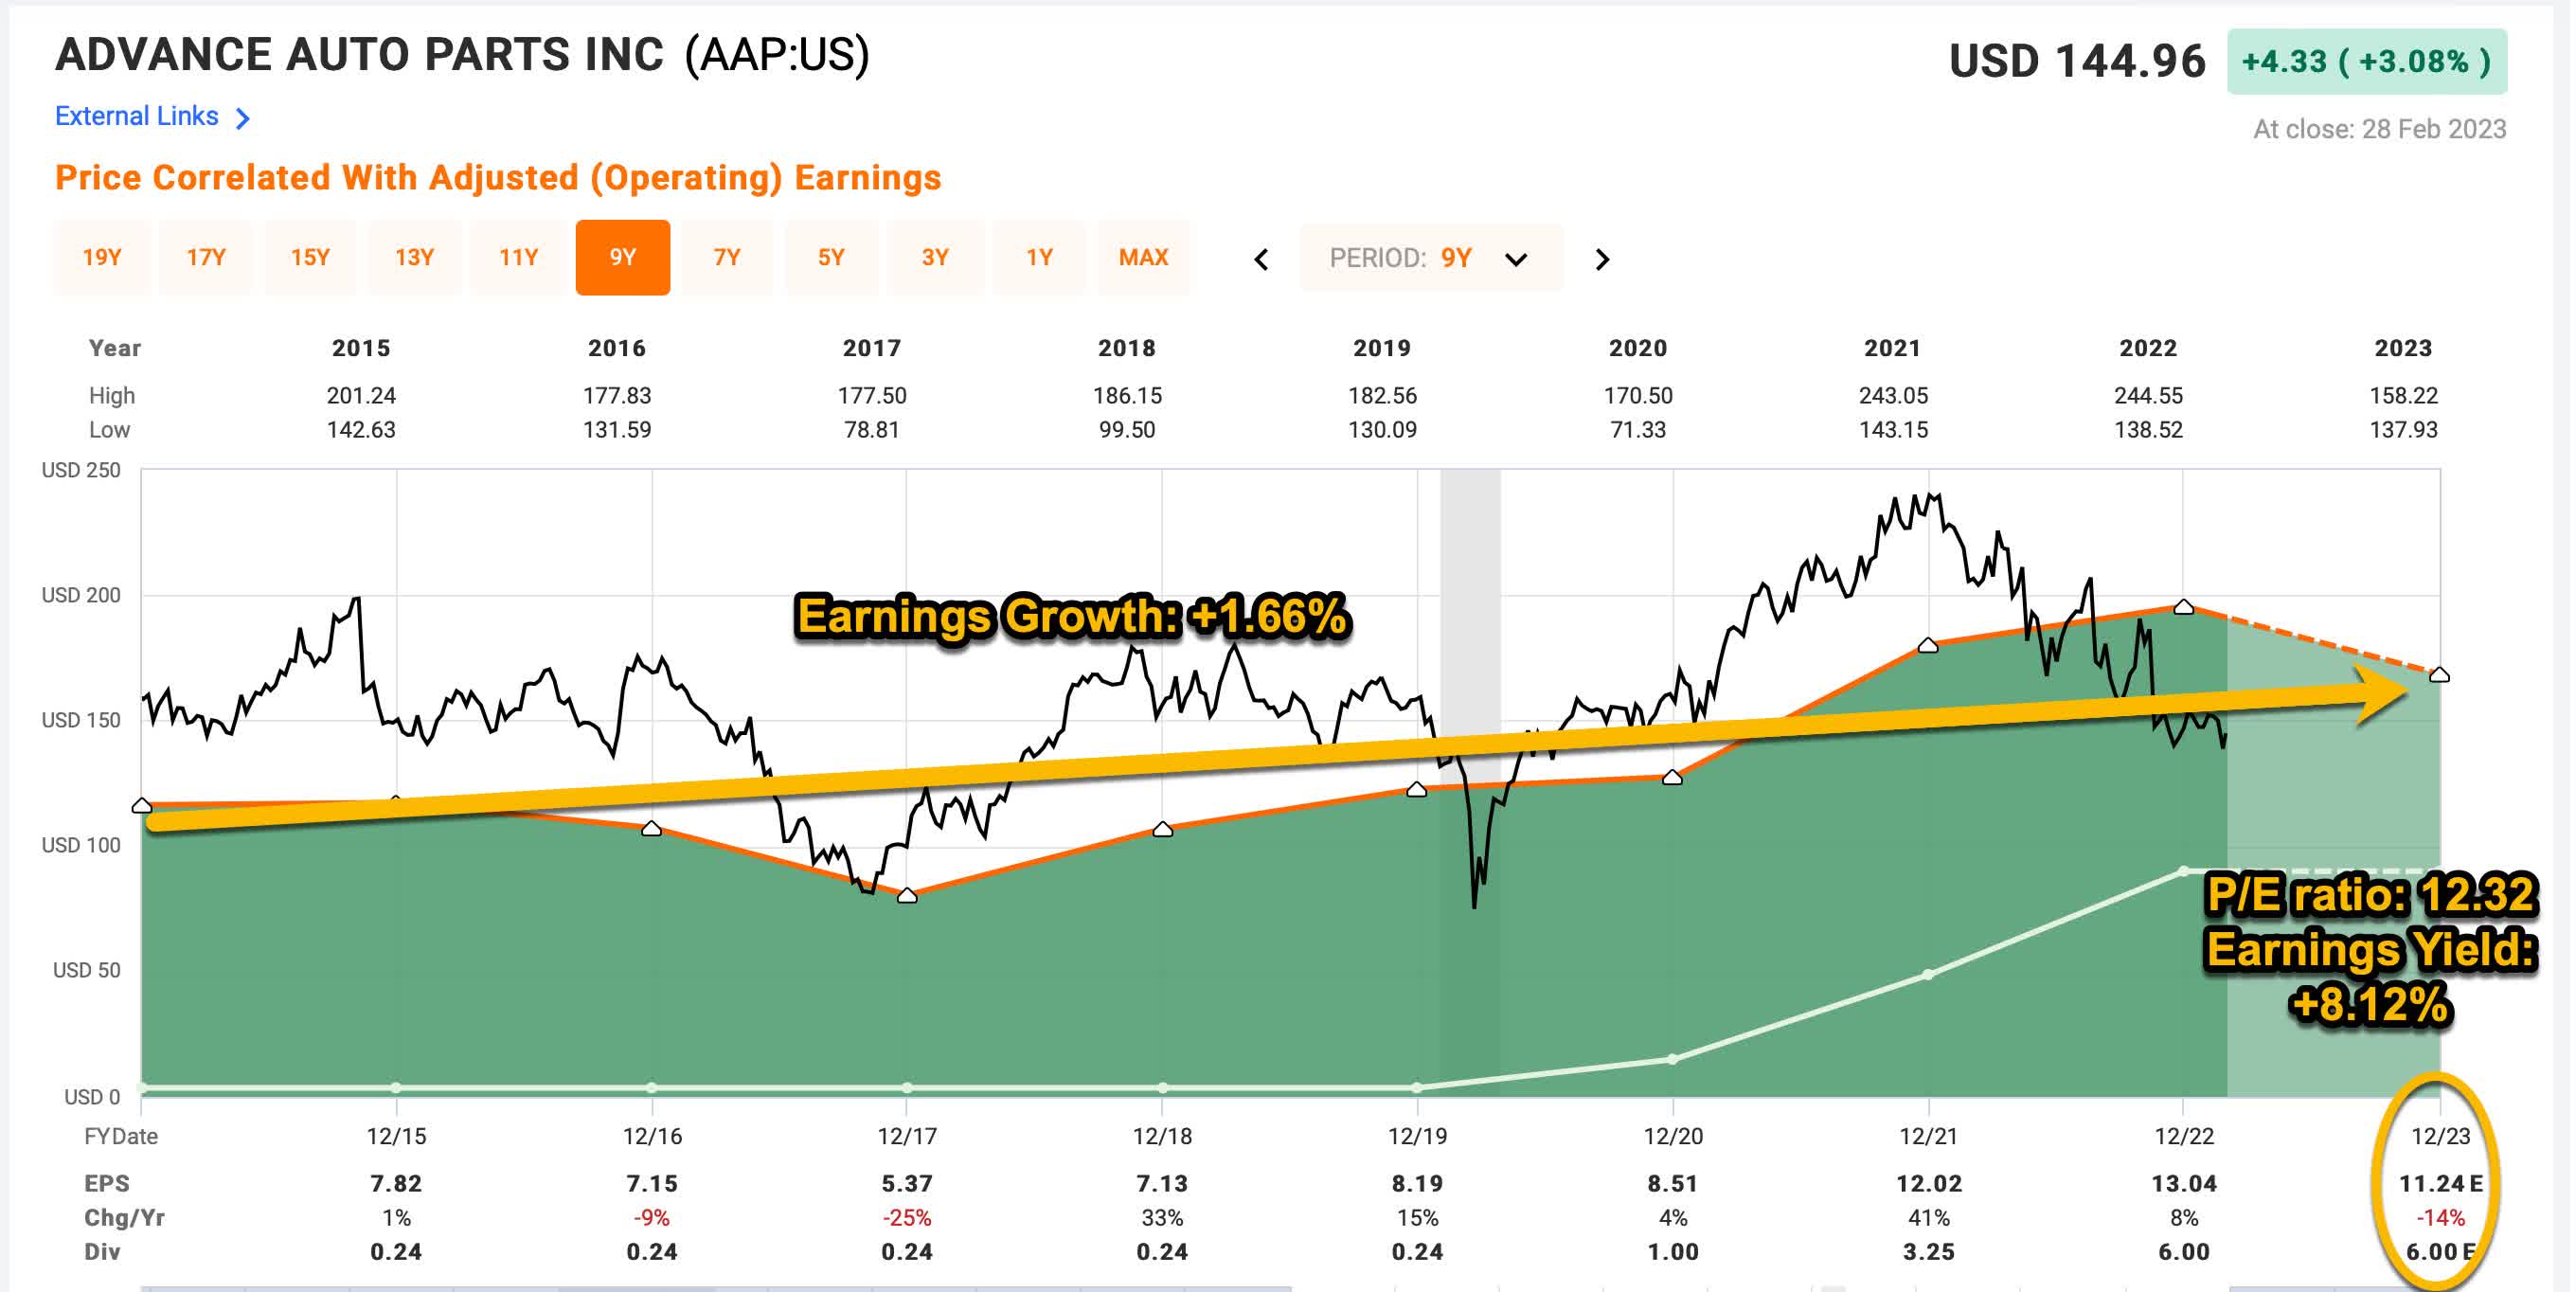
Next, I need to select the historical time frame I want to use in order to estimate the earnings growth rate going forward. I will use a time frame from 2015 to 2023's expected earnings. This will incorporate the 2016 and 2017 down years, and also the down year of -14% growth expected this year. But it also includes the up year of 2018 which included one-time corporate tax cuts, and the pandemic years which included one-time stimulus money. This makes the time period pretty choppy, but much of this also sort of balances out.
Because I'm going to use EPS in order to estimate earnings, I also check for any share buybacks that occurred over this period, because those will inflate the EPS growth rate by lowering the share count. (A rising share count, however, will already be incorporated in the EPS figure, so I won't make adjustments if the share count has risen.)
AAP has reduced its share count by about 19% during this time period. I will make adjustments for those buybacks when estimating the earnings growth rate. (It's worth noting that AZO and ORLY had more than double the number of buybacks during this period, so I actually make bigger downward adjustments for them compared to AAP.)
Above, I have another FAST Graph from the time period 2015 through 2023. I have annotated it with the data I will use for my 10-year collected earnings projections. Note that I am pulling forward 2023's expected EPS rate of $11.24 per share, which, at the current price translates to a P/E ratio of about 12.32, an earnings yield of +8.12%. The earnings growth rate from 2015 through 2023, has been about +1.66% if we take into account the negative growth year expected this year and the buybacks they've made. (This is more conservative than FAST Graph's calculation of +4.20% EPS growth which does not account for those things.)
The way I think about this is if I bought AAP's whole business for $100, it would earn $8.25 the first year ($8.12 plus 1.66% growth), and that $8.12 would grow at a rate of +1.66% each year, for 10 years total.
Below is a table that shows the expected cumulative collected earnings on $100 over 10 years.
| Year |
| Earnings for Year |
| Cumulative Earnings |
| 1 |
| $8.25 |
| $8.25 |
| 2 |
| $8.39 |
| $16.64 |
| 3 |
| $8.53 |
| $25.16 |
| 4 |
| $8.67 |
| $33.83 |
| 5 |
| $8.81 |
| $42.64 |
| 6 |
| $8.96 |
| $51.60 |
| 7 |
| $9.11 |
| $60.71 |
| 8 |
| $9.26 |
| $69.97 |
| 9 |
| $9.41 |
| $79.38 |
| 10 |
| $9.57 |
| $88.95 |
| Total |
| $88.95 |
| $100 + $88.95 = $188.95 |
So, if you bought AAP at the current valuation for $100 and collected all the earnings for yourself you would have started with $100 and ended 10 years later with $188.95. This is a compound annual growth rate of about +6.57%.
Next, what I will do is take that long-term average earnings CAGR of +6.57% and figure out what that works out to after four years' time, since our goal is to estimate the returns over that time period. When I do that, it works out to a basic total return of +28.99%. So, over the next four years, if we disregard market sentiment and assume it stays the same, treating AAP more like a private business, we could expect our total return in collected earnings after four years to be valued at about +28.99% if we assume the earnings trend will continue for 10-years total.
This return is the absolute return expectation if we assume that market sentiment for the stock is similar to what it is right now. But I think it's also worth comparing this expected 4-year total return to alternative investments. The two alternatives I will compare it to are the SPDR S&P 500 Trust ETF and the iShares Treasury Floating Rate Bond ETF ( TFLO ), which is what I'm currently using as my cash equivalent for investment money. The reason we compare to alternatives is to see if there are better simple alternatives that don't require a lot of skill to analyze, which basically anyone could own instead of the individual stock.
Using a similar method that I used with AAP's earnings, I also track about half of the S&P 500 ( SP500 ) stocks using this method, which represents about 2/3rds of the S&P 500 weighting. If I use that group of stocks to estimate their 4-year expected returns, I get an absolute expected total return for the index of about +27.48%. And, I generally expect TFLO, or short-term treasuries, to yield about 4% per year over this time, or to produce a 17.00% total return in four years. Let's see what sort of return AAP is likely to produce compared to these alternatives given these estimates.
| 4-Year No Mean Reversion |
| 4-year total return expectation |
| 4-year return expectation minus SPY's +27.48% |
| 4-year return expectation minus TFLO +17.00% |
| AAP |
| +28.99% |
| +1.51% |
| +11.99% |
Overall, if sentiment remains the same for AAP and the wider market, AAP should be expected to return similar returns as the wider market (28.99% vs. +27.48%).
It's always good to start with steady sentiment as a base for a valuation, but I've found that over the longer-term (and four years is starting to get into the "longer term") stock earnings valuations tend to revert toward a mean of about a +7.00% 10-year earnings CAGR. (For a stock with the same earnings growth expectations as AAP of +1.66%, we would expect an average P/E ratio of about 11.35 to be the "normal" P/E the market would be likely to pay.)
In order for AAP's expected +6.57% 10-year CAGR expectation to get up to a 7.00% 10-year CAGR and the P/E down to 11.35, the stock price needs to come down a little because the price one pays for a stock has an inverse relationship to future returns. So, next, I will examine what would happen to the stock price if the P/E reverted from its current 12.32 level, to a slightly lower 11.35 level over the course of four years.
| With a Generic 7% 10-year Mean Reversion Assumption |
| 4-year total return expectation |
| 4-year return expectation minus SPY's +13.62% |
| 4-year return expectation minus TFLO's +17.00% |
| AAP |
| +20.60% |
| +6.98% |
| +3.60% |
For comparison, if the S&P 500 index were to revert to a 7.00% CAGR expectation over four years it would produce a +13.62% total return based on my estimates. TFLO's returns would be expected to remain about the same as before with a +17% return. If AAP's business earnings produce an average return valuation by the market, it is likely to return about +20.60% over the next four years on a total return basis. This is +6.98% (or +698 basis points) of difference between the S&P 500's +13.62% expected 4-year return. That's not much of a difference over four years, but there also isn't much of a difference compared to TFLO with a +3.60% (or +360 basis point) spread.
This implies that over the medium term on a relative basis, AAP is probably fairly valued compared to the S&P 500 and also fairly valued compared to the likely returns from a cash equivalent.
Ratings & Explanations
Assuming my estimates are reasonably close, there are several ways to interpret these results. The things we don't know, even if the earnings return estimates end up being fairly accurate, are what sort of mood the market will be in and how the wider economic conditions might influence the returns in four years. If we are in a deep recession at that particular time, then we would naturally expect the earnings to be lower, while if we are in some sort of economic boom, we would expect them to be higher. So, using relative returns is a way to somewhat control for macroeconomics. If we are in a recession, then it's likely SPY will perform poorly as well, so the difference between those returns is what we care about if we want to control for macro conditions.
Using mean reversion, on the other hand, helps to account for how people feel about certain stocks at certain times and what sort of returns investors are willing to accept. In this case, AAP and SPY have similar valuations, so there isn't a lot of difference between the two.
Different investors might have different assumptions and expectations about sentiment and macro conditions will be, so that's why I also provided the expectation without assuming mean reversion. That said, I do generally assume that after a period of four years, the chances are good that mean reversion will take place for most stocks, so, personally, I care about the mean reversion estimates the most. Additionally, I aim for a 4-year mean reversion expected return that is about 75% before I buy a stock based on earnings valuations. If I write about a stock (and earnings are not expected to drop because of a near-term recession) and it has a 75% 4-year return expectation, I will buy it, and those stocks will earn a "Strong Buy" rating from me.
Because I know I'm aiming for higher returns than many other market participants, I will rate stocks a "Buy" if the 4-year mean reversion total returns are 25% (2,500 basis points) higher than both SPY and TFLO, because these will likely be above market average returns and above cash average returns.
If the 4-year mean reversion returns are within 25% (+/- 2,500 basis points) of SPY, then I would consider that stock a "Hold." I don't consider any of my estimates superbly precise. They are meant to work as a rough guide, where we can take action if they reach extremes. So, within this range, I don't have a strong opinion about the stock one way or the other.
If the 4-year mean reversion returns are likely to underperform SPY or TFLO, i.e., cash, by -25% (-2,500 basis points) or more, then that stock would get a "Sell" rating from me.
And, finally, if a stock is likely to underperform both SPY and TFLO by more than -25% or (-2,500 basis points) over the course of four years then the stock would be a "Strong Sell."
I use -25% as the threshold because it's enough of a difference that a person could sell a stock, pay a full 20% long-term capital gains tax on the sale, and still come out ahead. If a person is dealing with a bigger tax bill than 20%, then they should do the math and figure out what that level is and use that as a guide for their selling threshold.
Measuring The Results of This Valuation Experiment
Writing about investing and the stock market can be useful to readers in several different ways. Articles can share strategies, discuss investing philosophy, analyze businesses and their prospects. Articles can also make predictions about future stock prices, conduct experiments, and share valuation techniques. With such a wide scope of possibilities, there is a lot that could be covered within any given investing universe. Typically, my preferred approach is to focus on a given individual stock rather than the macro with my articles because I am committed to primarily sharing articles and ideas that are clearly actionable for readers. One reason I do this is so the outcomes can be measured. I tend to avoid telling stories in my articles, which can sometimes make them less compelling for readers unless I offer something more valuable than a story (like the prospect of above-average returns). My goal is to offer actionable stock analysis that produces market-beating returns in the aggregate.
This creates a variety of difficulties, but I've noticed several of them which have been occurring with more frequency with my articles. Perhaps the most common, are investors who aren't focused on achieving above-average total returns. At the portfolio level, I generally aim for 15% annual returns over the long term. My estimate is right now the S&P 500 will likely deliver less than half that rate of return over the next 5-10 years. So, there is a big gap between my goals and where I estimate the current valuation of the market is at. One way to think about this is I aim for a 400% 10-year return while the market is likely to only produce a 100% 10-year return from today going forward. This means I either need to buy stocks when they are very cheap relative to current earnings, or I need to buy stocks that will grow faster than expected for longer (thereby being very cheap, too, just in a different way).
There is a large space between market average 10-year returns of 100% and my goal of 400% where investors could successfully buy stocks at higher prices than I am willing to pay and still outperform the market. Historically, I have only written "Buy" articles when I actually purchased a stock myself. That was a way for me to "eat my own cooking", so to speak. But because I aim for very high returns, it meant my "buy prices" were much lower than other investors would be happy with, and when an investor aims for low prices, they get fewer opportunities to buy. I actively monitor hundreds of stocks in my marketplace service, The Cyclical Investor's Club, so it's rare that an easy opportunity to buy a high-quality stock at a cheap price slips past me unnoticed. But there are investors who don't have a stock monitoring system like I do, so they are going to be more likely to miss opportunities, and that means they need to be willing to pay higher prices in order to get enough opportunities for their portfolio unless they are super concentrated (which I don't recommend for most investors).
So, with this article series, I have created a new category of stock "Buys," that I expect to outperform the S&P 500 by 2,500 basis points at some point during the next four years. So if the S&P 500 returns 10% over a given time period, I expect the buy-rated stock will return 35% or better. Or, if compared to cash, if cash returns 15%, then I would expect the buy-rated stock will return 40%. "Buy" rated stocks should outperform SPY or Cash by 2,500 basis points in order to be considered a successful rating. Importantly, that spread can happen at any time during the 4-year period. Because if that spread opens up, a person could then rotate back into the index or cash if they chose and be 25% better off than before. The investment would have met its medium-term goal based on the valuation.
In order for my "Strong Buys" to be considered successful we will want them to return 75% at some point over four years or to outperform the S&P 500 index and Cash over four years.
Having two categories of "Buys" will create some room in my analysis for stocks that are likely to outperform the market, but are not as likely to produce the really big returns I'm looking for myself.
My plan is to track the success or failure of my stock ratings and 4-year total return estimates each quarter. Over time, I expect I'll have at least an 80% success rate for each category of rating using the standards I described above. This means that there will be some stocks that don't do as I expect. But I won't know which ones will fail ahead of time, which is why when it comes to my personal portfolio I use an equal-weighted unconcentrated approach when it comes to starting initial positions, and I usually weight each position 1%. If a person has a really concentrated portfolio of fewer than 30 stocks, they will need to do deeper work on each business before trying to implement a numbers-based strategy like mine. I make up for lack of deep work by working quickly and monitoring a very large number of potential positions, sometimes being overly conservative, and then playing the odds. Sometimes this means I'll miss a big winner because I'm too cautious and don't understand something that makes that business special, and sometimes I buy a big loser because I don't understand a danger that doesn't show up in my preferred metrics. That's okay. I usually have four out of five positions that produce positive returns over four years, and many of my winners are big winners. This is how I make up for my lack of deep, time-consuming work on an individual business. So, I will be tracking to see what percentage of stocks meet my expectations and what percentage do not over time.
The ultimate goal is to provide useful data to readers whether I achieve my goals or not.
At today's price, Advance Auto Parts is expected to perform slightly better than SPY or TFLO over the next four years. But it's entirely possible that this year's earnings, post-COVID and stimulus, come in worse than expected. Even in the two days while I was working on this article, analysts' expectations for 2023 earnings came down a lot. In December of last year, for example, analysts were expecting $12.62 per share for 2023, and this morning the average expectation is down to $10.96. That is a substantial decline in expectations that investors should pay attention to. AutoZone, one of their competitors, had a $125.30 per share expectation for 2023 back in December, and it actually has risen to $128.40. O'Reilly, had a $32.80 expectation at the end of last year for 2023, and now it is $36.95. So, when I zoom out and look at AAP, even though the stock appears to be fairly valued based purely on current expectations and recent historical results, those expectations are deteriorating fast. And, the valuation compared to both AZO and ORLY is actually very similar once earnings growth is taken into account.
I have several rules that go beyond my standard valuation process and guidelines that I follow when determining whether to buy or sell stocks. I typically only mention these additional guidelines if they are relevant at the time I'm analyzing the stock. And in AAP's case, one of those guidelines is that I don't buy stocks with long-term annual earnings growth expectations below 3%, which is what I assume the long-term inflation rate will be. Part of the benefit of owning stocks over, say, bonds, for example, is that quality businesses have the ability to pass the costs of inflation on to their customers. If I can't count on that benefit because earnings are not rising at a fast enough rate, then I don't want to own a stock. For that reason, I would not buy AAP right now, even if the price fell enough to trigger a 'buy' using my standard process. Whether or not one sells AAP right now, is a bit of a borderline call since the earnings trend is technically still positive. That said, I recently sold five stocks, several of which had similar earnings weaknesses that AAP does. When we combine that with what look to be at least moderately deep earnings growth declines coming this year and much higher quality competitors in ORLY and AZO, I am rating AAP a "Sell" based on quality concerns rather than pure valuation, and I think investors should probably treat it as a turnaround stock if they wish to take a chance on it.
Conclusion
Based purely on the current valuation, AAP is a hold. However, due to quality metrics outside of the basic valuation process, in this case, earnings growth that is too slow and currently trending down this year, I have chosen to rate AAP a "Sell". This creates a slightly different category rating, one based on quality metrics, rather than purely on valuation, so I might have to create a special category to measure the results of my 4-year estimates here, but I'm sure over time I'll find at least a few more stocks that I would sell due to earnings growth being under 3%, so I expect we should be able to learn something over time about the usefulness of this metric along with the valuation process itself.
For further details see:
Where Will Advance Auto Parts Stock Be In 4 Years?