VTI - Where Will Apple Stock Be In 2030?
Summary
- As a top holding in the world's most followed stock benchmarks, Apple's long-term returns are material to even passive long-term investors.
- This article aims to explain a fresh and simple estimate of an expected total rate of return for Apple stock over the next 7 years, to the year 2030.
- The most likely downside to Apple's share price will likely come from the market demanding a dividend yield much higher than its current level of 0.68%.
- The risk of Apple's growth slowing, and its shares possibly getting revalued downward, can be mitigated by buying Apple bonds, and spending the interest on call spreads.
It would not be an overstatement to say that what would be good for Apple stock would be good for investors in broad US stock funds, and that what would be bad for Apple would be bad for the benchmarks as well. As of this writing, Apple Inc ( AAPL ) is the largest public company in the world and the only one with a market cap currently above US$2 trillion. AAPL is currently the largest holding in all five of the five largest US-listed ETFs , weighing in at over 6% of the S&P 500 ( SPY ) ( IVV ) ( VOO ), over 5% of the Vanguard Total Stock Market ETF ( VTI ), and a whopping 11.8% of the Invesco QQQ ETF ( QQQ ). Even on a global scale, AAPL makes up more than 3% of the Vanguard Total World Stock ETF ( VT ), given the US stock market is currently valued at almost 60% of the whole world stock market. AAPL alone is worth more than all but 10 other countries' stock markets , with $2.1 trillion being slightly less than the total value of Korea's stock market and slightly more than Switzerland's. While I consider myself a long-term investor, and respect that many buyers of these ETFs may prefer to be far more passive about their long-term investing than I am, I do believe it is important to at least be informed about the numbers driving the long-term returns of what you own, especially about your top holding. In this article, I aim to provide a "fresh and simple" perspective on how I estimate an expected rate of return for AAPL stock over the next seven years until the year 2030. While this would of course be of primary interest to direct long-term shareholders of AAPL, I hope to get holders of some of the largest passive index funds holding AAPL thinking as well.
A Brief Investor's History of Apple
As with many stocks, I find it useful to start understanding where a company is going by looking where it and its investors have been so far. In the case of AAPL, I divide this history into three broad phases:
- 1976 - 2001: The "Pre-iPod Era". A lot has been written about this era in AAPL's history, but I will leave that era to the books, with only a brief mention about its dividend , which was discontinued in 1995.
- 2001 - 2012: The "iPod -> iPhone Era". As the below charts show, AAPL's business really took off not in 1997 with the return of Steve Jobs , nor with the 2007 launch of the first iPhone , but rather earlier in the 2000s after the launch of the iPod in 2001 , along with iTunes and what the iTunes ecosystem ushered in.
- 2012 - present: Apple's "Mature Growth Era". 2012 marked the year that Apple started paying a dividend again, an event which seems to have coincided with many turning points in Apple's growth around that time.
These three eras show up quite clearly in the chart of AAPL's annual revenues, which almost seemed to have peaked at $10 billion towards the end of the Pre-iPod Era. The iPod->iPhone Era saw revenues explode from just over $5 billion in 2002 to over $150 billion in 2012, roughly a 40% CAGR. That compares with the 10% CAGR which took those sales to just under $400 billion so far in the Mature Growth Era.
The three distinct eras show up not only in top line sales growth, but also in the percentage of those sales converted into bottom line profits, or in other words, margins. AAPL seems to have been a relatively low margin business before the iPod, and it only seems to have been in the iPod->iPhone Era that AAPL's margins rose from consistently below 10% to consistently above 20%. The Mature Growth Era seems to be one where net profit margins more or less leveled off at the plateau set around 2012.
The final historical chart in this section is the one that shows the translation of the above charted revenues and profits into earnings per share, and that is of course the count of the number of shares outstanding. I will let the part of this chart before 2012 speak for itself, as the key trend over the past 10 years, and the one likely to drive returns over the next seven years, is the decline in AAPL shares outstanding from around 26 billion in 2012 to 16 billion in 2022 due to buybacks. As I wrote back in 2020 , buybacks are an important way for businesses with slowing revenue growth, or even declining revenues, to sustain high shareholder returns by reducing the number of slices the profit pie needs to be cut into.
Finishing this section of looking back at Apple's history, I wanted to break down AAPL's total return so far in its Mature Growth Era into the three components making up the total return of a dividend stock:
- Dividend yield, plus
- Dividend growth, plus/minus
- Effect of change in yield, also known as multiple expansion or contraction
In the case of AAPL, it closed 2012 at a split-adjusted price of 19.01, with an indicated annual dividend of around $0.3785/share, implying a yield of 2%. That dividend grew at a rate of 9.3% over the next 10 years to an annual rate of $0.92 as of the end of 2022. Together, the dividend yield and dividend growth only explain an annual rate of return of around 11.3% per year, which means that over half of the 23% annual rate of return from 2012 to 2022 was due to the market bidding down AAPL's yield from 2% to its current level of only around 0.68%. Even with no growth, a decline in yield from 2% to 0.68% would triple the value of a stock, which over 10 years is an 11.6% CAGR, so this 11.6% from lower market yield + 9.3% dividend growth + 2% initial yield is what adds up to the 23% per year seen below.
Looking Forward: AAPL's 2030 Numbers
There is unfortunately only one analyst providing "consensus" revenue and earnings estimates on AAPL out to 2030, and as of now, that analyst expects AAPL to gross $734 billion in revenue and net $11.24 in earnings per share that year. That seems to assume that AAPL's profit margin and share count will remain roughly constant over the next decade, or that the two would offset each other, which I see as conservative given that AAPL has been using its profits to buy back shares faster than I think its margins are likely to erode. It's the revenue growth assumption, a 9% CAGR from now to 2030, I'd worry might be a bit on the aggressive side, since I'm not sure AAPL's next $300 billion in revenue growth will be as easy to find as its last $300 billion.
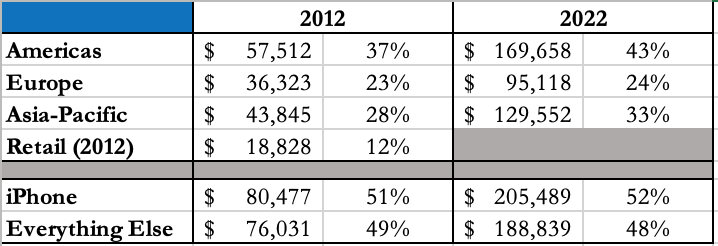
To estimate how likely this sustained 9% growth rate might be, I took a quick look at the segment trends between AAPL's 2012 annual report and 2022 annual report , and put together the following table:
SEC Edgar, Apple's 2012 and 2022 Forms 10-K Annual Reports, Author's Selected Numbers
What I found remarkable when putting together these numbers is how similar AAPL's geographic and product segmentation look between 2012 and 2022: a little over half of sales were and continue to be just from the iPhone, and sales remain geographically diversified even if slower in Europe than elsewhere. What seems different now is that I remember how excited many new Apple users in Greater China were to get their first iPhone back around 2012, while at the start of 2023, I struggle to think of any corner of the world where someone dreams of an iPhone and doesn't have easy access to one yet. I think the more likely way Apple may be able to sustain 9% growth over the next seven years is not through geographic expansion, but rather by expanding its services offering, especially seeing that gross margins on services are over 70% versus closer to 35% for products (source: page 23 of the 2022 annual report referenced above). From a personal point of view, I remember paying almost $1,500 for a combination of an iPhone, Apple Watch, and AirPods a little over a year ago, but it will probably be at least 2-3 more years before I make another one-time purchase like that again. Rather, I would expect/hope Apple to try and upsell me more on Fitness+ and other services that can help me make better use of the data it collects from Apple Watch.
So that said, I consider 9% annual growth between now and 2030 to be "aggressive but doable" on the top line. More likely, I think top line growth rates are likely to be slower, and so we should consider it a "consolation prize" to see bottom line earnings per share netting a growth rate of 9% per year with the help of buybacks. Answering the question asked in the title of this article, that $11.24 EPS estimate for 2030 implies a share price of around $200 at 18x earnings. 18x is somewhat below current levels, but as the below chart shows, it is above where AAPL's P/E was for most of the pre-COVID part of the Mature Growth Era.
As in the previous section, my preferred total return model for a dividend paying stock like AAPL is one based on its dividend. In this case, we are starting with a 0.68% dividend yield, and assuming a 9% dividend growth rate (in line with earnings per share growth, even if that requires buybacks), so the big variable in AAPL's total return estimate comes down to what will happen to AAPL's market dividend yield this decade. As wonderful as Apple's products and businesses are, I see 0.68% as an unsustainably low yield for a $2 trillion company so likely to be hitting limits of growth. A 0.68% yield with strong prospects for at least some growth looked very attractive back when 10-year US treasuries yielded 0.68% with guaranteed zero growth, but it looks a lot more expensive and risky when the 10-year yield is closer to 3.68%. I'm going to consider it conservative to assume that AAPL's dividend yield rises to only 1% over the next seven years, which would still imply a (0.68/1.00)^(1/7)-1 = -5.4% annual headwind to returns. Adding all of this together, this implies an expected annual rate of return of 0.68% + 9% - 5.4% = around 4.3% per year. Those dividend growth and yield assumptions place AAPL's share price at around $168 in 2030 (9% annual growth raises the dividend from $0.92 to $1.68, on which a 1% yield implies a price of $168), which is a bit more modest than the $200 target based on EPS earlier.
Apple Stock vs Apple Bonds
With an estimated expected rate of return of only around 4%, my first thought in today's market is to compare that to what I could earn buying AAPL's bonds instead of its shares. For 2030, my preferred bond is the 1.25% notes due 20 August 2030 , though the yield at just above 4% is about the same as the higher coupon 1.65% notes due 11 May 2030 . This is only 0.5% per year more than the yield on the far more liquid and theoretically default-risk-free 7-year US Treasury Note ( US7Y ), but that yield premium is almost as much as AAPL's dividend yield, and shows how remote the market considers default risk to be from AAPL. My main concern with AAPL is not that it will go bankrupt, but rather that it may only grow at 5-7% rather than 9%, and what will happen to its valuation multiples and dividend yield if and when that happens. From that point of view, a 4% yield on either of these bonds seems like a safer rate of return than hoping on both growth and sustained low yields. Investors wanting to get even more aggressive on the "low growth, but I don't think Apple will default" scenario may want to go even further out with Apple's 2.55% bonds due 20 August 2060 , currently yielding almost 4.4%. If I'm right about 2.5% being the "new normal" Fed Funds rate over the coming decade, when I expect we'll see slower growth due to aging demographics, that 2060 bond could do even better than long-dated treasuries. In that scenario, I'm imagining far more Apple wearables and data services helping an older population live healthier lives, which will keep Apple profitable, but maybe not profitable enough to become a $4 trillion company absent inflation.
DIY Apple Convertible Bond
For investors who both worry about the re-valuation downside of AAPL, but also want more upside than just buying AAPL bonds, may prefer to use, say, $9,000 to buy AAPL bonds and $1,000 to buy options . AAPL's listed options unfortunately don't go out to 2030, but the January 2025 options provide a good 2-year timeframe, and there I'm looking at the 140-165 call spread, which currently trades at around $10/share, or about $1,000 per 100-share lot. This is a little more than two years' interest income on my bonds, but if AAPL rises to $165 or more over the next two years (which would put it on track to reach $200 by 2030, as estimated earlier), that $1,000 would turn into a $2,500 payout on these options. On the other hand, if the dividend yield on AAPL doubles to over 1.4%, cutting its share price in half over the next two years, this strategy would only lose the $1,000 spent on the options, and the bonds would presumably keep paying interest I could spend on more options. I call this a "DIY convertible bond" because it is like buying a convertible bond, except that I get to choose my own terms for the option strategy rather than having them embedded in the issue.
Bottom Line On Apple Stock Until 2030
For investors who both worry about the re-valuation downside of AAPL, and have continued to sell rather than buy simply because I see this company as too big and too expensive relative to any growth path I can see from here. It is a wonderful company that makes wonderful products, I just think the dividend yield of 0.68% is the opposite of wonderful, and likely to be the biggest headwind to the total return on AAPL shares, and for that matter the shares of VOO, VTI and many other ETFs, for the foreseeable future. Its current elevated share price / depressed yield may be sustained for a very long time by its >50% institutional ownership, with three of its top four shareholders being Vanguard, BlackRock, and State Street , the respective fund companies behind VOO, IVV and SPY. This institutional buying power is likely why over half of AAPL's total return since 2012 was from multiple expansion / yield collapse, which is not a tailwind investors can expect to repeat over the next seven years. While I think 9% EPS and dividend per share growth are doable, especially with the help of buybacks, I estimate the total rate of return on AAPL shares are just as likely to be below the 4% yield on its bonds as above that level. Investors more bullish on AAPL than I am, but as worried about the downside, may prefer to look to a combination of bonds and options to capture AAPL's remaining growth while mitigating the downside of revaluation.
For further details see:
Where Will Apple Stock Be In 2030?