EW - Where Will Edwards Lifesciences Stock Be In 4 Years?
2023-03-30 13:24:06 ET
Summary
- Edwards Lifesciences has had an impeccable record of steadily rising earnings for more than two decades.
- However, the market has typically valued the stock at a level that reflects this growth.
- In this article, I will use Edwards' historical earnings to estimate what sort of returns the stock is likely to produce over the next four years.
Introduction
This will be an article that estimates Edwards Lifesciences (EW) stock's medium-term returns using an earnings valuation technique. Because I prefer to focus mostly on the numbers and let those guide the return estimates for stocks rather than telling a story about the company, I like to start my articles by reviewing any previous coverage I've had of a stock as a way to gauge the accuracy of my valuation process. About three years ago, on 1/24/2020, just before the pandemic had spread worldwide, I wrote an article on EW titled " Edwards Lifesciences: A 10-Year, Full-Cycle Analysis ", in which I rated the stock a "Sell" based on valuation. Since then, here is how the stock has performed relative to the S&P 500 ETF ( SPY ).
I had estimated a +2.71% CAGR for EW over the next decade, and that is about what it has done in the past three years. It is also currently underperforming the S&P 500 index, so I think my sell rating was reasonably accurate.
I didn't think there was anything wrong with EW's business at the time of my sell article, it just looked overvalued to me, so during the March 2020 sell-off, just two months later, on the day the market bottomed, I published a follow-up article titled " Here's The Price I'll Start Buying Edwards Lifesciences " in which I rated EW a "Hold", and shared that I would buy at a split-adjusted price of $45.67 per share. The price ended up bottoming at $51.51 per share, which I didn't think was cheap enough to provide a margin of safety and market-beating long-term returns. Here is how the stock has performed since that "Hold" article:
I think that was a fairly decent hold call, with the stock roughly performing the same as the market until its recent underperformance, but still providing pretty good returns. Though, even at its pandemic lows, EW didn't really offer a superior value to the wider market.
I will be using a similar valuation approach in today's article, which usually works well when estimating medium-term relative returns 3-5 years into the future. This article will be part of a new series I'm writing regarding the ability to roughly predict stock prices of steady-earning businesses over the medium term of four years. I often receive feedback on my articles that stock valuations of the sort I share on Seeking Alpha are not useful for predicting or improving one's returns. These critiques come in a couple of variations. One of them states that investors should just buy the stocks of quality businesses whenever they find them regardless of price. Another, the flip-side of this thought process, is that stocks shouldn't be sold based on valuation because that is "market timing" and it cannot be done successfully on a consistent basis. I strongly disagree with both critiques, so I will be systematically tracking the results of my 4-year return estimates for dozens of stocks like Edwards Lifesciences in an effort to hopefully demonstrate the usefulness of earnings-based valuations. (More on this experiment later.)
Valuation
The first thing I check with almost every stock before I start the valuation process is the business's historical earnings cyclicality. I generally require at least one recession as part of the data so I can see how earnings performed during that recession. Because 2020's recession was so unusual, I place most of the weight on the 2008/9 recession when examining the historical earnings cyclicality. This can also help me assess the long-term earnings trend, which I require to generally be growing over time. (I don't have any interest in buying the stock of shrinking businesses or turnaround stocks.)
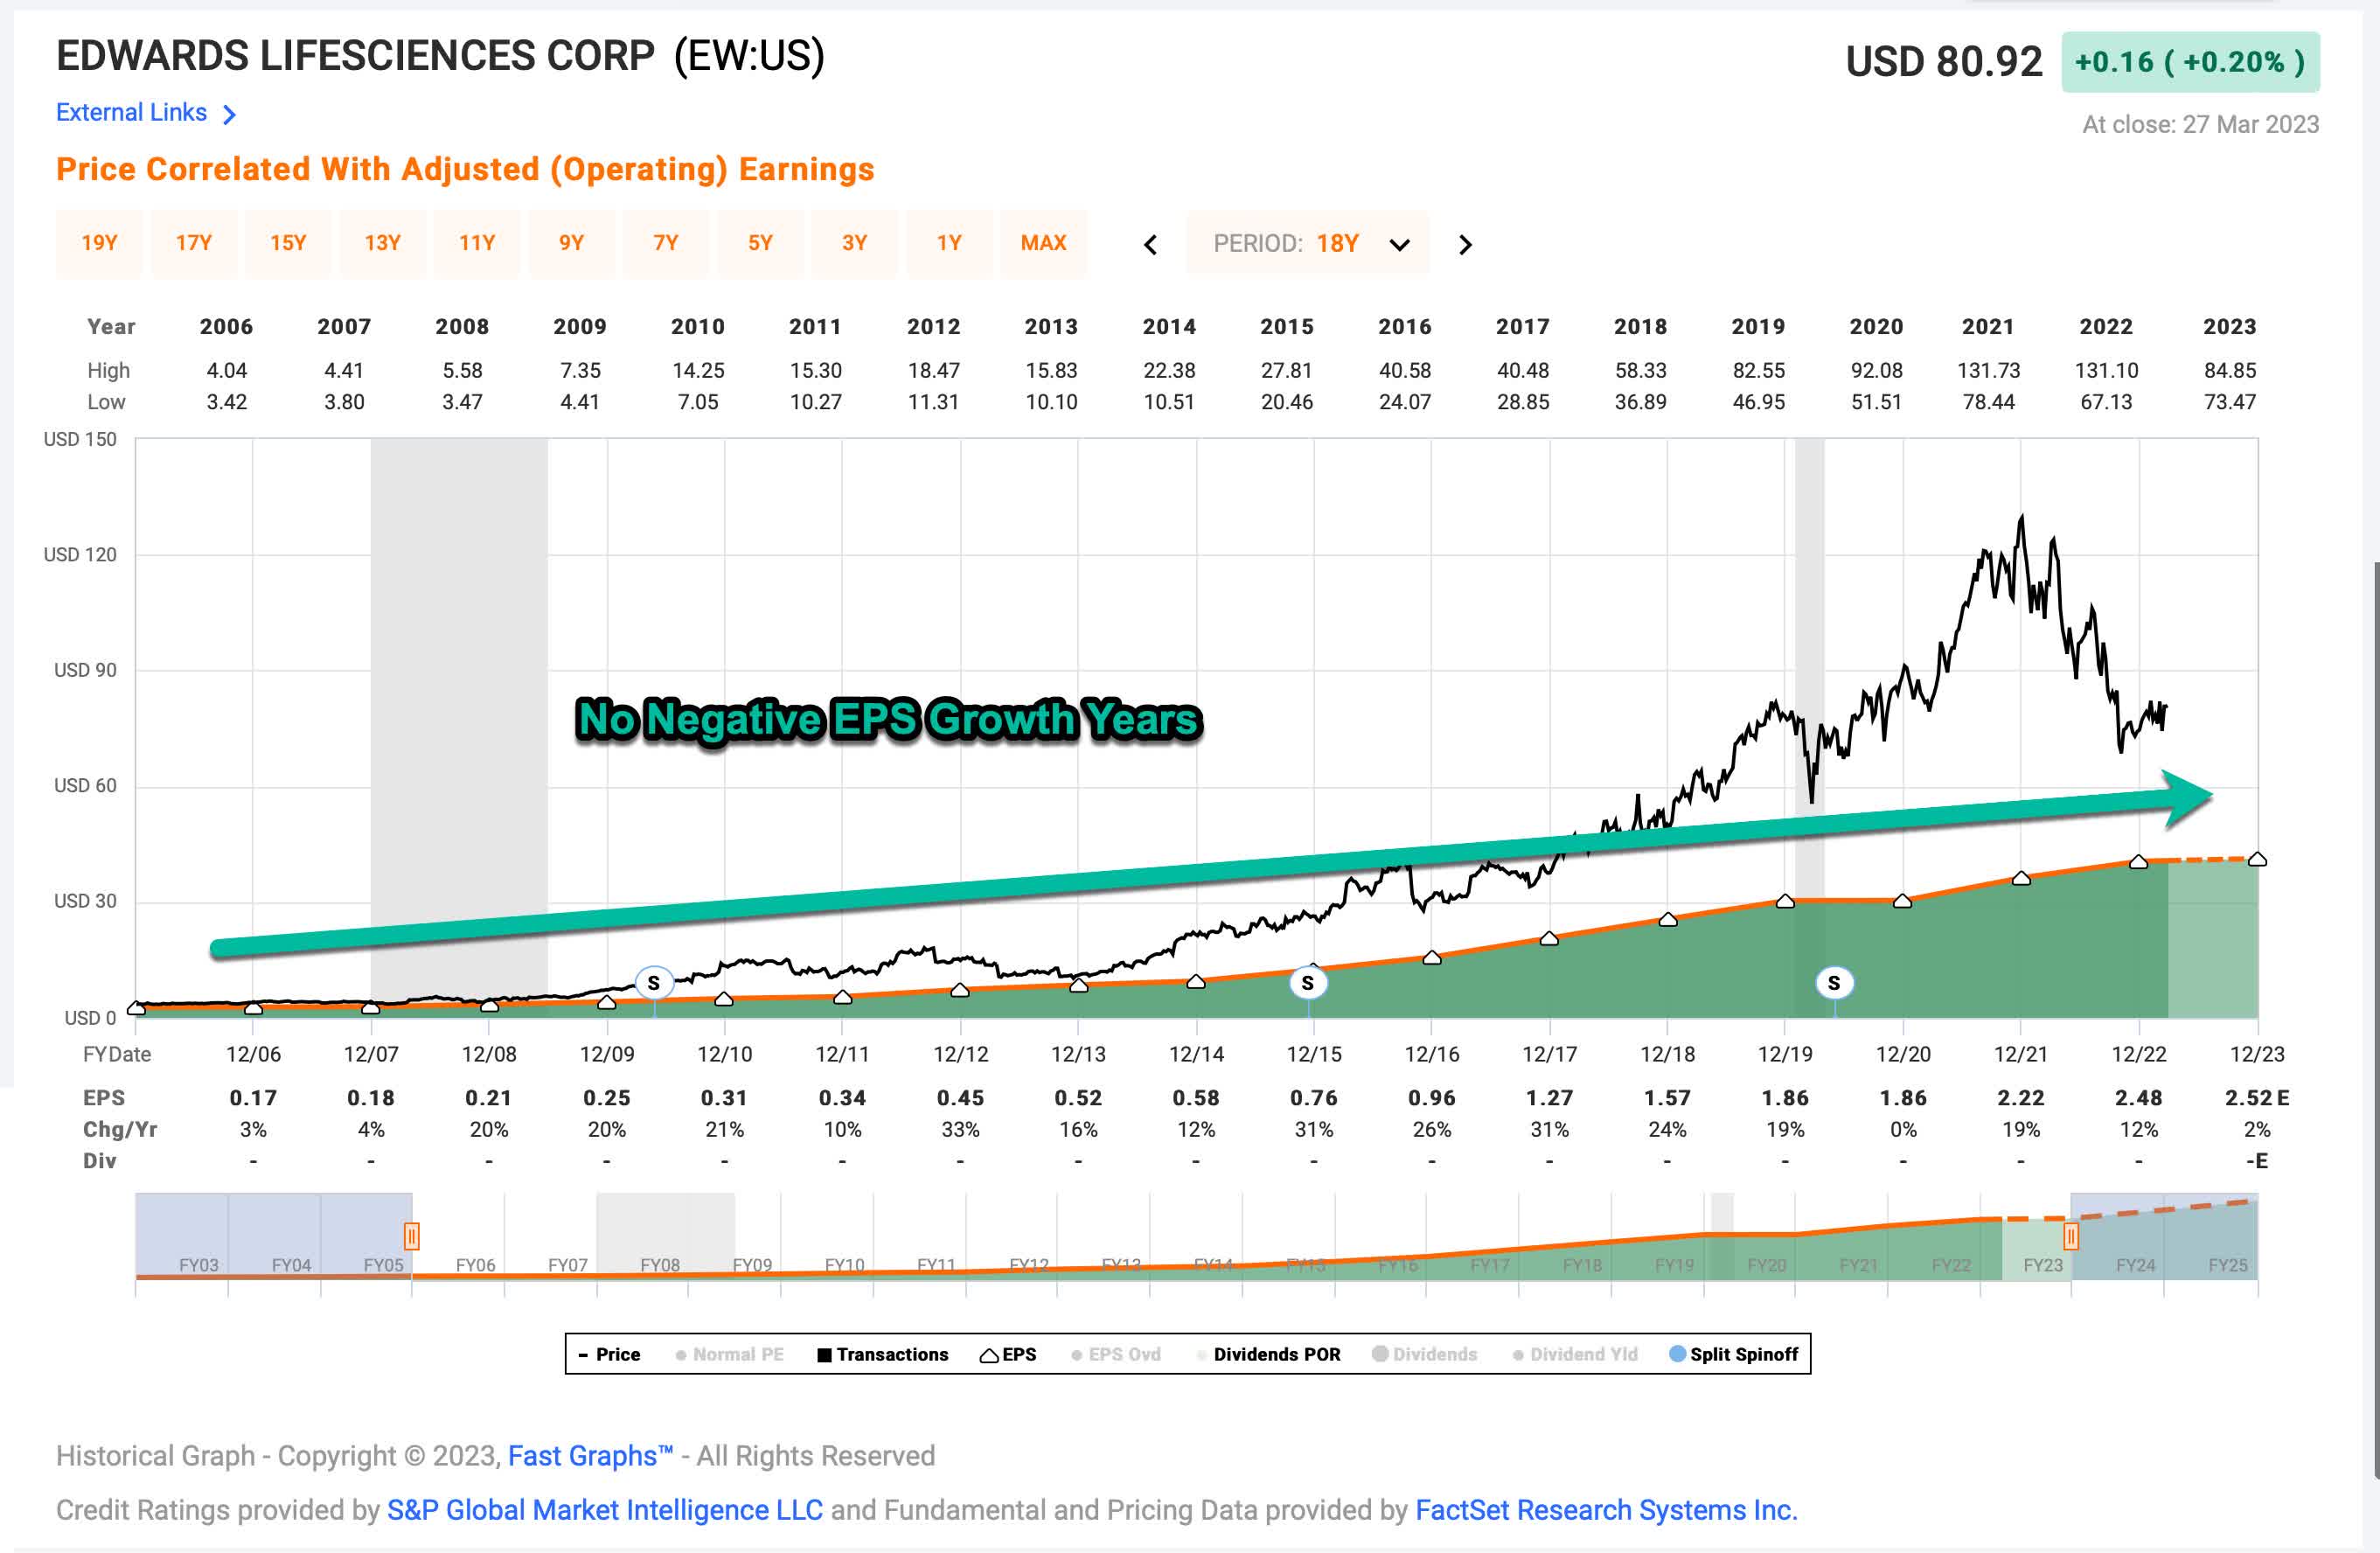
EW has been a remarkable business in that over the past 20 years they haven't experienced a single year of negative EPS growth. There have been some very slow years, like 2020, and this year is expected to be slow as well, but they've never had a negative growth year. This is extremely rare. The last time I checked this metric, there were only around a dozen publicly traded companies with this sort of earnings consistency and many of those have since had negative years either due to the pandemic or the post-pandemic earnings bust experienced by companies like Alphabet ( GOOG ) and Meta ( META ). This makes EW easier to analyze on an earnings basis because of its consistency.
Next, I need to select the historical time frame I want to use in order to estimate the earnings growth rate going forward. I will use a time frame from 2016 to 2023's expected earnings. This gives us a read on the recent trend, but with enough years to even out anomalies that might happen on occasion.
Because I'm going to use EPS in order to estimate earnings, I also check for any share buybacks that occurred over this period, because those will inflate the EPS growth rate by lowering the share count. (A rising share count, however, will already be incorporated in the EPS figure, so I won't make adjustments if the share count has risen.)
EW has bought back about 6% of the company since 2016. I will adjust for those buybacks in my earnings growth estimate.
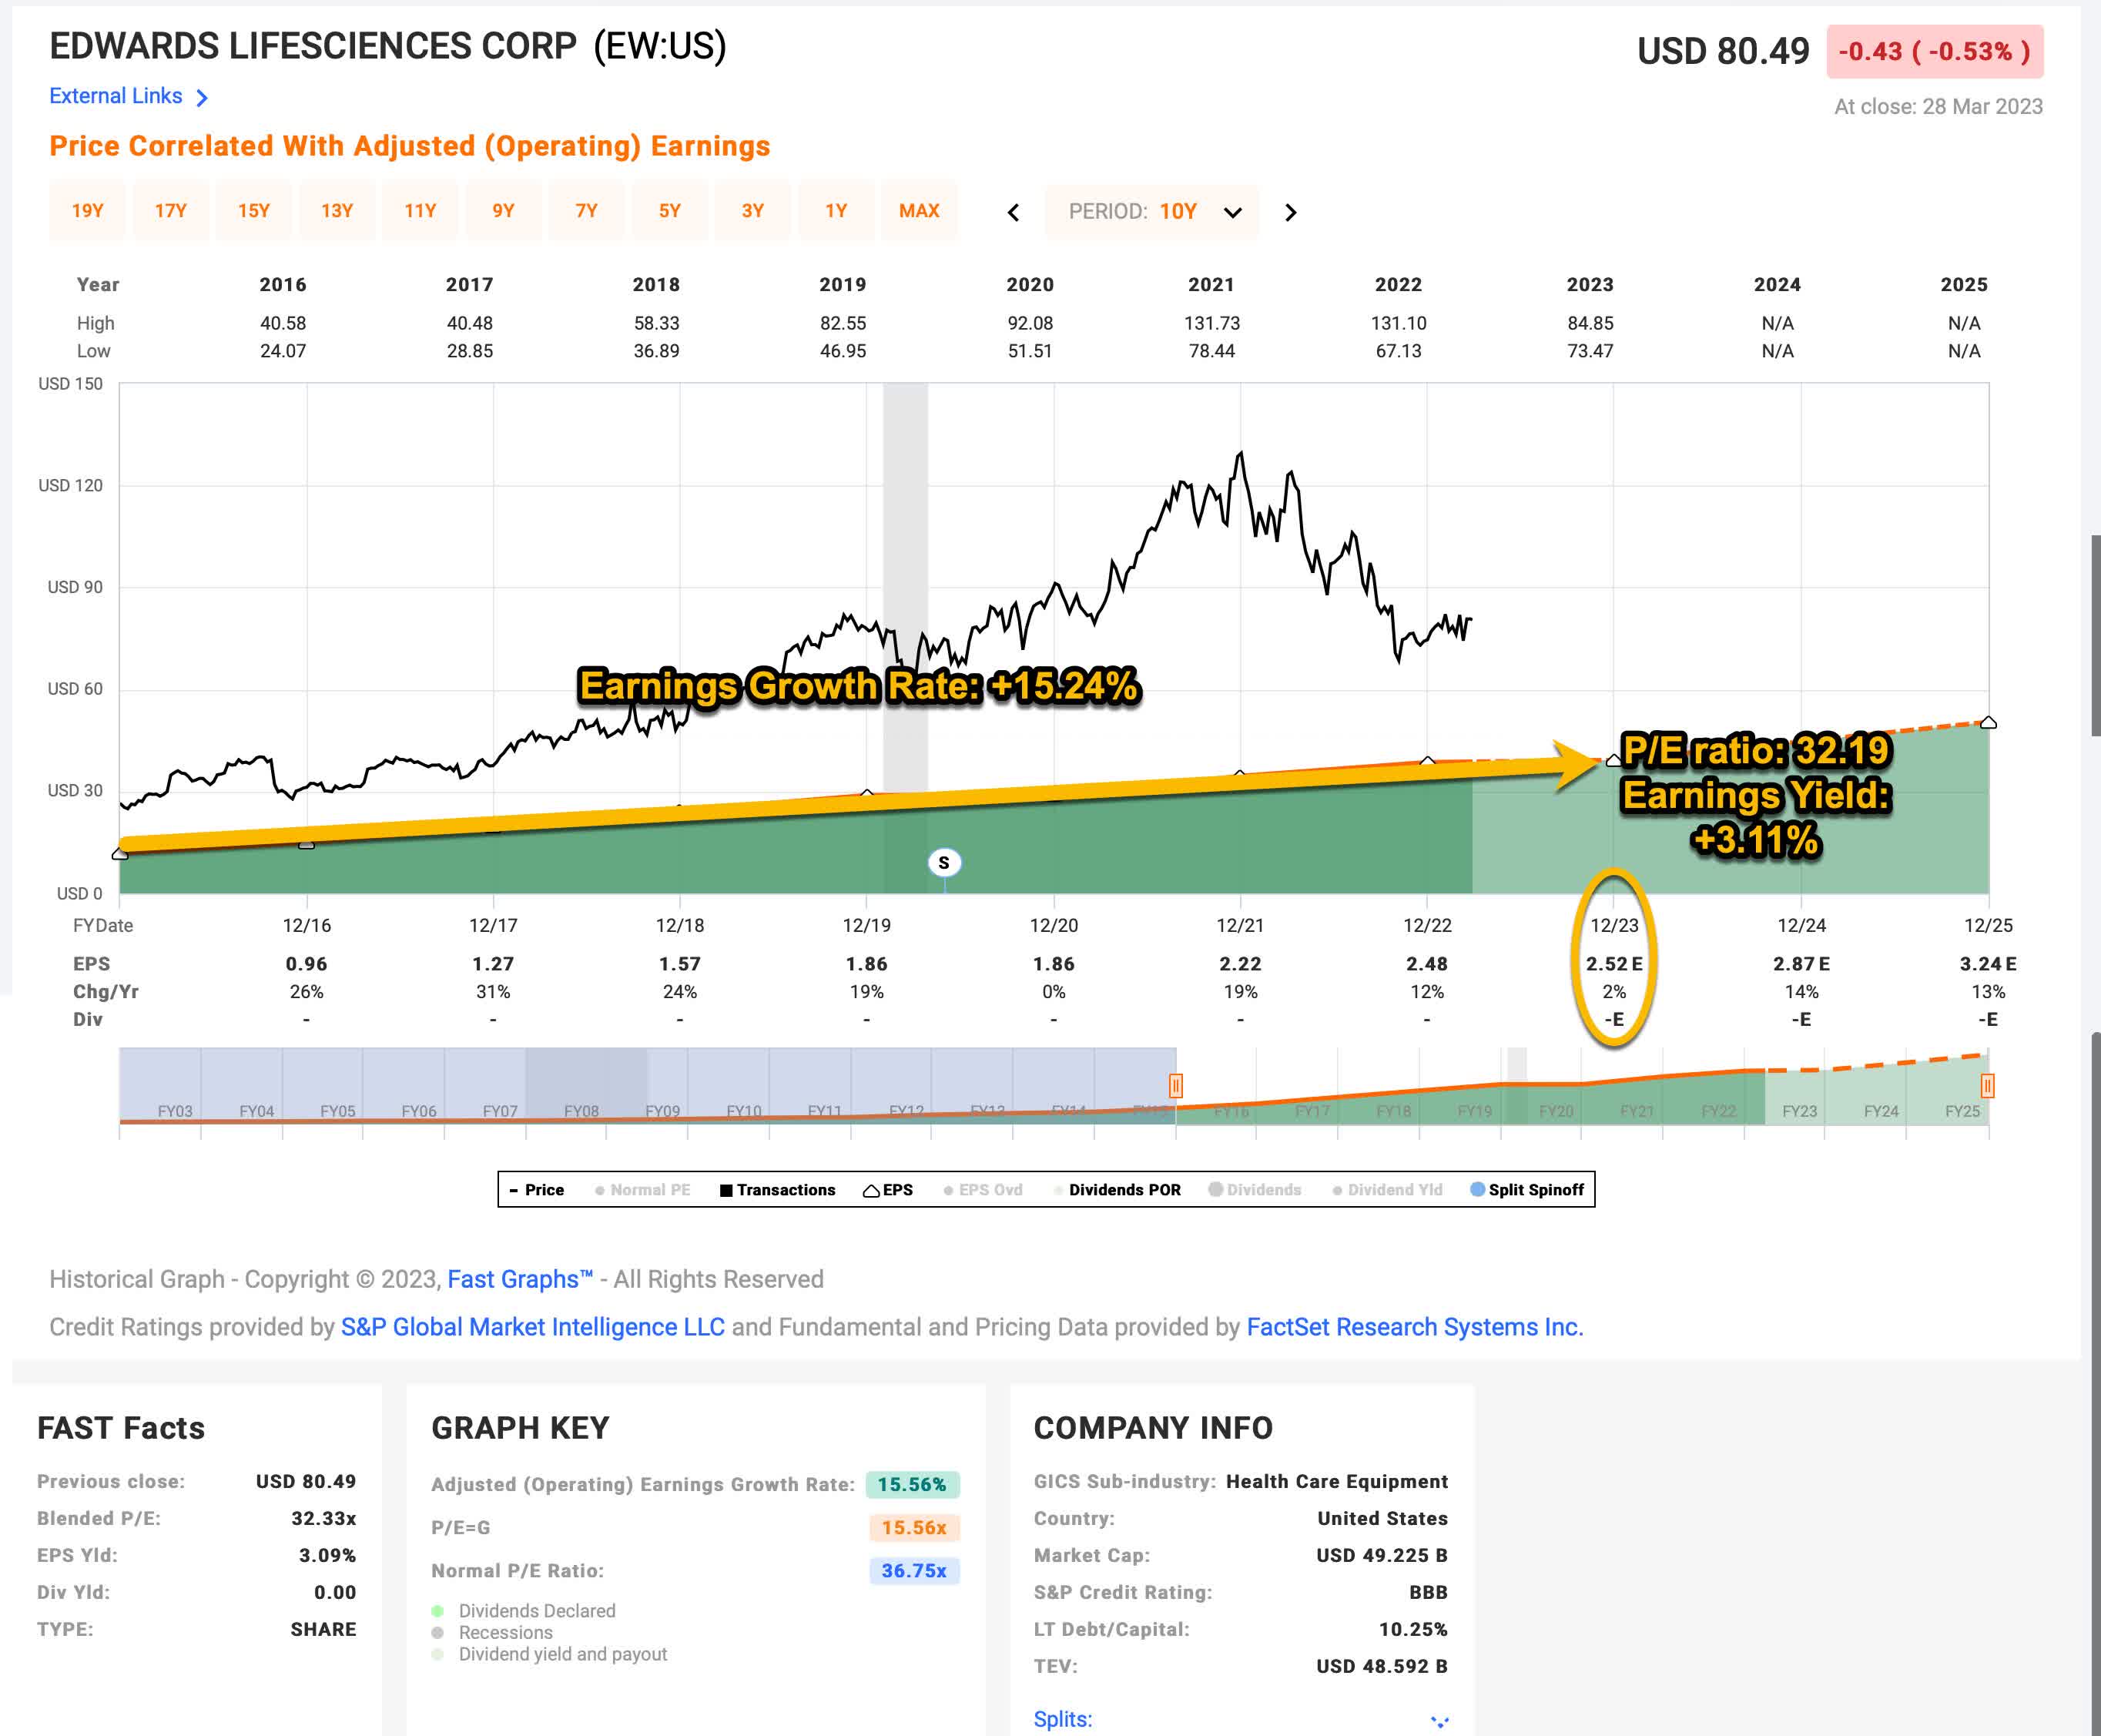
Above, I have another FAST Graph from the time period 2016 through 2023. I have annotated it with the data I will use for my 10-year collected earnings projections. Note that I am pulling forward 2023's expected EPS rate of $2.52 per share, which, at the current stock price translates to a P/E ratio of about 32.19, an earnings yield of +3.11%. The earnings growth rate from 2016 through 2023, has been about +15.24%. Because there were no negative earnings growth years and relatively few buybacks, my earnings growth estimate is similar to FAST Graphs' +15.56% calculation. There really isn't much happening here that's too difficult or requires a lot of adjustment.
The way I think about this is, if I bought EW's whole business for $100 with an earnings yield of +3.11%, it would earn $3.58 the first year ($3.11 plus +15.24% growth), and that $3.58 would grow at a rate of +15.24% each year, for 10 years total.
Below is a table that shows the expected cumulative collected earnings on $100 over 10 years.
| Year |
| Earnings for Year |
| Cumulative Earnings |
| 1 |
| $3.58 |
| $3.58 |
| 2 |
| $4.13 |
| $7.71 |
| 3 |
| $4.75 |
| $12.46 |
| 4 |
| $5.48 |
| $17.94 |
| 5 |
| $6.31 |
| $24.26 |
| 6 |
| $7.28 |
| $31.53 |
| 7 |
| $8.39 |
| $39.92 |
| 8 |
| $9.66 |
| $49.58 |
| 9 |
| $11.14 |
| $60.72 |
| 10 |
| $12.83 |
| $73.55 |
| Total |
| $73.55 |
| $100 + $73.55 = $173.55 |
So, if you bought EW at the current valuation for $100 and collected all the earnings for yourself you would have started with $100 and ended 10 years later with $173.55. This is a compound annual growth rate of about +5.67%.
Next, what I will do is take that long-term average earnings CAGR of +5.67% and figure out what that works out to after four years' time, since our goal is to estimate the returns over that time period. When I do that, it works out to a basic total return of +24.67%. So, over the next four years, if we disregard market sentiment and assume it stays the same, treating EW more like a private business, we could expect our total return in collected earnings after four years to be valued at about +24.67% if we assume the earnings trend will continue for 10-years total.
This return is the absolute return expectation if we assume that market sentiment for the stock is similar to what it is right now. But I think it's also worth comparing this expected 4-year total return to alternative investments. The two alternatives I will compare it to are the SPDR S&P 500 Trust ETF and the iShares Treasury Floating Rate Bond ETF ( TFLO ), which is what I'm currently using as my cash equivalent for investment money. The reason we compare to alternatives is to see if there are better simple alternatives that don't require a lot of skill to analyze, which basically anyone could own instead of the individual stock.
Using a similar method that I used with EW's earnings, I also track about half of the S&P 500 ( SP500 ) stocks using this method, which represents about 2/3rds of the S&P 500 weighting. If I use that group of stocks to estimate their 4-year expected returns, I get an absolute expected total return for the index of about +27.48%. And, I generally expect TFLO, or short-term treasuries, to yield about 4% per year over this time, or to produce a 17.00% total return in four years. Let's see what sort of return EW is likely to produce compared to these alternatives given these estimates.
| 4-Year No Mean Reversion |
| 4-year total return expectation |
| 4-year return expectation minus SPY's +27.48% |
| 4-year return expectation minus TFLO +17.00% |
| EW |
| +24.67% |
| -2.81% |
| +7.67% |
Overall, if sentiment remains the same for EW and the wider market, EW should be expected to have returns about the same as cash or the S&P 500 over the next four years.
It's always good to start with steady sentiment as a base for a valuation, but I've found that over the longer-term (and four years is starting to get into the "longer-term") stock earnings valuations tend to revert toward a mean of about a +7.00% 10-year earnings CAGR, which is the rough equivalent of 10% earnings growth at an 18 P/E ratio. (For a stock with the same earnings growth expectations as EW of +15.24%, we would expect an average P/E ratio of about 24.50 to be the "normal" P/E the market would be likely to pay.)
| With a Generic 7% 10-year Mean Reversion Assumption |
| 4-year total return expectation |
| 4-year return expectation minus SPY's +13.62% |
| 4-year return expectation minus TFLO's +17.00% |
| EW |
| +0.87% |
| -12.75% |
| -16.13% |
For comparison, if the S&P 500 index were to revert to a 7.00% 10-year earnings CAGR expectation it would produce a +13.62% total return after four years based on my estimates. TFLO's returns would be expected to remain about the same as before with a +17% return. If EW's business earnings produce an average return valuation by the market, it is likely to be roughly flat, with a +0.87% return. This is -12.75% (or -1,275 basis points) of difference between the S&P 500's +13.62% expected 4-year return. That isn't an especially big difference in expected returns over a 4-year time period. The relative returns compared to TFLO are pretty similar, with a -16.13% (or -1,613 basis point) spread. Again, when you consider these are always just rough estimates to use as a guide, they aren't really far apart from the alternatives.
Ratings & Explanations
Assuming my estimates are reasonably close, there are several ways to interpret these results. The things we don't know, even if the earnings return estimates end up being fairly accurate, are what sort of mood the market will be in and how the wider economic conditions might influence the returns in four years. If we are in a deep recession at that particular time, then we would naturally expect the earnings to be lower, while if we are in some sort of economic boom, we would expect them to be higher. So, using relative returns is a way to somewhat control for macroeconomics. If we are in a recession, then it's likely SPY will perform poorly as well, so the difference between those returns is what we care about if we want to control for macro conditions.
Using mean reversion, on the other hand, helps to account for how people feel about certain stocks at certain times and what sort of returns investors are willing to accept. In this case, EW and SPY do not have a significant difference between the two of them, even though SPY is expected to perform a little better.
Different investors might have different assumptions and expectations about sentiment and macro conditions will be, so that's why I first provided the expectation without assuming mean reversion. That said, I do generally assume that after a period of four years, the chances are good that mean reversion will take place for most stocks, so, personally, I care about the mean reversion estimates the most. Additionally, I aim for a 4-year mean reversion expected return that is about 75% before I buy a stock based on earnings valuations. If I write about a stock (and earnings are not expected to drop because of a near-term recession) and it has a 75% 4-year return expectation, I will buy it, and those stocks will earn a "Strong Buy" rating from me.
Because I know I'm aiming for higher returns than many other market participants, I will rate stocks a "Buy" if the 4-year mean reversion total returns are 25% (2,500 basis points) higher than both SPY and TFLO, because these will likely be above market average returns and above cash average returns.
If the 4-year mean reversion returns are within 25% (+/- 2,500 basis points) of SPY, then I would consider that stock a "Hold." I don't consider any of my estimates superbly precise. They are meant to work as a rough guide, where we can take action if they reach extremes. So, within this range, I don't have a strong opinion about the stock one way or the other.
If the 4-year mean reversion returns are likely to underperform SPY or TFLO, i.e., cash, by -25% (-2,500 basis points) or more, then that stock would get a "Sell" rating from me.
And, finally, if a stock is likely to underperform both SPY and TFLO by more than -25% or (-2,500 basis points) over the course of four years then the stock would be a "Strong Sell."
I use -25% as the threshold because it's enough of a difference that a person could sell a stock, pay a full 20% long-term capital gains tax on the sale, and still come out ahead. If a person is dealing with a bigger tax bill than 20%, then they should do the math and figure out what that level is and use that as a guide for their selling threshold.
At today's price and earnings growth expectations, Edwards Lifesciences stock over the next four years is expected to perform within +/- 2,500 basis points of the S&P 500 and cash, so I would rate this stock a "Hold" at its current price.
Assuming that the earnings growth estimate and market valuation remains the same, EW would cross my "Buy" threshold at about $59 per share, at which point I would expect it to outperform both cash and the S&P 500 significantly. My personal buy price, which contains a margin of safety and would be likely to produce very good medium-term returns is about $42 and would be "Strong Buy". Keep in mind that embedded into these buy prices is the assumption that interest rates will remain close to the historical norm and not go back near 0%, or, that we will have a bad recession. This adjustment explains why my buy price today is actually slightly lower than it was in March 2020 when I did expect rates to stay very lower for longer during the height of the pandemic.
Conclusion
On a relative basis, EW seems fairly valued at its current price if earnings growth picks up next year (currently that is what analysts expect). It likely won't produce great returns over the medium-term, though. It's important to keep in mind that my estimates assume that EW will resume its historical earnings growth. I think the biggest risk with the stock is that it fails to do so. If I owned the stock, I would be watching earnings closely and if there are signs earnings have stalled for a longer period of time beyond 2023, I would reassess the valuation. Businesses have to grow at a fast rate in order to support 30 P/E ratios over time. As it stands at this particular point in time, I would give them the benefit of the doubt based on their history, and rate the stock a "Hold".
For further details see:
Where Will Edwards Lifesciences Stock Be In 4 Years?