REG - Whether And How REIT Leverage Is Better Today
2023-11-28 06:30:00 ET
Summary
- REITs' financials are not accurately captured by computers due to realities that are not reflected by GAAP and also to adjusted numbers.
- REIT balance sheets have improved in terms of debt maturities, liquidity, and maturity ladders, but Loan to Value ratios have not significantly changed.
- For specific REITs, investors should focus especially on the debt maturity ladder.
REITs are a small, niche market. Because of the structure of their businesses, their financials are not accurately captured by computers that gather and process SEC filings.
A big reason for that is that many details that matter are not reported in standardized ways. One example is how much capital is used for recurring capex (which goes by multiple names), to maintain the value and productive capability of owned property. It takes a knowledgeable reading of the filings to tease it out.
Overall REITs themselves make this worse, producing adjusted numbers by adding actual costs back into operating profits, calling the result something like “Core FFO,” with FFO being Funds From Operations. Only a few take the responsibility of reporting cash earnings as Funds Available for Distribution or FAD. Two of these are Equity LifeStyle ( ELS ) and Boston Properties ( BXP ).
These circumstances lead to the production and promulgation of a great deal of material about REITs that is outright wrong or at least misleading. Not only are the computers routinely wrong; many authors publish nonsense.
Some authors completely misunderstand the REIT business model and write descriptions and arguments that are so general as to be worthless. This is amusing, if a bit tragic, as we most often see it from financial advisors who are thereby failing their clients.
REITs span nearly 20 subsectors and come in many flavors. Any broad generalization will prove to be false.
Other authors, especially on SA, apply their formulaic analysis of any business whatsoever to specific REITs and draw conclusions about value. These are often easy to spot because they devote more than trivial attention to GAAP Net Income.
Such authors fail to understand that well-maintained properties sustain or even increase their value over time. This makes GAAP depreciation irrelevant.
Some of these authors go further over the edge and declare that GAAP depreciation is a good approximation of maintenance capex. This is about as dumb as you can get. Haven’t they ever owned (or read about owning) a rental house?
A consequence of all the above is that REITs are often mispriced. This enables astute investors to get outsized dividend yields and appreciation, by comparison with better-understood market sectors.
This opportunity led me to become a REIT-focused investor. In support of that I became a REIT analyst and have now spent more time studying REITs than it took to complete my doctorate in Physics following my bachelors.
There are three reasons behind my writing about REITs. One is that decades of experience has taught me that you don’t really know something thoroughly until you explain it in writing (or teach it). The second is that readers (like students) make comments and some of those improve your thinking. The third is that I am addicted to writing.
What I am not is a REIT booster. We also have plenty of those on SA too.
I often agree with the conclusions of some REIT advocates. But the frequent poor quality of their arguments drives me nuts. We take up one aspect of that below.
Some REITs at some times are good investments in support of specific goals. Loving any particular one (or any other investment) is dangerous to your wealth.
My goal is to do objective and rational analysis and let the chips fall where they may. The idea is that this will enable me to maximize the degree to which my investments serve my goals.
This takes me around to my topic today.
Is REIT Leverage Better Today?
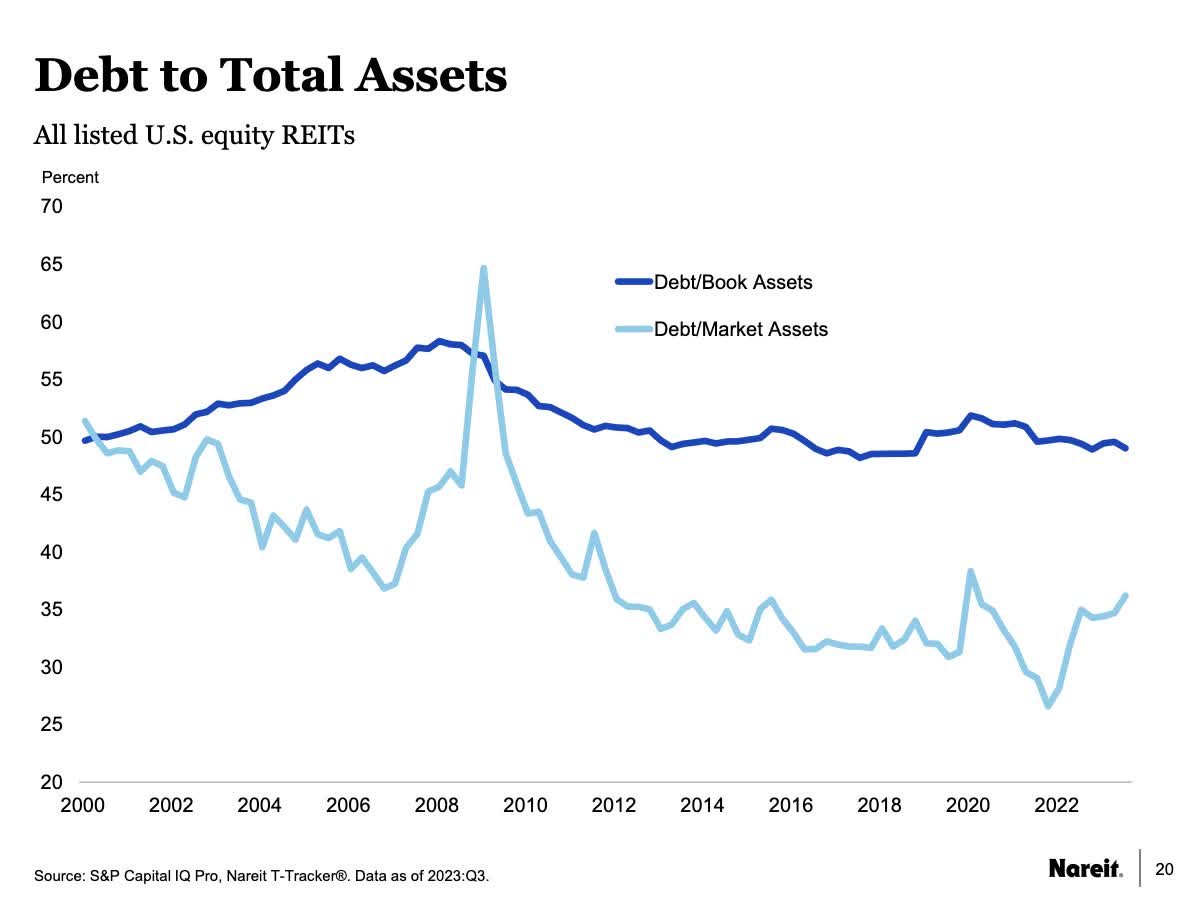
One often sees the claim that REIT leverage is very much lower today than it was 20 years ago, and also the claim that the Great Recession was a big turning point. In support of this authors tend to show a version of this plot from NAREIT:
The labeling on this plot used to be misleading but has lately been improved. The lower curve was long described as a “Debt Ratio” (and still is in NAREIT’s REITwatch). The plot appears in the NAREIT “T-Tracker” but the data are found in their “REITwatch,” where the definition is found in the appendix.
[The poor labeling and claims by some authors said about this plot took me in too for quite a while. Only later, upon digging into what these curves actually plotted, did I realize how poor an indicator of leverage they are.]
What matters is that Debt/Market Assets is NOT “Loan to Value.” It is the ratio of Debt to EV, with EV being Enterprise Value, the sum of Debt and Market Cap. This makes the most widely cited measure of REIT leverage dependent on stock-market valuations.
What happened historically is that Debt/EV started the century near 50/50, then REIT earnings multiples (e.g., P/FFO) doubled. This alone would have pushed Debt/EV down to about 1/3.
But guess what? Property values are not determined in the stock market. A doubling of the stock price in no way implies a doubling of property value.
Plus, even if it did, that would just represent good luck. It would not represent improved robustness of REITs.
The other curve shown on the plot is the ratio of Debt to Book Assets. This is rightly criticized by REIT advocates because Book Assets are inaccurate for REITs.
Much better is Gross Property, but even that could miss the existence of any real property appreciation. The implication is that the upper, darker curve is too high on the plot. The reality should lie between the two curves shown.
Here is Debt to Gross Property for a few REITs. Debt is defined here as Total Liabilities plus Preferred Stock.
RP Drake
Among this group, only AvalonBay fits the standard narrative that leverage was reduced strongly in response to the Great Recession. The other three all took different paths.
The four as a group have this ratio in the low 50s in 2003 and the mid 40s today. Still, that is a relatively small change.
For three of them, it seems a bit more accurate to say that Debt/Gross Property has declined since early in the 21st Century. But Public Storage ( PSA ) is an exception.
A better indication is how the various REITs talk about their targeted leverage for new acquisitions, since this is not confused by history. Anecdotally, I recall mostly seeing numbers in the low 40s, and the entire blue-chip, multifamily subsector is systematically lower than that.
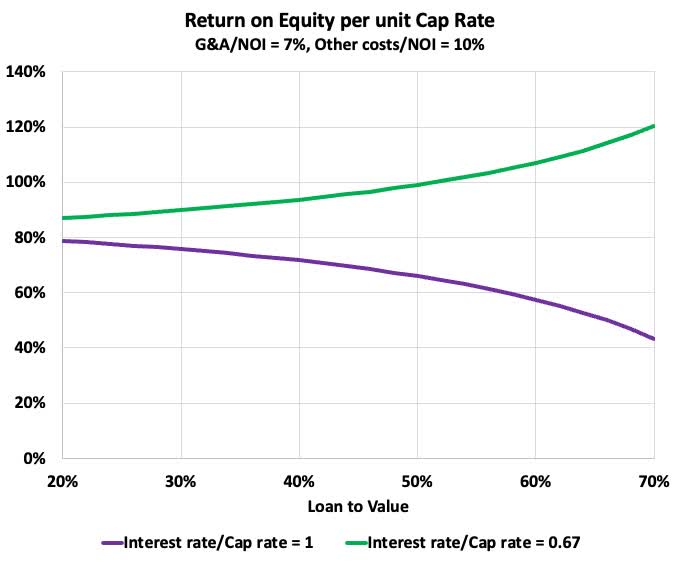
Looking at numbers, this aspect of leverage only makes an incremental difference anyway. If we suppose that G&A costs are 7% of NOI and other costs (save interest expenses) are 10% of NOI, we get this plot for the return on newly invested equity:
Here the abscissa is Loan to Value or LtV. The two curves correspond to two ratios of interest rates to cap rates. The values used, 1 and 2/3, span most recent history save that ratios were at times lower during the idiocy of ZIRP.
The idea here is that you multiply the value shown by the cap rate to get return on equity, or ROE. If interest rates are 4% and cap rates are 6%, so the ratio is 2/3, then for 40% LtV the ROE is 5.7%.
Note that this does not depend at all on the stock market. The comparison of the ROE to the earnings yield in the markets would ideally tell the REIT whether to invest retained earnings, to go further and issue new stock, or to return capital to shareholders.
Some REITs pay a lot of attention to this [read the latest earnings call by Simon Property Group ( SPG )]. Others seem more into empire building no matter what.
Our point today, though, is that until LtV moves above about 50%, the impact of changing interest rates is quite modest. Changes in LtV when it is below 50% do not make some REIT a far better investment. In other words, a lot of the advocacy one sees is not correct, either with regard to whether LtV changed or with regard to any change in Return on Equity.
Are REIT Balance Sheets Better Today?
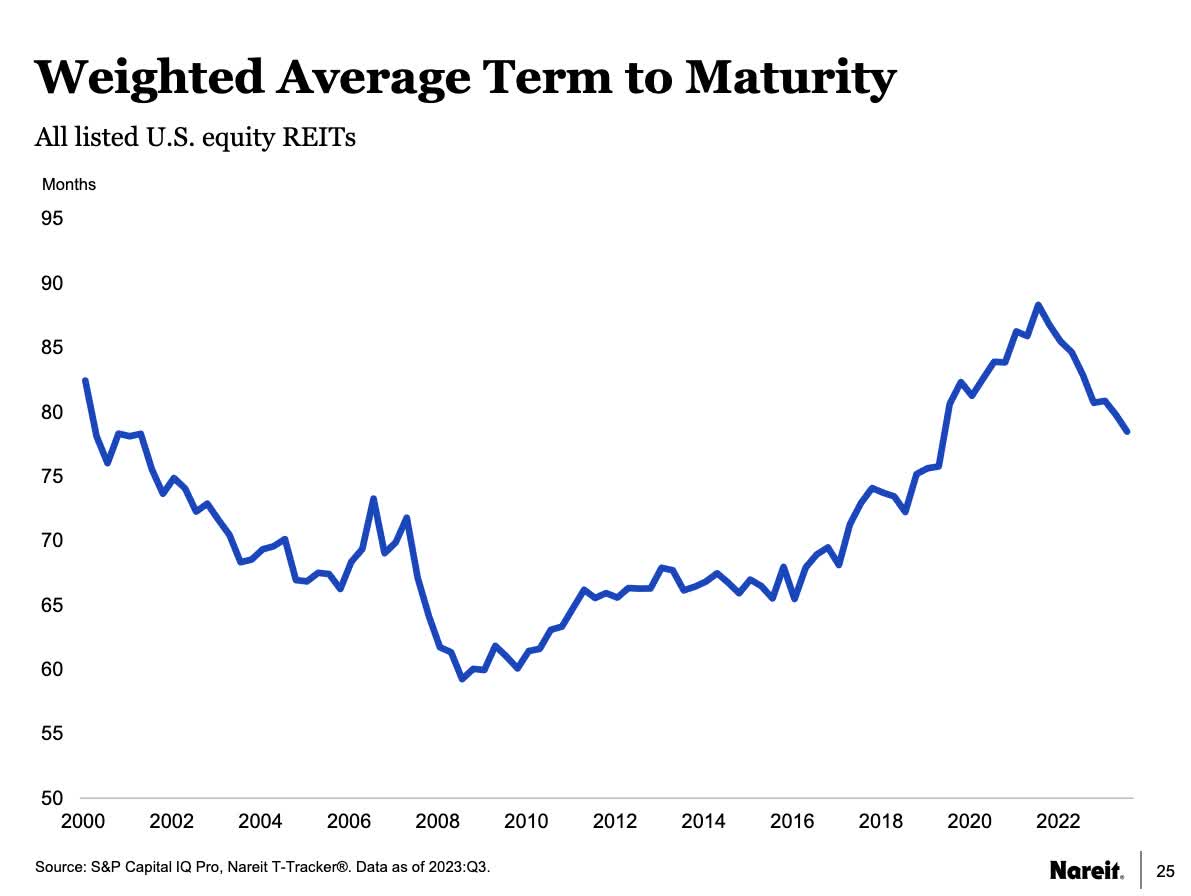
What everyone should focus on is two other plots. The most important is this one:
Half the inverse of the weighted average term to maturity is the characteristic fraction of debt that must be rolled or repaid each year. This dropped steadily for the first 8 years of this century.
By 2008 10% of REIT debt had to be rolled or repaid each year. In my view this contributed significantly to the great stress when the Great Financial Crisis froze the debt markets.
Dividends were cut en masse, net acquisitions went negative for nearly three years, and development activity crashed by a factor of several. Anecdotally a lot of stock was issued to meet the need for equity to pay down debt (NAREIT seems not to have a plot on this aspect). And there were many mergers too, with stronger REITs acquiring weaker ones.
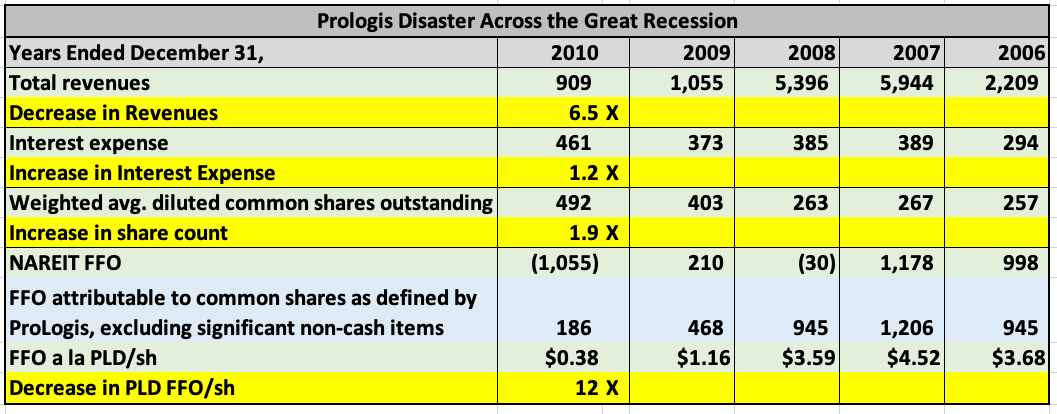
We can see how this played out in one case by dropping in on Prologis. Prologis merged in 2011 with AMB Property Corp, who became the surviving entity but changed the name of the combined company to Prologis. This reliably confuses various computers and it takes clever searching on Edgar to find the pre-merger Prologis filings.
Those filings let me construct the following table. The rows shaded yellow show the factor by which the item in the row above changed from 2007 through 2010.
We see that revenues dropped 6.5x, interest expenses increased 20%, and the share count nearly doubled. The impact was a decrease of 12x in PLD’s adjusted FFO/sh (which makes far more sense than the NAREIT FFO of those years).
A key corporate goal was this, as expressed in the 2010 10-K: “… focus on staggering and extending our debt maturities.” Overall, they were able to roll their debt but also paid it down a fair bit via asset sales.
This specific example illustrates the general trends mentioned above. PLD in particular, and REITs in general, had their debt maturities too short and insufficiently staggered.
Improving this from 2010 to 2012 made a difference in the robustness of REITs, but a much bigger change came from 2016 forward. You can see the increase in average maturity in the plot above from below 6 years in 2016 to above 8 years recently.
What enabled that was this:
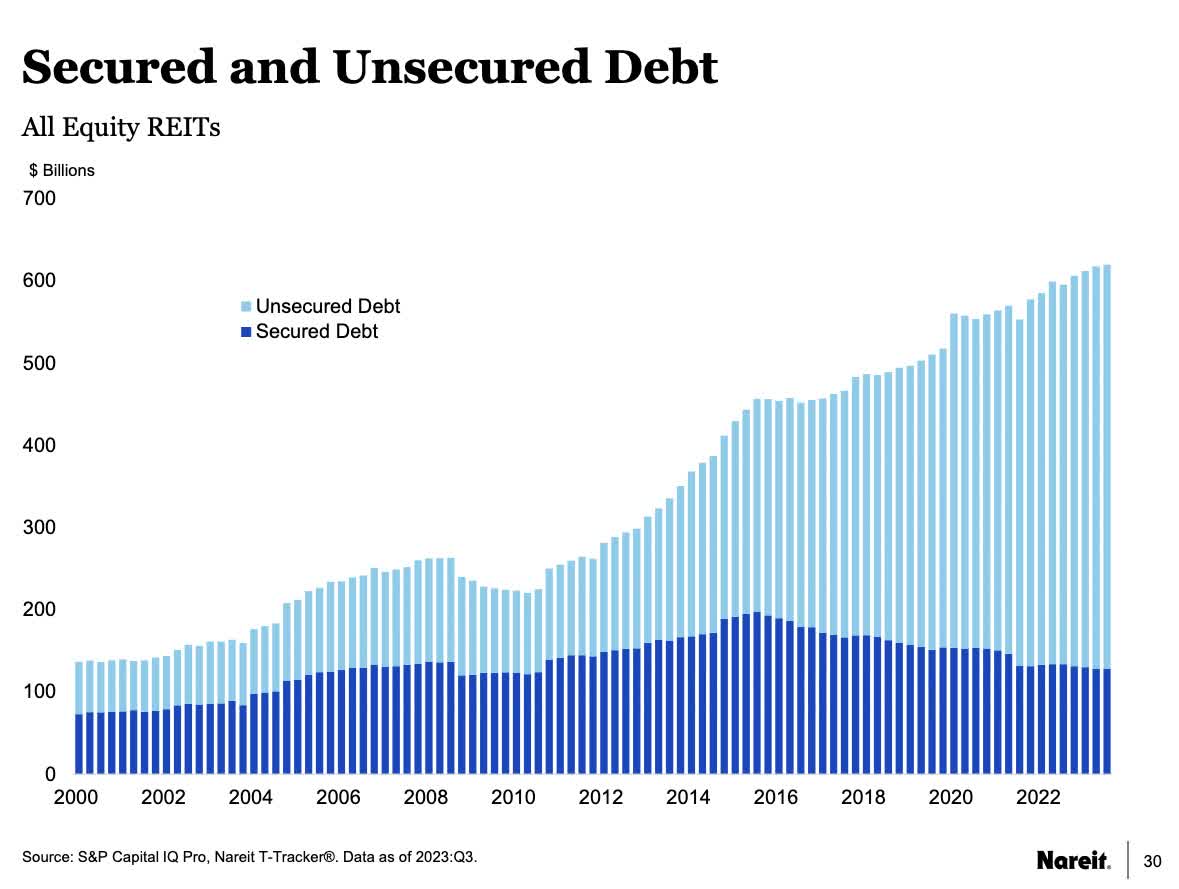
Unsecured debt can be placed with far longer maturities than mortgages. The move to a much larger fraction of such debt is what enabled REITs overall to push out their average debt maturities. This in turn improved their ability to survive events like the interest-rate spikes of the past two years.
And we have seen some debt placed with remarkably long maturities, even this year. Simon Property Group has gone back to placing 30-year debt. NNN REIT ( NNN ) did so in 2021 and pushed their weighted average debt maturity out past that of their lease terms.
REITs also have emphasized liquidity, carrying more of it than they did prior to 2008. I’ve looked in detail at Simon, who increased their liquidity by a few following that earlier period.
This better preparation helped them in 2020. By the time 2020 rolled around we saw many REITs [examples include Federal Realty Investment Trust ( FRT ) and EPR Properties ( EPR )] draw down their credit lines to build a cash reserve against adversity. Afterward, usually in 2021, they paid it all back.
During the pandemic, REITs whose operations were shut down by government fiat often did cut their dividends, but we saw very little dilutive equity issuance. In this respect REITs were far more ready to cope with disaster, which remains true today.
Maturity Ladders
The other goal that Prologis had in 2010 was to better stagger their debt maturities. Today they have their debt very nicely laddered and have relatively small maturities until 2026.
One of the best maturity ladders seen by me is the one put together by Spirit Realty Capital ( SRC ):
Spirit Realty Capital
This ladder, from earlier this year, had no maturing debt for nearly two years. Starting in 2026, the Senior Unsecured Notes matured at about $400M per year for 7 years.
The ladder looks a bit more front-loaded because of the Credit Facility and Term Loans. Having a Credit Facility makes a huge difference in being flexible and quick in response to opportunities. But getting it usually means you have to carry a term loan or two.
These floating-rate obligations are usually supplied by a consortium of banks. The expectation is that they will be rolled forward.
Spirit was smart in having them mature a couple years in the future; many REITs are not that smart. Having later maturities further reduces the already small risk that these loans would not be rolled.
REITs that carry some mortgage debt end up with ladders that are more front-loaded, because of the shorter maturities of the mortgages. One example is BXP (from my article last June):
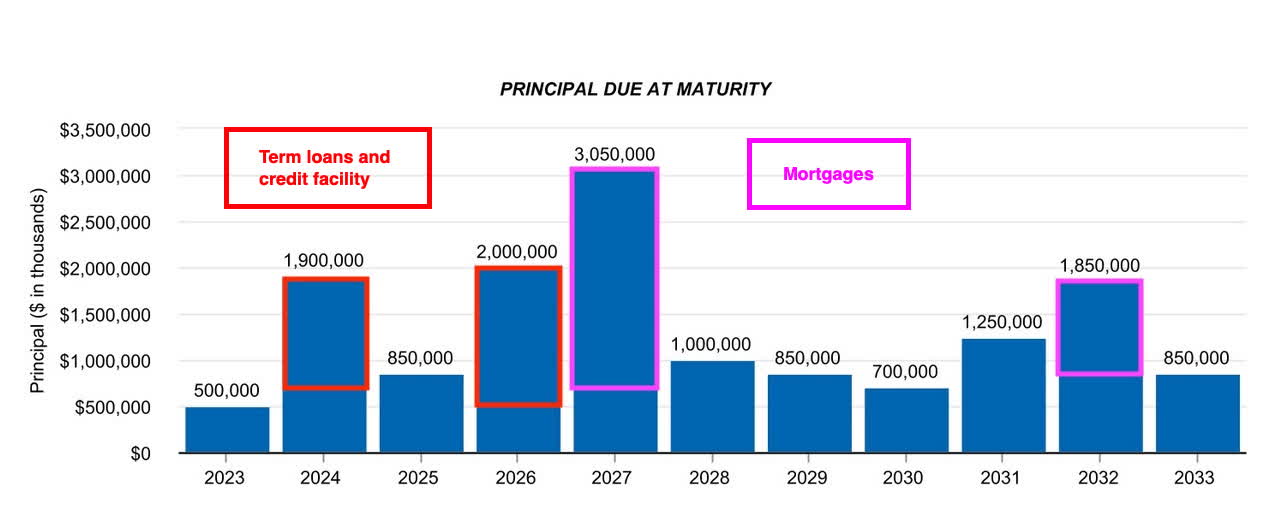
This dates from earlier this year. BXP did not take the trouble to label the term loans, credit facility, and mortgages. Once one does so the debt looks a lot less dangerous.
While my preference would be to have seen less debt due in 2024, BXP has an FFO above $1B and $2.7B in liquidity as of their Q3 report. Plus they did clear out 2023 and were busy adding liquidity and pushing out mortgage debt.
The big REITs seem to me to be more casual than many moderately sized ones about near-term maturities. They can afford it, but I’d prefer to see a more conservative approach. Overall, though, they tend to have near-term maturities that are a small fraction of FFO, as I discussed here .
In contrast, many Canadian REITs (and some US REITs) have maturity ladders that should feature in horror movies. Here is one from Q3 this year for Northwest Healthcare Properties [NWHP].
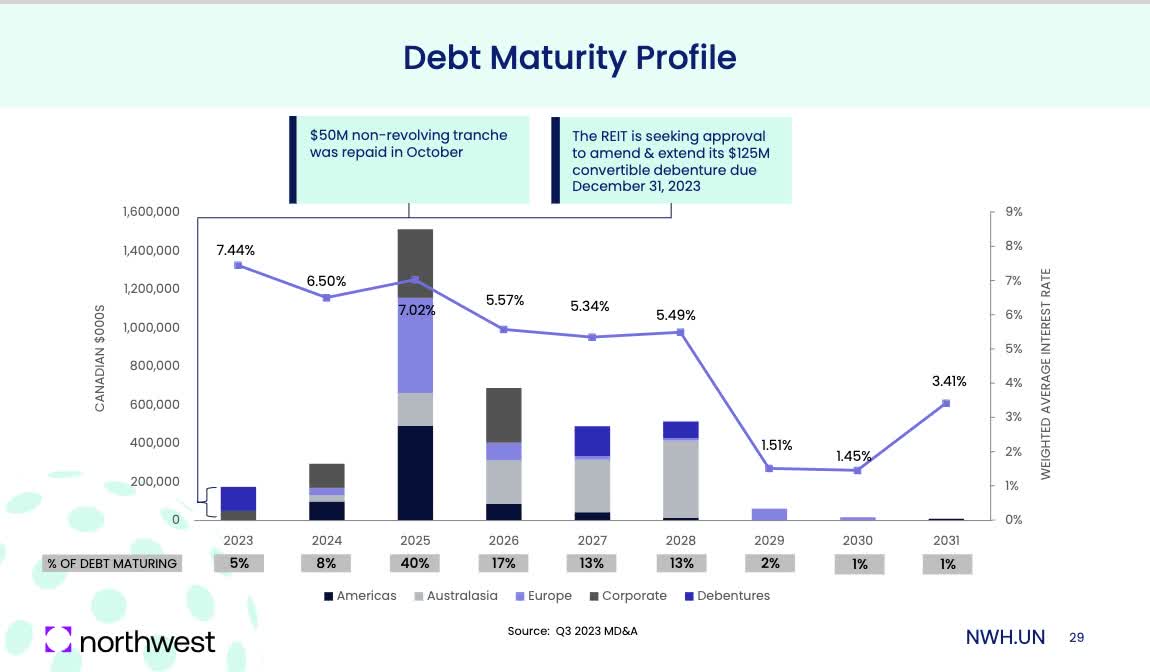
Their FFO is less than $200M, as is their liquidity. Even ignoring the upper, dark gray bars, which are the “Corporate” term loans and credit facilities, the debt due in 2023 (still! as of Sept. 30) and 2024 is about equal to their FFO and the debt for 2025 is nearly six times their FFO.
For any such REIT, it does not take much loss of revenue to send FFO negative. One can find some opportunities that seem very appealing amongst REITs with large ratios of maturing debt to FFO. Debt to EBITDA does not always capture this aspect.
But such REITs are subject to both execution risk and event risk. My view is that their investment risk is substantially higher than what one gets from the REITs that are better in this respect.
The overall point here is that REIT maturity ladders are not uniformly better than they were in 2007. Some are far better. Others are merely OK. Some are still horror stories.
A REIT investor should look at this for any REIT they consider. Do not believe that “things are better” just because you see such claims.
Better Today?
My conclusion here is that yes, (most) REIT balance sheets are better today and more resistant to trouble than they were in 2008. Overall they carry more liquidity, have longer debt maturities, and have better maturity ladders.
This helps explain why few REITs had major problems in 2020. It also helps explain how the dramatic increase in interest rates in 2022 caused lower earnings growth but few earnings decreases.
However, the apparent improvement in Loan to Value is a mirage. There are changes, but not enough to matter much.
From the standpoint of balance sheets, these blue-chip REITs are among the most deserving of your attention:
I’m long the first two but lately REG has been too pricey for my goals.
For further details see:
Whether And How REIT Leverage Is Better Today