JEPI - Which Is The Better Buy: SCHD Or JEPI?
2023-07-19 15:31:07 ET
Summary
- JEPI and SCHD are 2 very popular ETFs with 2 very different strategies.
- Both ETFs have lagged the market in 2023, but there's only one clear winner moving forward.
- JEPI has only been around for roughly three years, but it has blown up in popularity, with many "copycat" funds starting out after.
When it comes to investing, there are a lot of ways to make money. What works for one person may not for another. However, everyone should have a strategy and stick to that strategy.
For some, growth stocks fit their strategy. For others, it might be dividend growth stocks, or high-yield dividend stocks, or just plain ETFs and/or Index Funds. Strategies could include a blend of all different types of stocks and fixed income, but the key is to invest in what works for you and your risk profile.
For me personally, I started by building my foundation on strong ETFs, and then mixing in dividend stocks, primarily dividend growth stocks, and even some growth stocks. However, the key is to have a firm foundation and proper diversification. ETFs can provide both of these things.
So today, we are going to focus on 2 POPULAR ETFs with 2 VERY different strategies:
- Schwab US Dividend Equity ETF (SCHD)
- JPMorgan Equity Premium Income ETF (JEPI)
Breaking Down JEPI vs SCHD
JPMorgan Equity Premium Income ETF (JEPI)
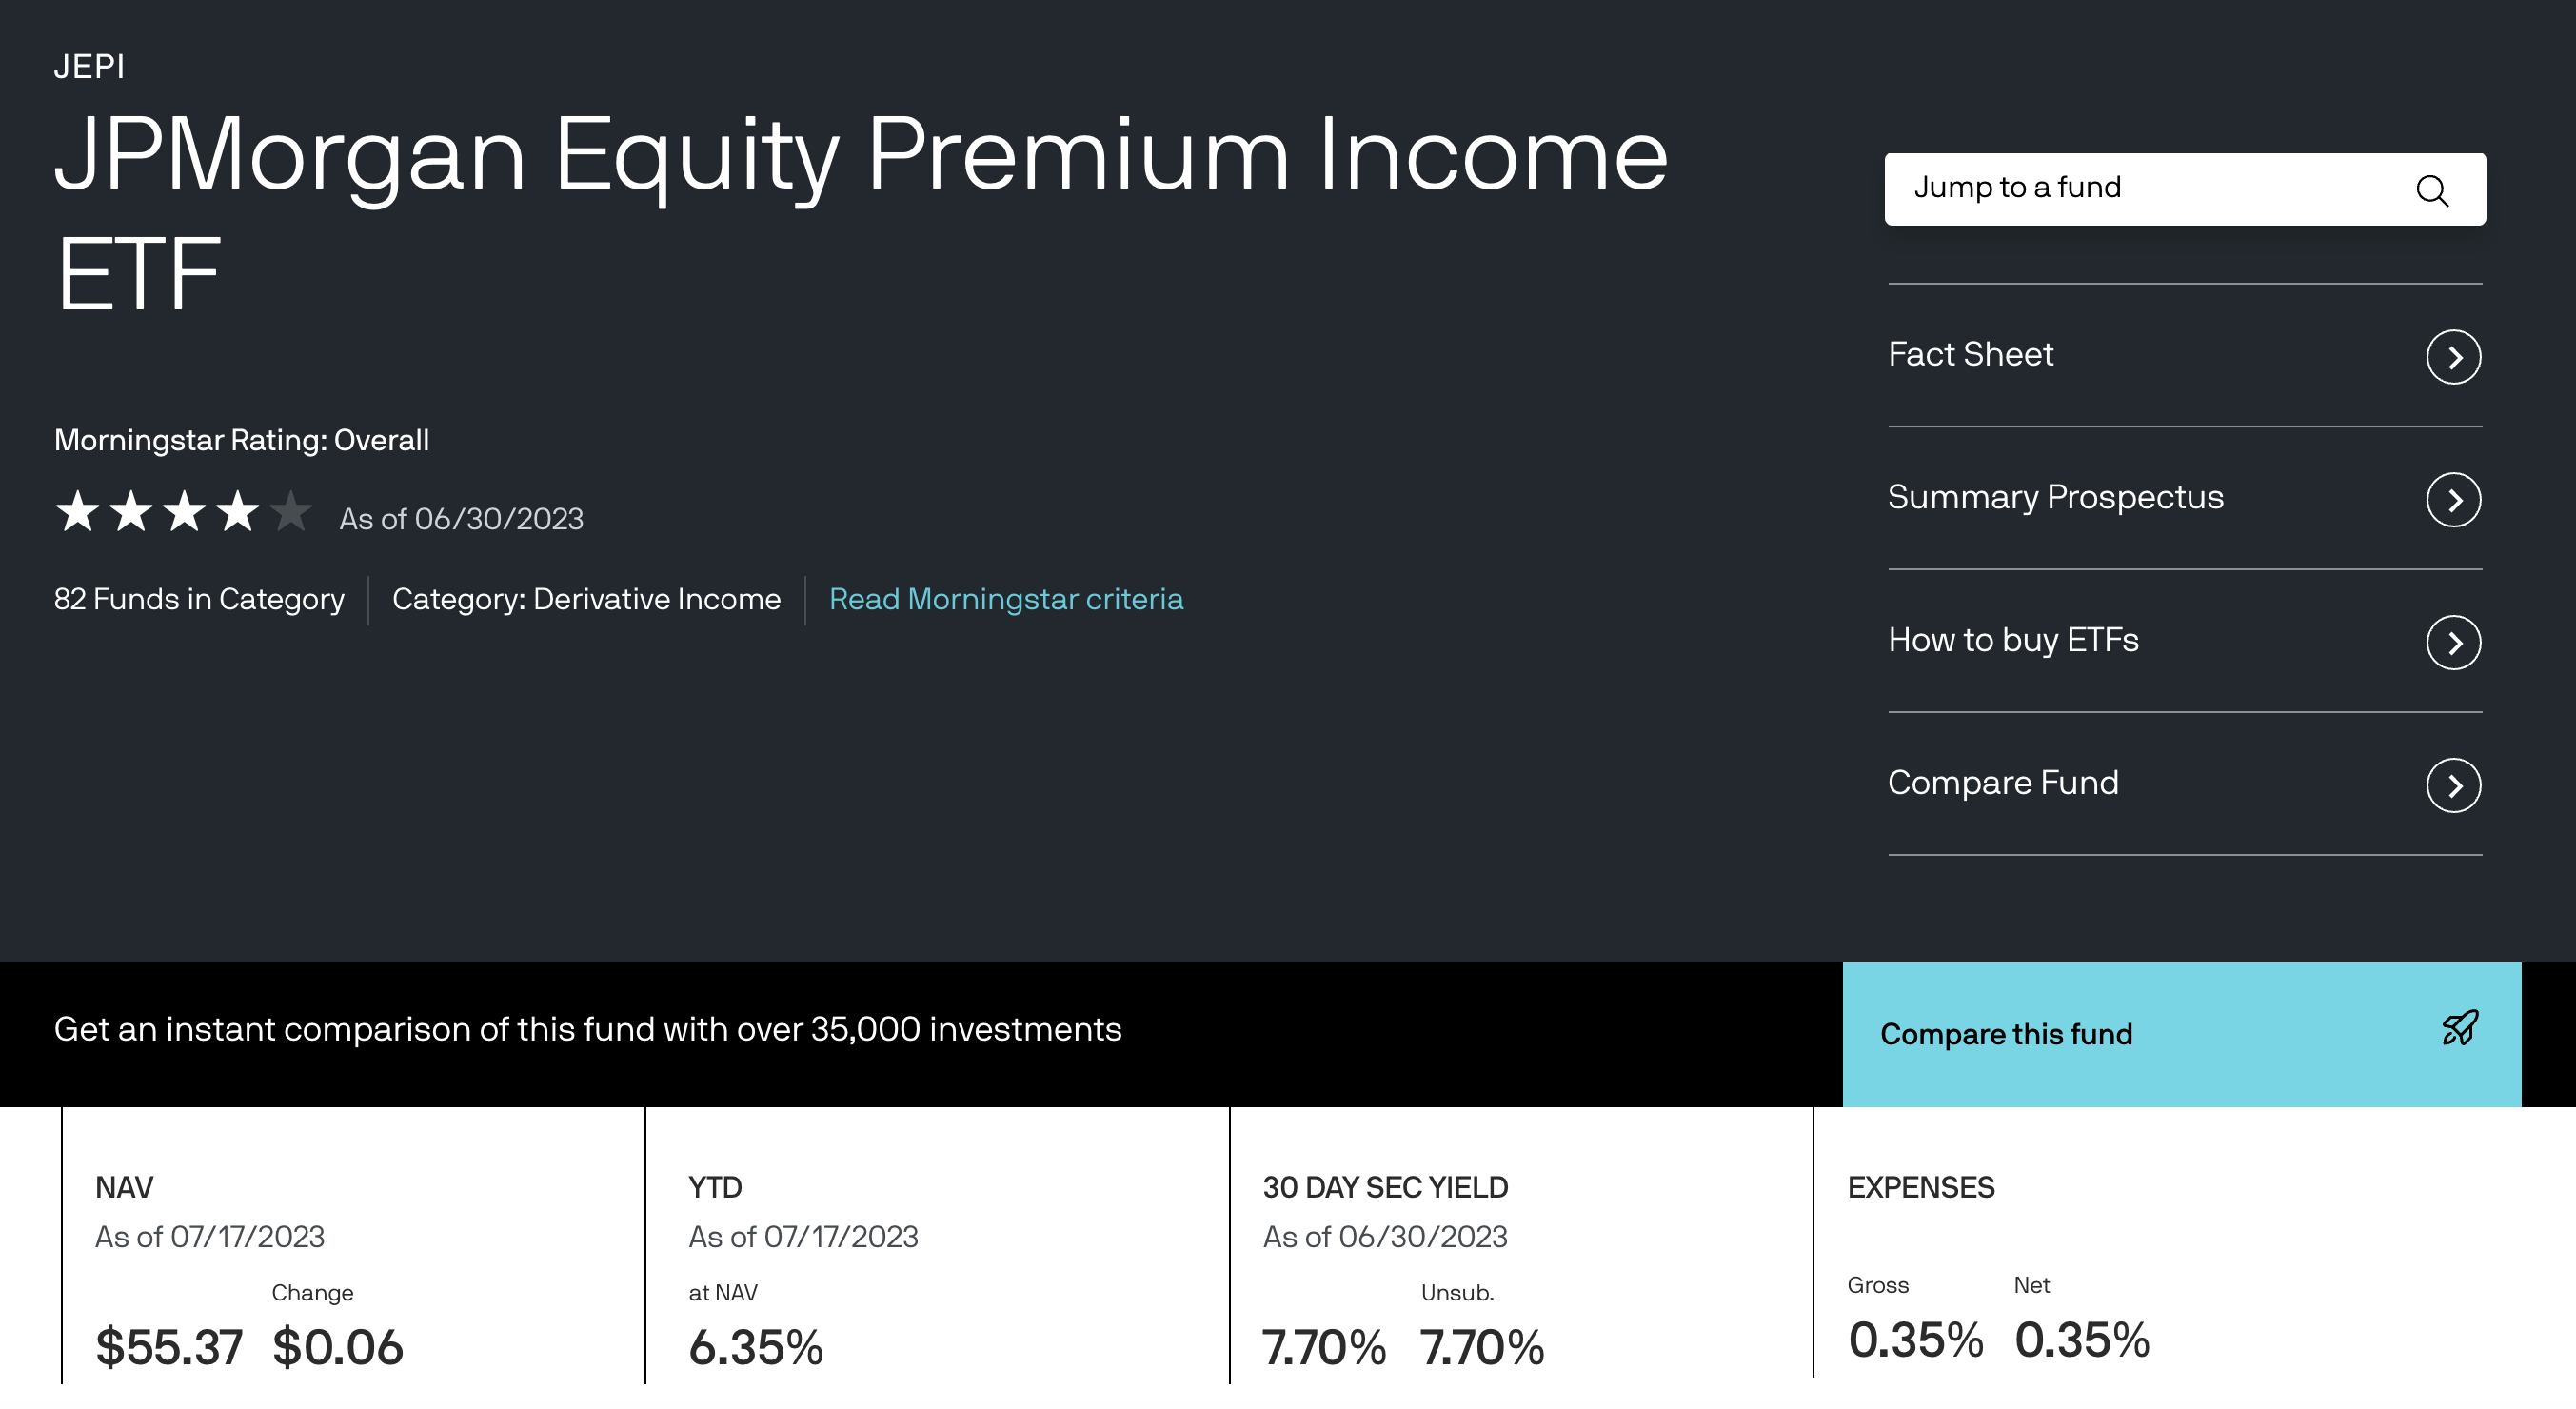
This ETF was founded in 2020 and has become quite popular in such a short period of time. Morningstar gives the ETF 4 out of 5 stars. JEPI currently has more than $28 billion in assets under management.
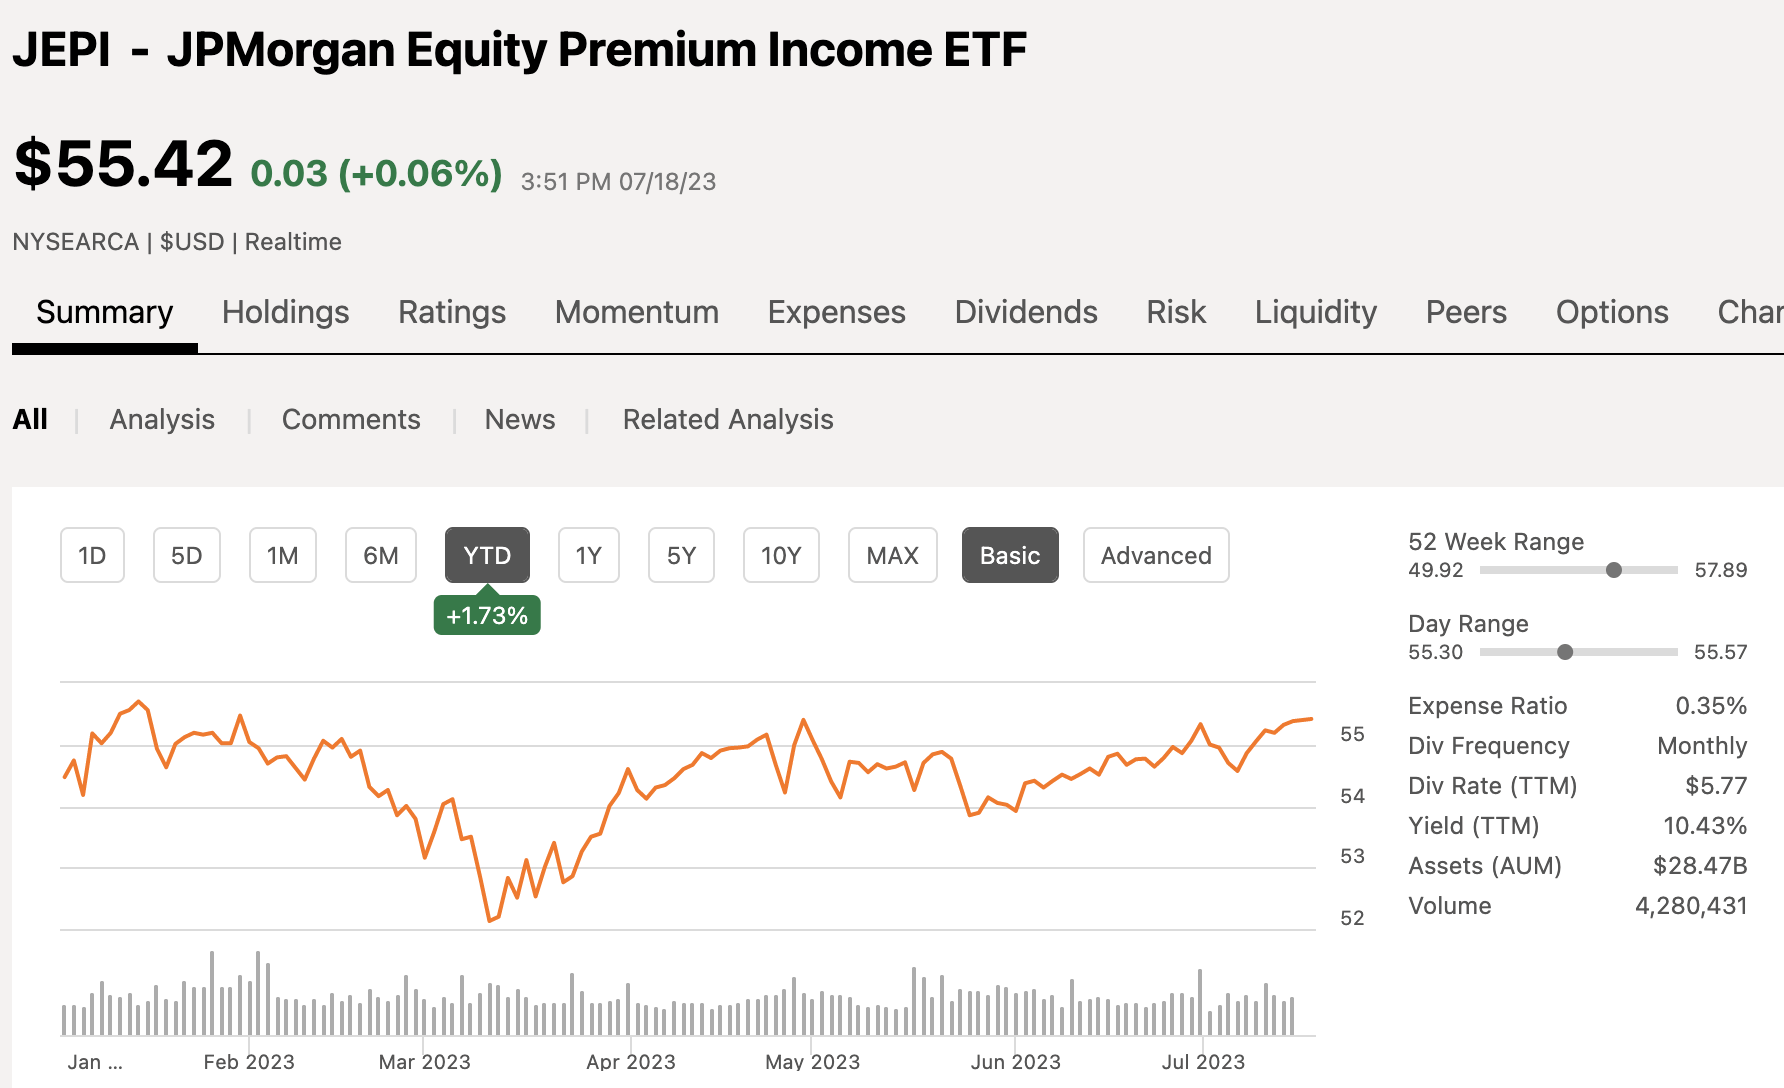
Looking at the chart here, you can see that over the past 12 months, the ETF is pretty much flat and up only 1.75% YTD.
In addition, looking at the chart above, you can see that JEPI has an expense ratio of 0.35%, which is not all that bad for an actively managed ETF. After all, when you look at JEPI, they have a turnover rate of 195%, meaning they are selling in and out of positions regularly.
I recently covered JEPI in a piece that compared to very similar ETFs, comparing JEPI to its sister fund JEPQ, which focuses more on Nasdaq and higher beta stocks.
The strategy behind JEPI is to buy and sell low beta stocks. Low beta stocks are less volatile in nature as they track more closely with the S&P 500. High beta stocks tend to be more volatile.
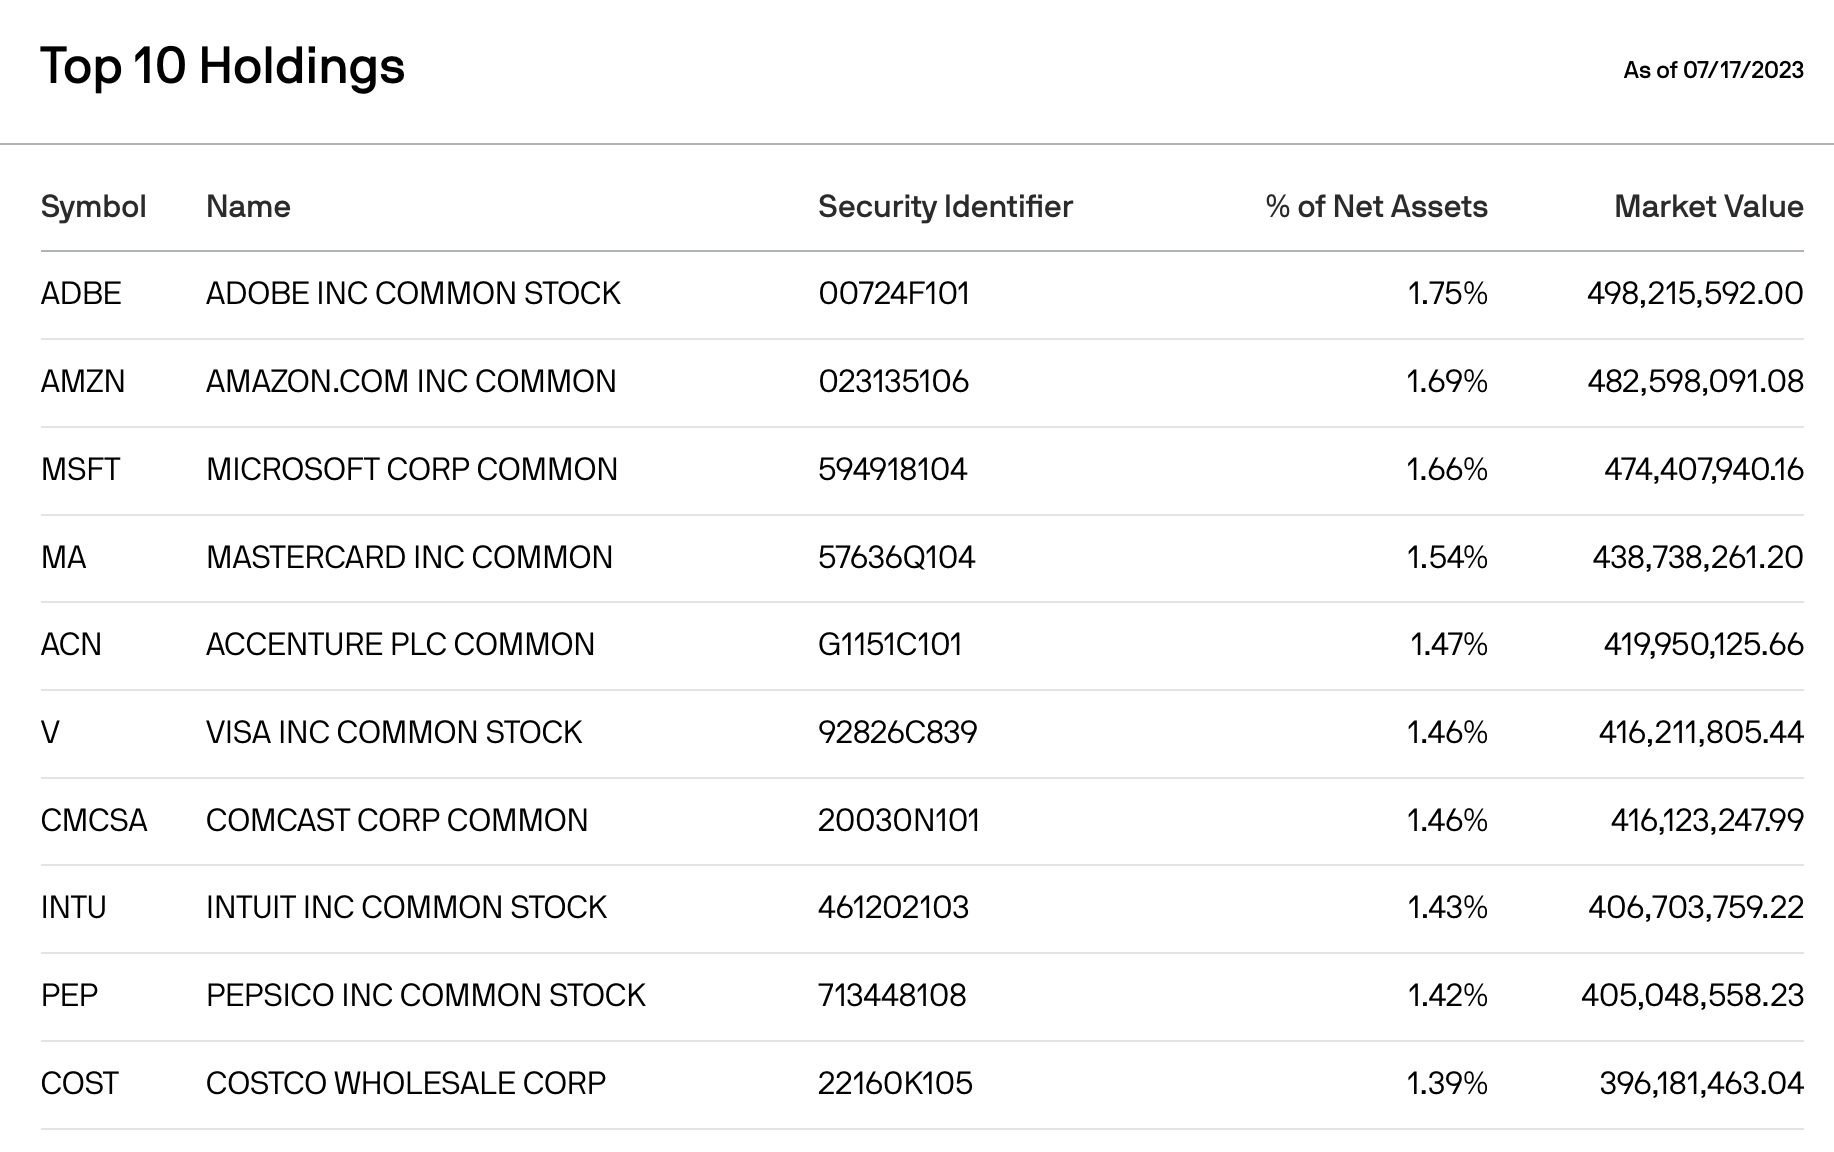
Let's next take a look at the funds portfolio. JEPI has 135 total positions and a turnover rate of 195%, which tells you how often managers are buying and selling out of positions.
Looking above at the top 10 holdings, you can see that all the positions are rather close in terms of exposure, with the top position only accounting for 1.75% of the fund and that stock is Adobe (ADBE), followed by Amazon (AMZN) accounting for 1.69%.
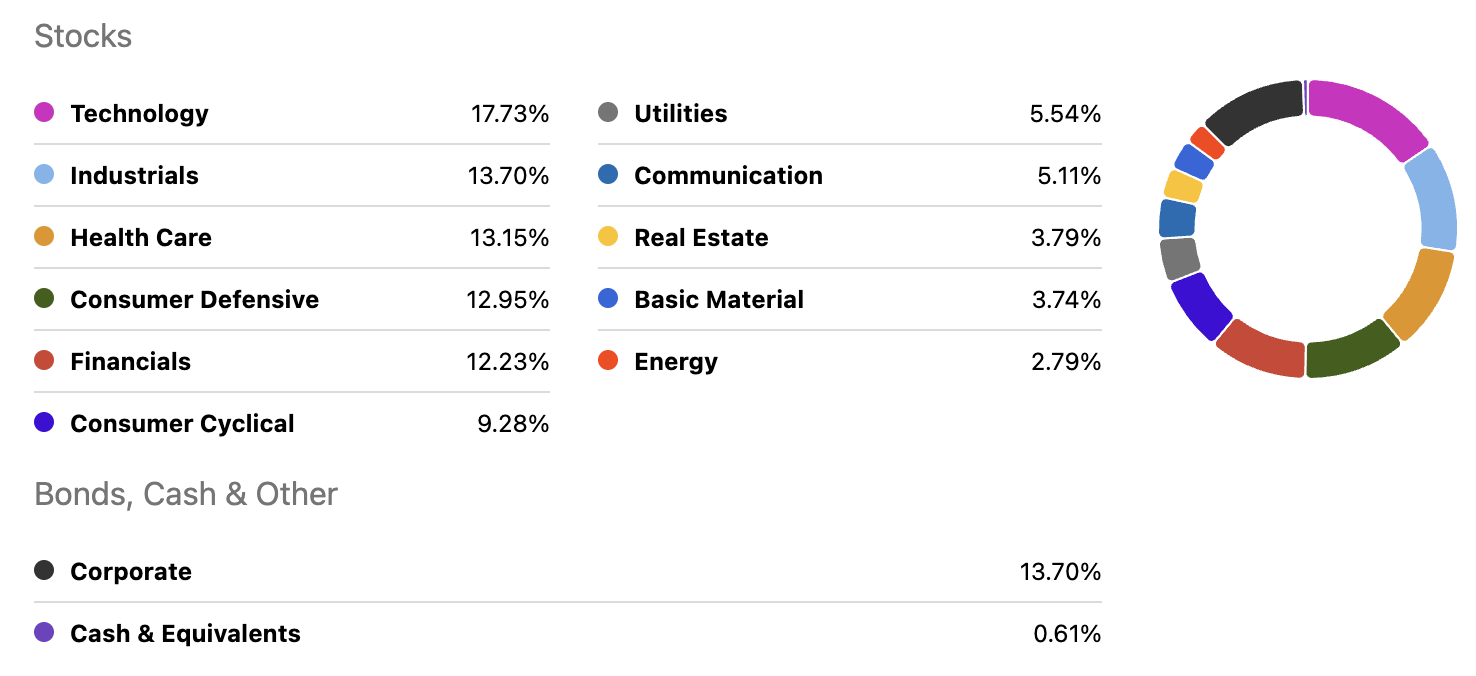
Looking at this chart, you can see the sector breakdown of the entire portfolio.
Technology has the highest exposure at 17.7%, which is a great place to be of late, as that sector has been the clear leader through the first half of 2023. The top five industries account for nearly 70% of the fund.
Buying and selling stocks is only one piece of the puzzle when it comes to JEPI. In addition, the funds strategy is focused on selling out of the money S&P 500 call options to generate higher amounts of income, which is where about 90% of the funds high distribution yield comes from. So if income is what you are looking for in the near term, JEPI could be a great investment, but you do have to be aware of the downside.
As we now know, the ETF does hold actual positions which is good, but when you sell out of the money call options, you cap your upside, so when the market is moving higher, like it has been all year, those options have a strike price and anything above and beyond that strike price you do not get to take part in. So although this option strategy can provide income, it also caps upside, which is why you see the lack of performance from JEPI over the past year.
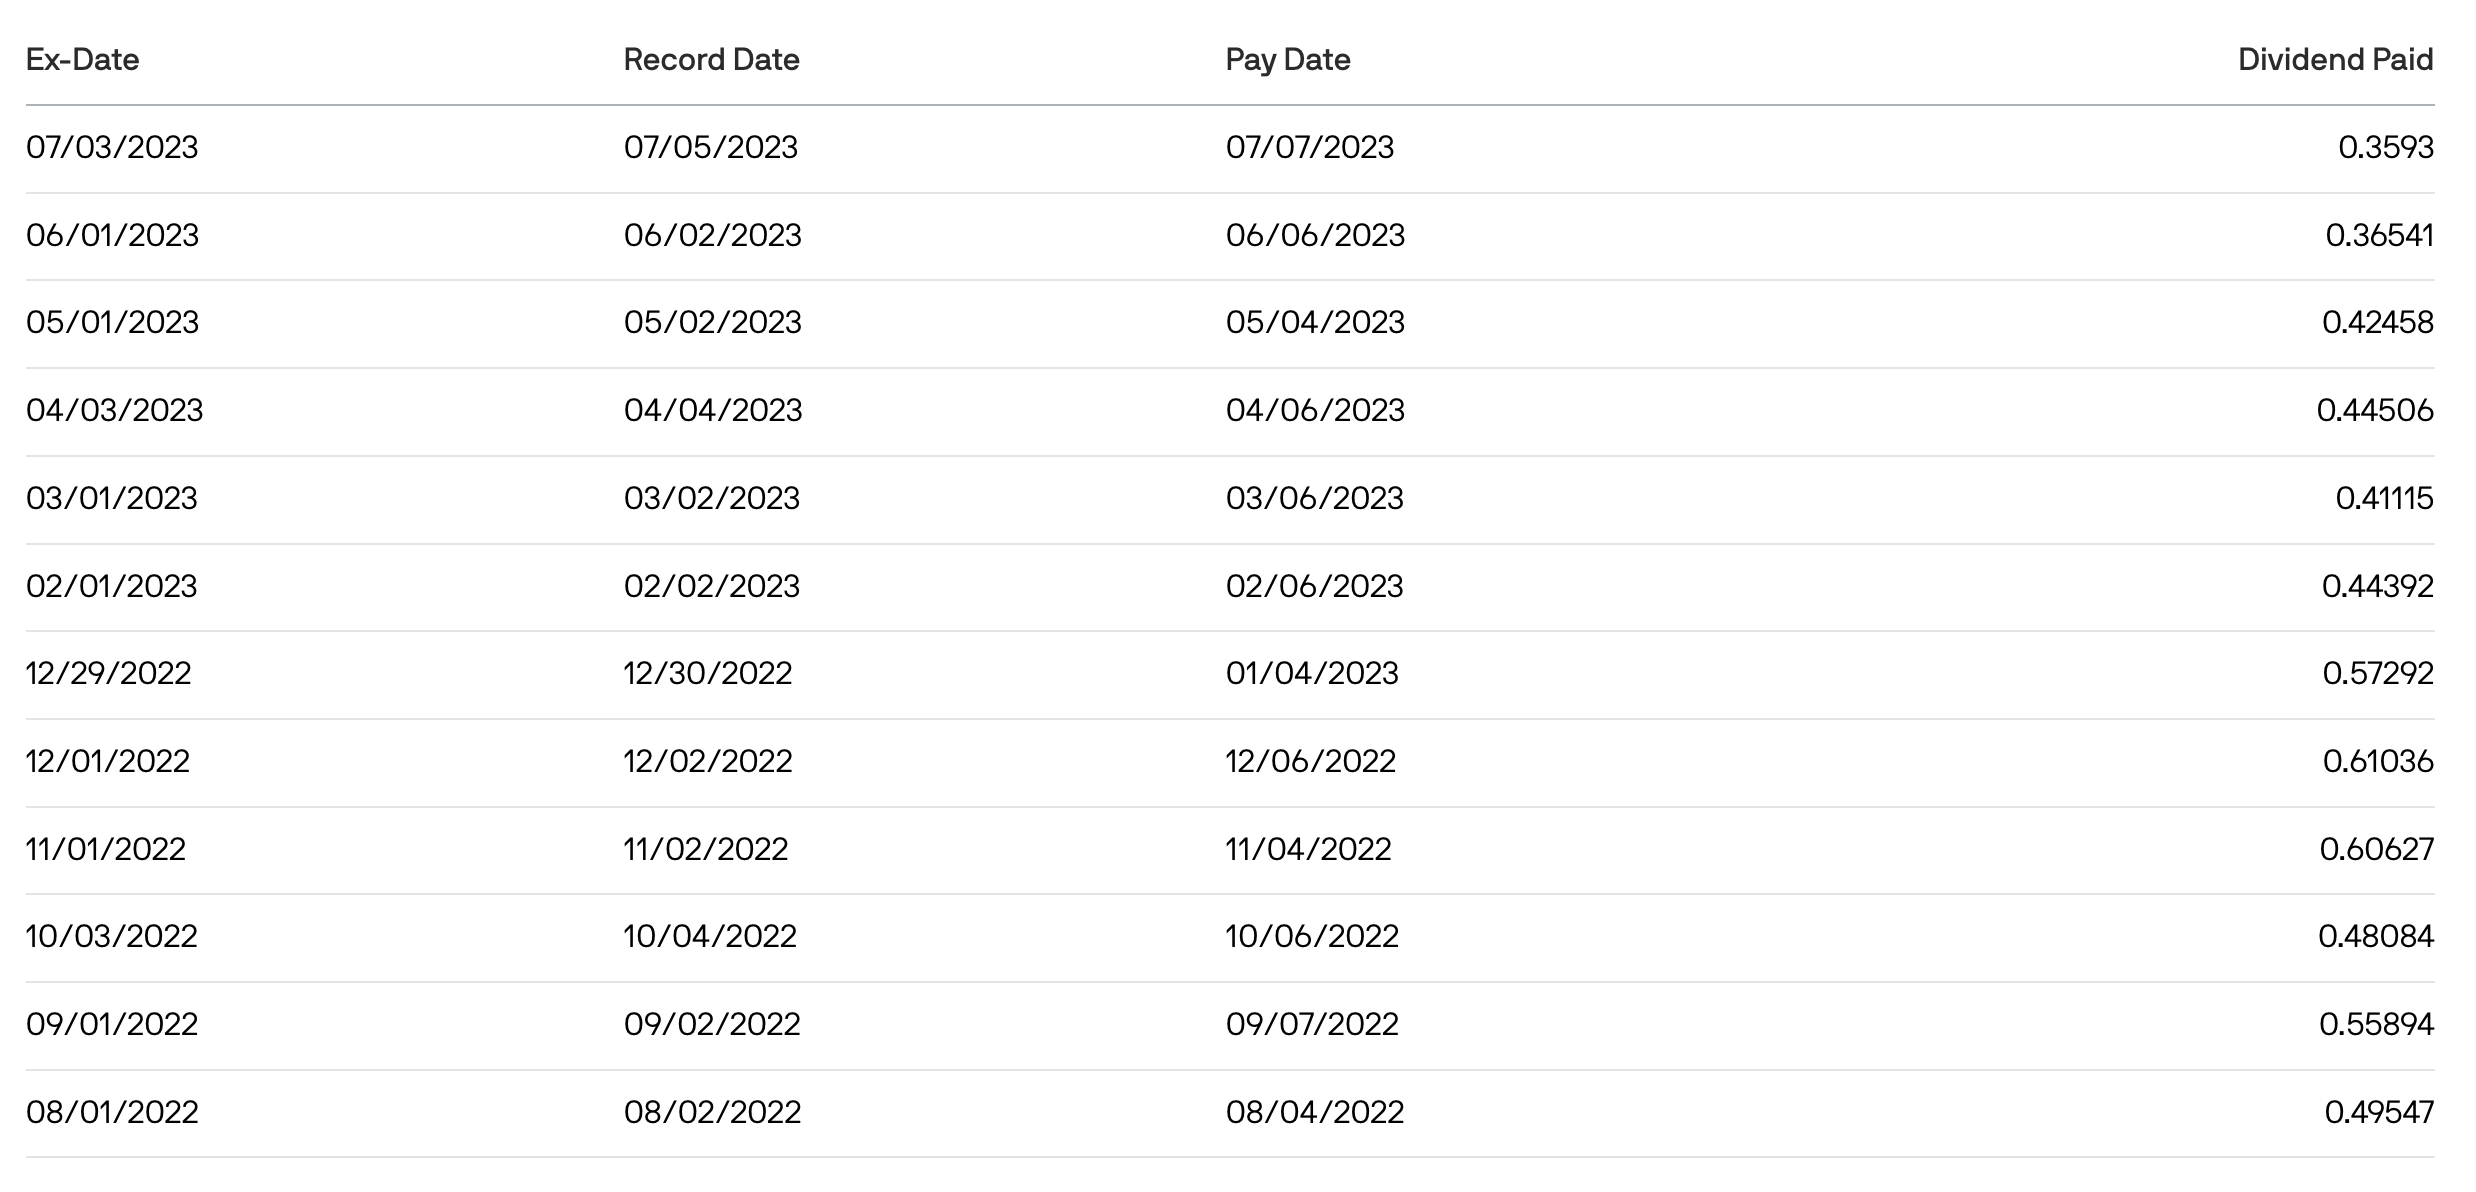
Looking at the high distribution, which the fund pays out on a monthly basis, and looking at this schedule below of prior payments, you can see that the amount per share varies, as much is based on the performance of the funds strategy around selling options.
Over the past 12 months, JEPI has paid a dividend of $5.77 per share which equates to a trailing yield of 10.4%, which is a very high yield. However, as we saw when we looked at performance, the actual share price of the ETF has not done much of anything.
So, with JEPI you get a nice yield, paid monthly, but a capped upside with little capital appreciation.
Schwab US Dividend Equity ETF (SCHD)
Now let's compare that ETF to another popular ETF which is SCHD or the Schwab US Dividend Equity ETF. SCHD is more of your traditional ETF, just owning stocks and passing along their dividends, with no derivatives being involved.
Back in May, I covered SCHD in an article titled, " SCHD: Put The Power of Compounding Into Overdrive. " Since then, SCHD has climbed 8%, but still sits well below the S&P 500, for reasons I will explain below, and I am still bullish on the ETF long-term due to its diversified portfolio and strong dividend growth.
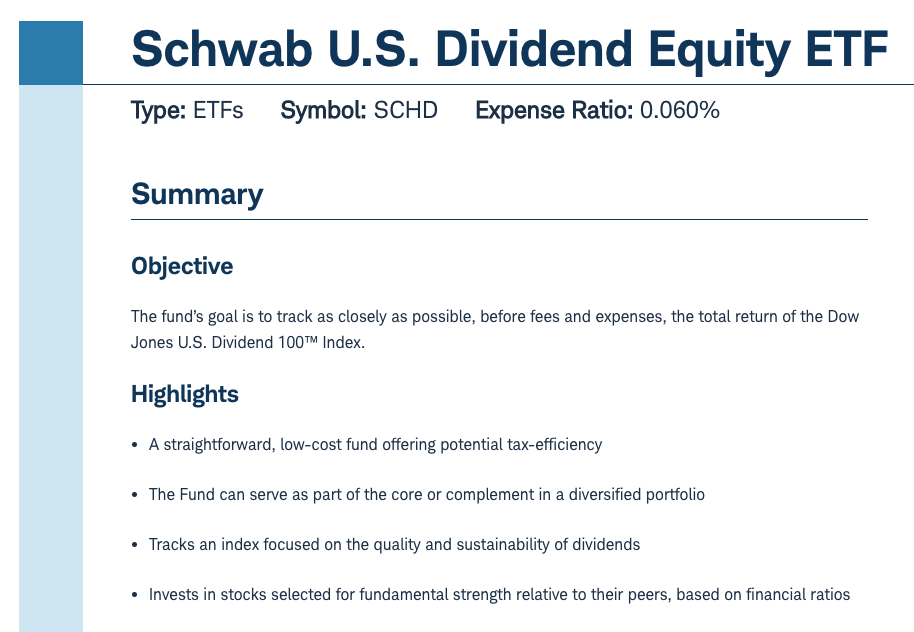
Looking here you can see the fund's objective is to track closely the return of the Dow Jones US Dividend 100 Index. In addition, the fund focuses on companies that pay safe and reliable dividends, focusing on fundamentals.
SCHD is a low-cost ETF with an expense ratio of just 0.06%, meaning for every $10,000 you have in value, you would pay a fee of just $6 per year.
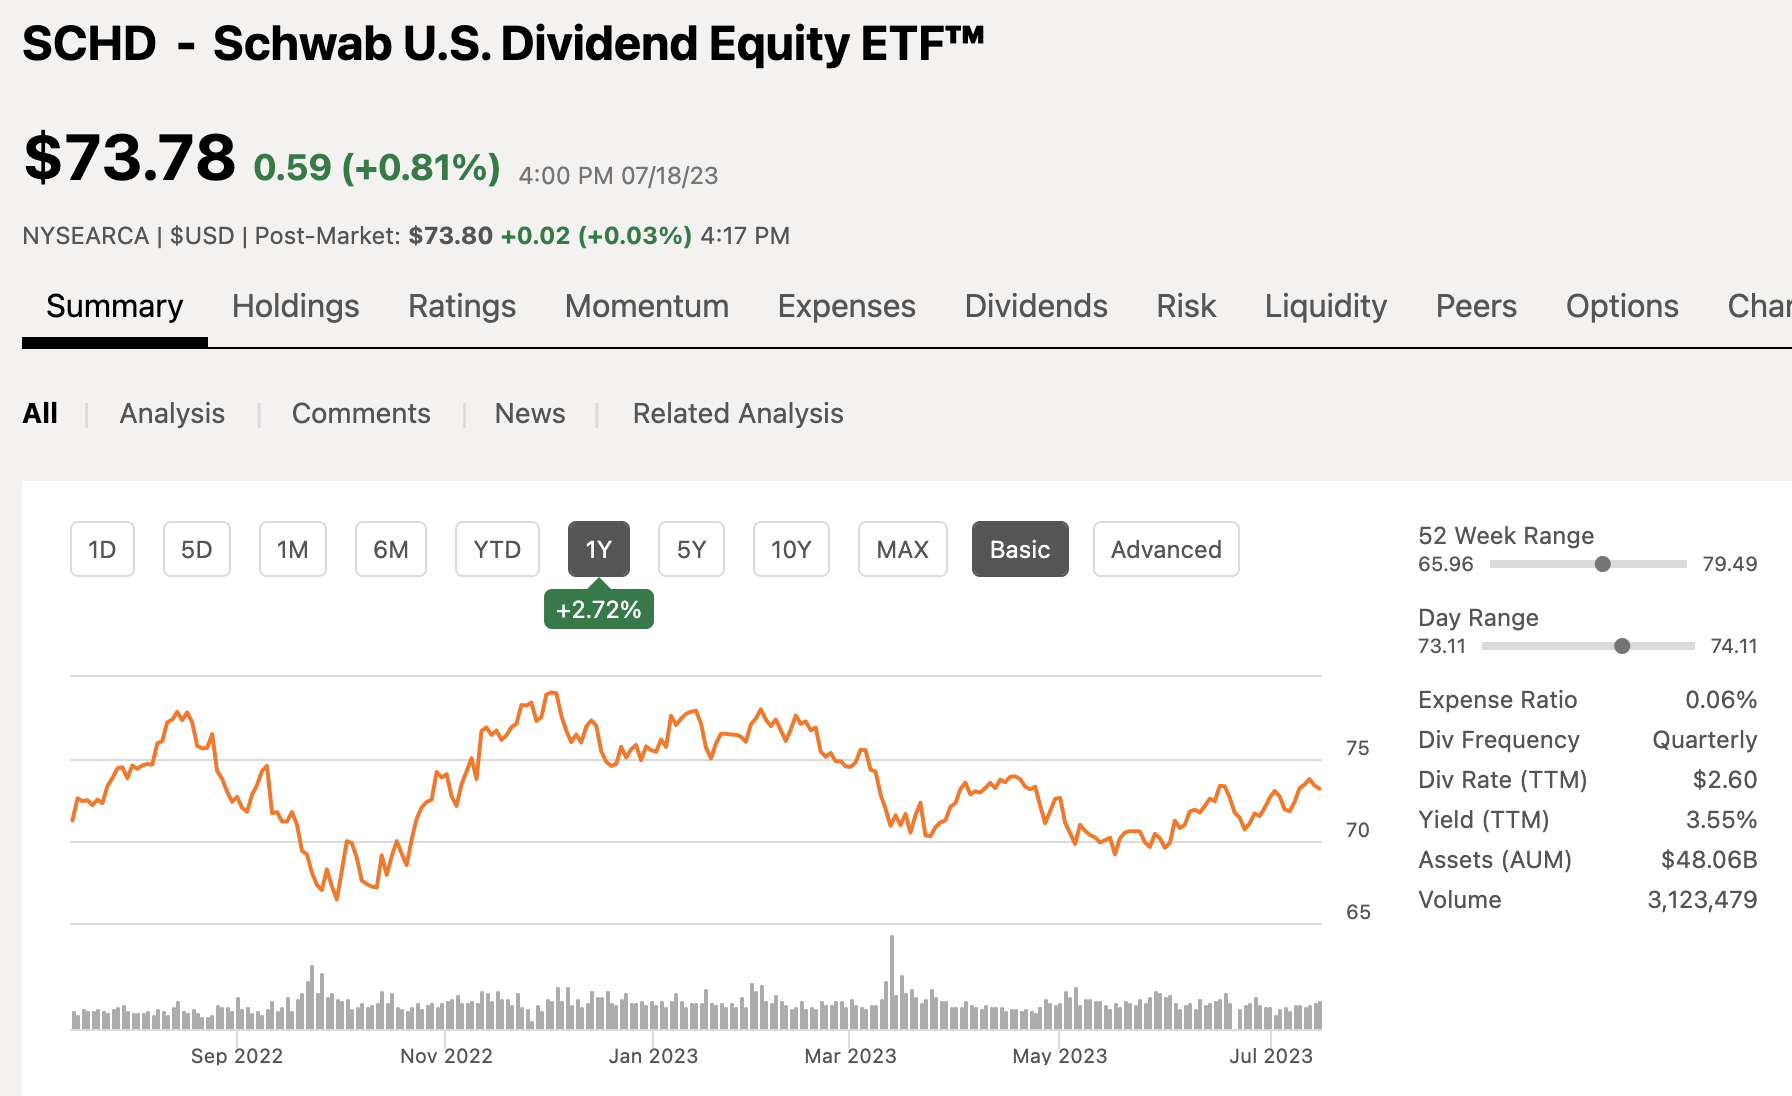
In terms of performance, and one reason I wanted to compare these two popular ETFs is the fact that they have performed the same over the past 12 months, with SCHD also badly underperforming the stock market. YTD, SCHD is down 3%.
So, what is the reasoning behind the underperformance for SCHD?
2023, for the most part, has been a resurgence from big technology corporations, as you can see from the tech heavy Nasdaq index climbing more than 45% in 2023 alone. As such, if you are a broad ETF with Technology not being your top sector, you are most likely going to be underperforming, which is exactly the case for SCHD.
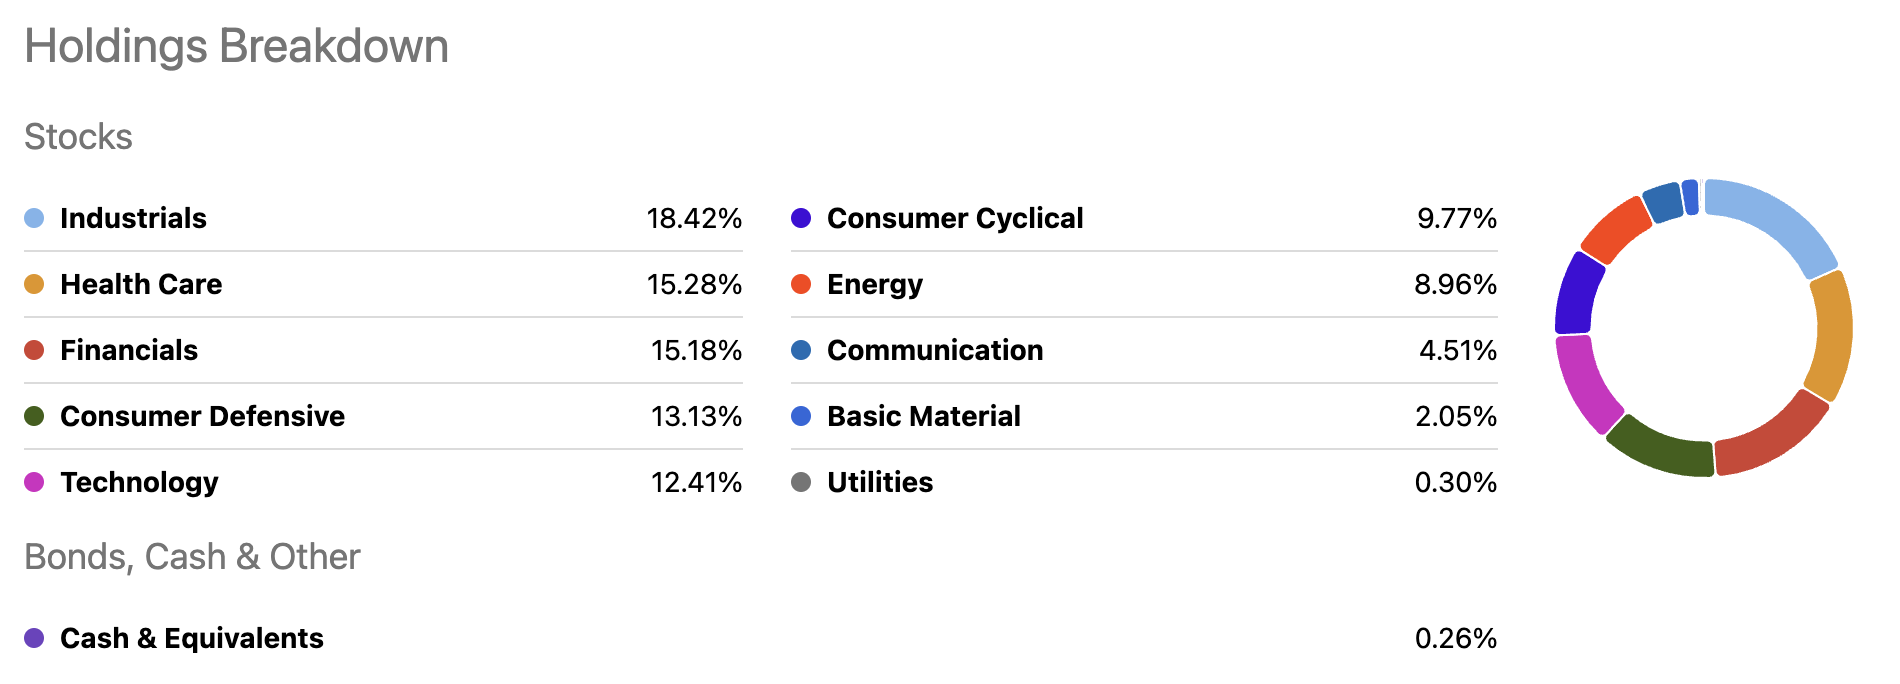
Looking at the sector breakdown below, you can see that Technology is only the 5th largest sector within SCHD, accounting for only 12.4% exposure.
Industrials and Health Care are in fact the top two sectors, accounting for 18% and 15%, respectively. The industrial sector is up 10% on the year, meanwhile, health care is down 4% YTD. Financials and Consumer Defensive, which are the next two largest sectors are essentially flat on the year, so you can see why SCHD is down right now.
The fund is well-balanced, but when things are skewed towards one particular sector, you can see how the fund can underperform. However, from an investing standpoint, diversification provides safety and stability.
Now let's take a look at the top 10 holdings within the fund:
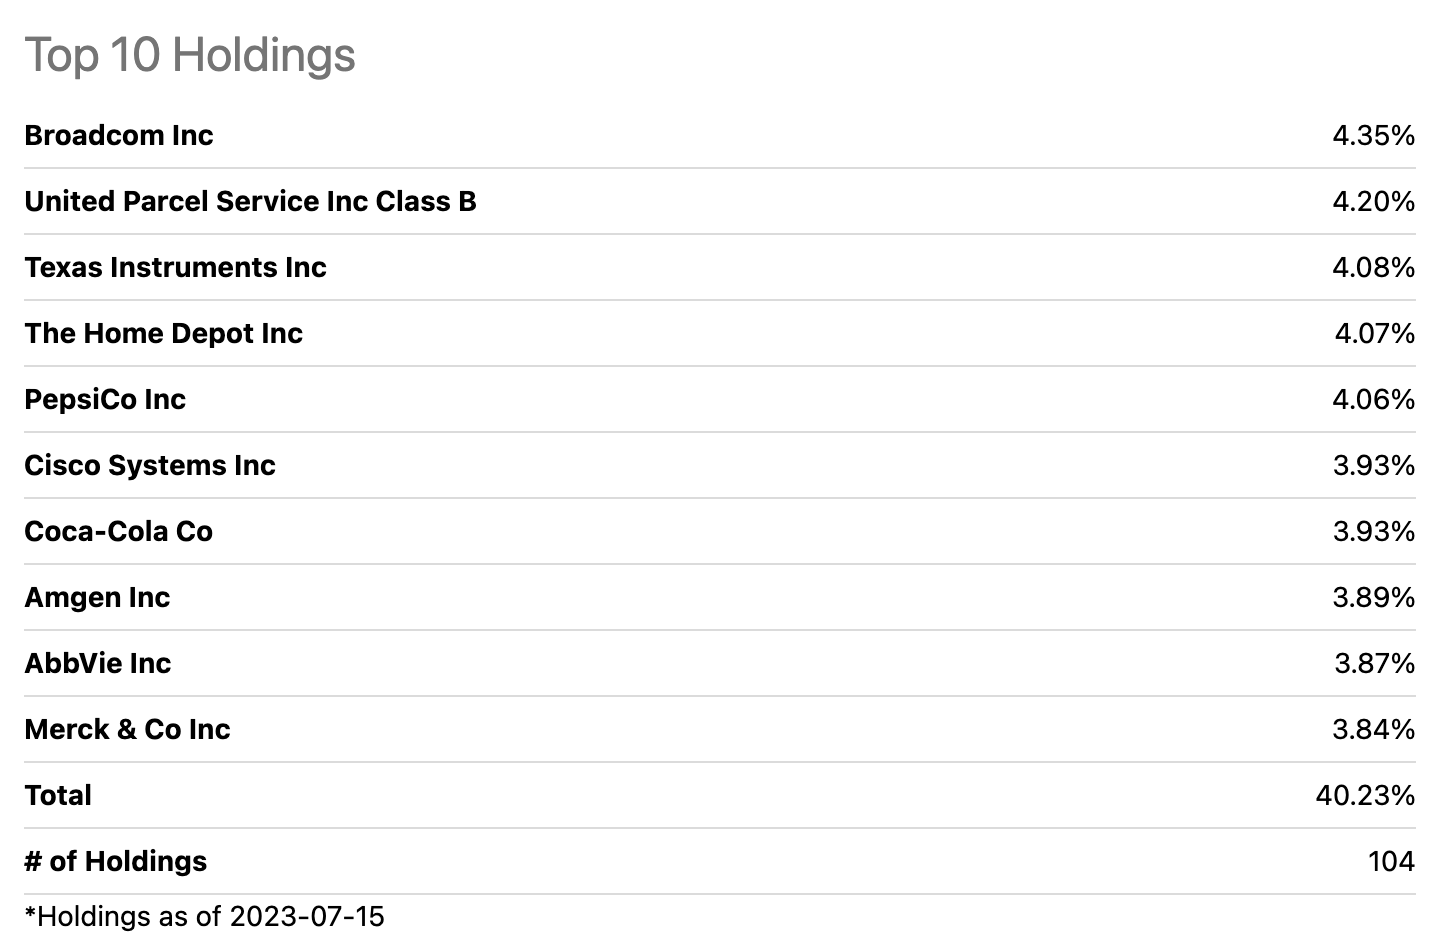
The fund has a total of 104 positions and these top 10 positions account for 40% of the entire fund.
Unlike JEPI, which trades in and out of positions regularly, since they are an actively managed fund, SCHD is passively managed and they rebalance their holdings quarterly, hence the lower expense fee.
Now for dividends. Unlike JEPI, which has a high yield distribution, primarily from options trading, SCHD has more of your typical ETF yield. SCHD currently yields a dividend of 3.6%, which is pretty solid, but in addition to that, they have nearly 14% dividend growth on an annual basis over the past 5 years. SCHD shareholders have also enjoyed growing dividends for 11 consecutive years and counting.
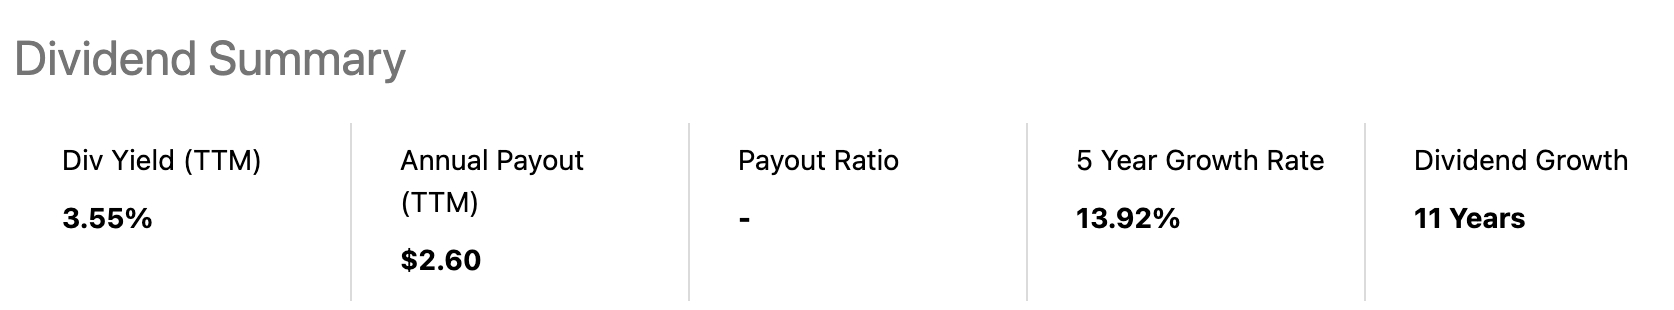
So although you get a lower yield, you get solid dividend growth and more potential for capital appreciation from the shares.
Investor Takeaway
SCHD and JEPI, two popular ETFs with two completely different underlying strategies. If you are an investor looking for higher yield as your higher priority, JEPI may be the better choice for you, but make sure you understand how the ETF works, the higher expense fee, and how the distribution will fluctuate.
If total return is your main focus, with share price growth, nice dividend yield, and dividend growth is your focus, well then SCHD is easily the better route for you moving forward. However, when an ETF is well diversified, like SCHD, a one-sided rally will result in underperformance like we are seeing right now. However, over the long term, things will even out.
COMMENT BELOW: Which ETF do you prefer moving forward?
Disclosure: This article is intended to provide information to interested parties. I have no knowledge of your individual goals as an investor, and I ask that you complete your own due diligence before purchasing any stocks mentioned or recommended.
For further details see:
Which Is The Better Buy: SCHD Or JEPI?