REG - Who's Buying BBB+ Rated REITs
2024-01-11 07:00:00 ET
Summary
- Blue-chip REITs are high-quality companies with stable earnings and dividends but they often trade at higher valuations.
- BBB+ rated REITs offer a balance of safety and potential for growth, with lower entry prices and room for upside.
- In this article, I'll discuss BBB+ rated REITs worth considering.
One of my final 2023 articles was “Who’s Buying These ‘Fortress’ A-Rated REITs?”
In it, I described blue-chip real estate investment trusts, or REITs, as being:
“… the crème de la crème, the very best-quality companies that you can own. They’re great stocks to own in almost any market cycle because they most always have access to equity and debt.
“And they typically generate stable earnings and dividends. The most common attributes for a blue-chip are its balance sheet and conservative dividend policy.
“Specifically, blue-chip companies [almost] always have modest debt ratios with low-risk credit ratings.”
That’s why I also call them sleep well at night stocks or SWANs. And why they’re able to demonstrate “consistent growth in adjusted funds from operations [AFFO] and dividends, making them attractive investments.”
It’s always great to own such top-notch investments. But they do have two distinct downsides.
One is that their dependability tends to translate to higher stock prices. This can mean their fair valuations are simply higher, meaning you need more dollars to buy a single share. And it very, very often means they trade at those fair valuations or higher – instead of the discounts we like to look for.
There’s also the issue that they don’t often provide immediate boosts of profit. They do provide profits. Safe, significant ones too.
But they take more time to accrue. So if you’re looking for a faster turnaround, you usually need to increase your risk and look lower on the alphabet.
The Beauty of Triple B+
Now, as my regular readers know, I don’t advise adding too much risk to your investing inventory – neither in overall theory nor stock-to-stock practice. But there’s no way to avoid risk all around.
There’s simply no investment that can provide 100% rewards 100% of the time. So there is a proper balance to strike, and that exact balance is going to look different for every individual investor. However…
BBB+ rated REITs are rarely a bad place to turn.
To understand how, let’s first look at the S&P rating structure, where AAA is the absolute best designation. The worst of the worst, meanwhile, is D.
If a company is slapped with that latter assessment, it means it’s about two steps away from crashing and burning.
That’s too much risk, for the record. Though I’m sure you already recognize that. It’s obvious.
S&P Global Rating’s whole structure is very easy to use, in fact, sliding down like this:
- AAA
- AA
- A
- BBB
- BB
- B
- CCC
- CC
- C
- D.
The first four ratings are labeled as “investment grade” while the latter six are “speculative grade.” Which means that BBB is the lowest you can go in the investment grade category.
This means you’ve still got substantial reward in terms of safety. These companies are far from falling apart.
Yet they tend to trade at lower entry prices, leaving more room to run on the upside.
A Little More Risk With a Little More Than a Little Reward
Now, admittedly, there are plenty of excellent prices to capitalize on across the real estate investment trust realm. So the price appreciation aspect isn’t as strong a reason to act on as it otherwise could be.
At the same time, the stocks I’m about to delve into represent quality companies. Sure, they each have room for improvement according to S&P.
(And S&P is very good at what it does, analyzing each investment intensely to reach its conclusions.)
So you’re not going to find something quite as impressive as, say, AvalonBay Communities ( AVB ). That REIT made my A-rated REIT list a week or two ago, warranting this glowing review:
“AvalonBay is a multifamily REIT with a market cap of approximately $27 billion and has a portfolio consisting of 296 multifamily communities containing approximately 89,200 apartment homes across… leading metro areas of New York, New England, New Jersey, the Mid-Atlantic, California, and the Pacific Northwest.
“Additionally, the company is increasing its national footprint with expansion regions located in North Carolina, Southeast Florida, Texas, and Colorado…
“AvalonBay has an A- credit rating and strong credit metrics including a net debt to core EBITDAre [earnings before interest, taxes, depreciation, and amortization for real estate] of 4.1x, a long-term debt to capital ratio of 39.40%, and a debt service coverage ratio of 7.3x.
“Additionally, AVB’s debt has an average interest rate of 3.4% and a weighted average term to maturity of 7.5 years.”
Or like Realty Income ( O ), Equity Residential ( EQR ), Simon Property Group ( SPG ), Mid-America Apartment Communities ( MAA ), Camden Property ( CPT ) – all of which are A- rated – or Prologis ( PLD ) or Public Storage ( PSA ), which are even higher on the scale at unadulterated A’s,
With that said, I still think you might like what you see.
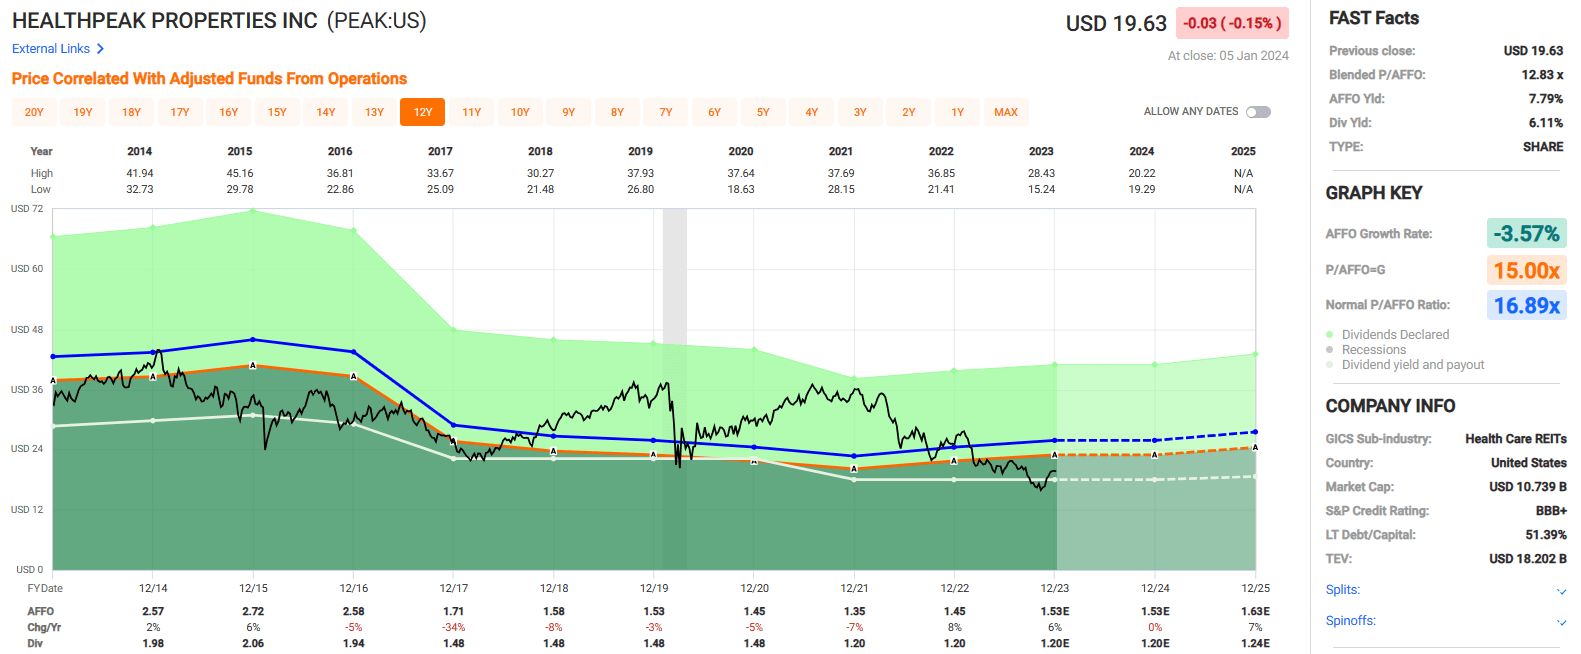
Healthpeak Properties, Inc. ( PEAK )
This BBB+ rated REIT has a market cap of almost $11.0 billion and a portfolio of healthcare real estate with a particular focus on lab campuses, outpatient medical centers, and continuing care retirement communities (“CCRC”).
In late October, PEAK announced that it had agreed to an all-stock merger with Physicians Realty Trust (DOC), which is expected to close in the first half of 2024.
The combined company’s portfolio will cover approximately 52 million SF across high-growth markets including Houston, Dallas, Phoenix, Nashville, and Denver. It will increase PEAK’s enterprise value from approximately $16 billion to an expected $21 billion.
Additionally, PEAK’s property count will grow from 475 to 753, their outpatient medical square footage will increase from 24 million SF to 40 million SF, and their annualized base rent (“ABR”) will increase from $1.3 billion to $1.7 billion.
Upon the completion of the merger, PEAK’s balance sheet is expected to remain in good shape, with a net debt to adjusted EBITDAre in the low 5x range, a weighted average interest rate of 3.8%, and a weighted average term to maturity of approximately 5.3 years.
Since 2014, PEAK has had average adjusted funds from operations (“AFFO”) growth rate of negative -3.57 and a compound dividend growth rate of negative -4.55%. Healthpeak’s AFFO per share fell each year between 2016 to 2021, but then increased by 8% in 2022, and is expected to increase by 6% in 2023.
The stock pays a 6.11% dividend yield that is well covered with an AFFO payout ratio of 78.43% and trades at a P/AFFO of 12.83x, compared to its average AFFO multiple of 16.89x.
We rate Healthpeak Properties a Strong Buy.
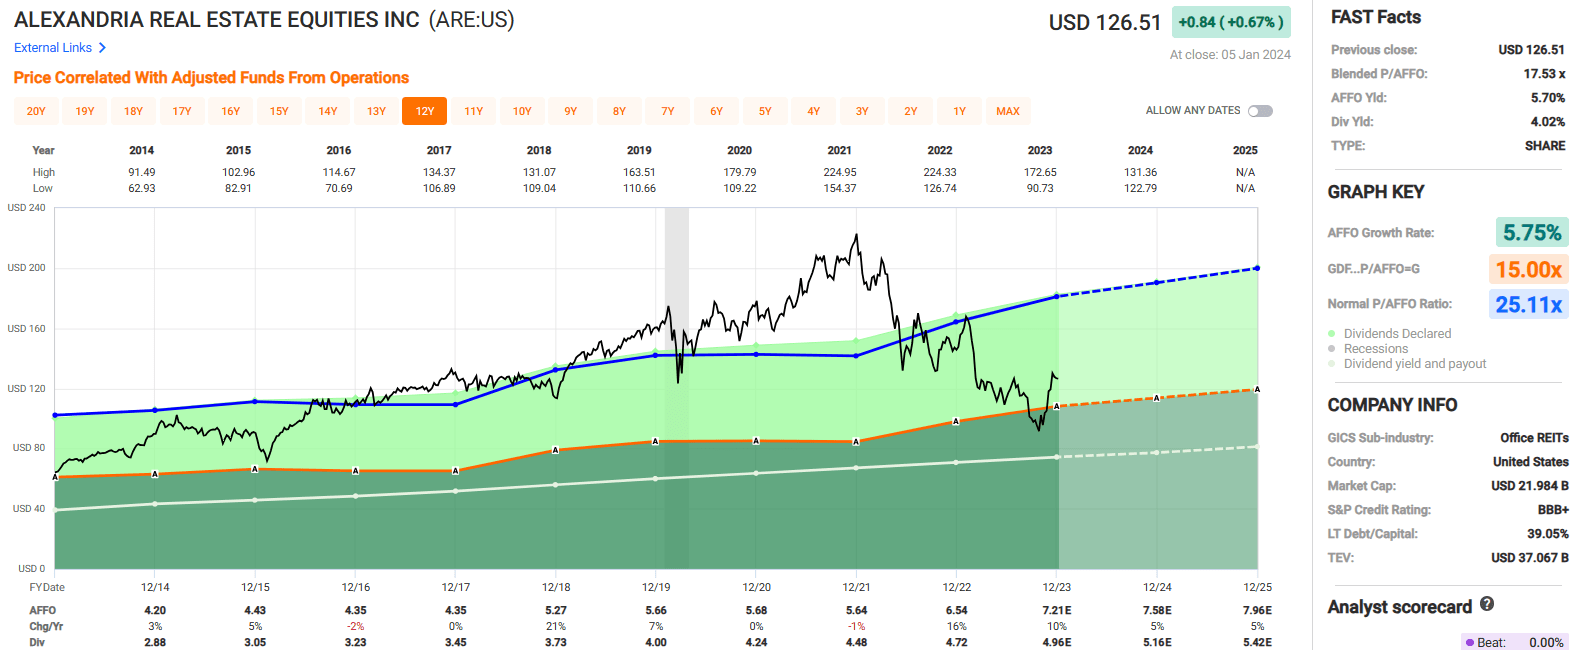
Alexandria Real Estate Equities, Inc. ( ARE )
This BBB+ rated REIT has a market cap of approximately $22.4 billion and a 75.1 million SF portfolio that consists of life science real estate primarily located in AAA cluster locations in Boston, San Francisco, New York City, Maryland, Seattle, San Diego, and the Research Triangle. ARE’s asset base of 75.1 million SF consists of:
- Operating properties: 41.5 million SF.
- Class A/A+ properties under construction: 5.6 million SF
- Near-to-intermediate development projects: 8.9 million SF
- Future development projects: 19.1 million SF.
ARE’s lab space is leased more than 800 tenants including leading pharmaceutical and biotech firms such as Bristol-Myers (BMY) and Moderna (MRNA). ARE is well diversified by tenant, with its top 20 tenants making up 32.4% of its revenue, and 91% of their top 20 tenants are either investment-grade rated or large-cap publicly traded companies.
ARE has a fortress-like balance sheet , with a net debt + preferred to adjusted EBITDA of 5.4x, a long-term debt to capital ratio of 39.05%, and a fixed charge coverage ratio of 4.8x. Additionally, their debt is 99% fixed rate with a W.A. interest rate of 3.77% and a W.A. term to maturity of 13.1 years.
Since 2014, ARE has had an average AFFO growth rate of 5.75% and an average dividend growth rate of 6.81%. Analysts expect AFFO per share to increase by 10% for the full year 2023 and then increase by 5% in both 2024 and 2025.
ARE pays a 4.02% dividend yield that is well covered with a 2023 expected AFFO payout ratio of 68.79%. The stock trades at a P/AFFO of 17.53x, compared to its average AFFO multiple of 25.11x.
We rate Alexandria Real Estate a Buy.
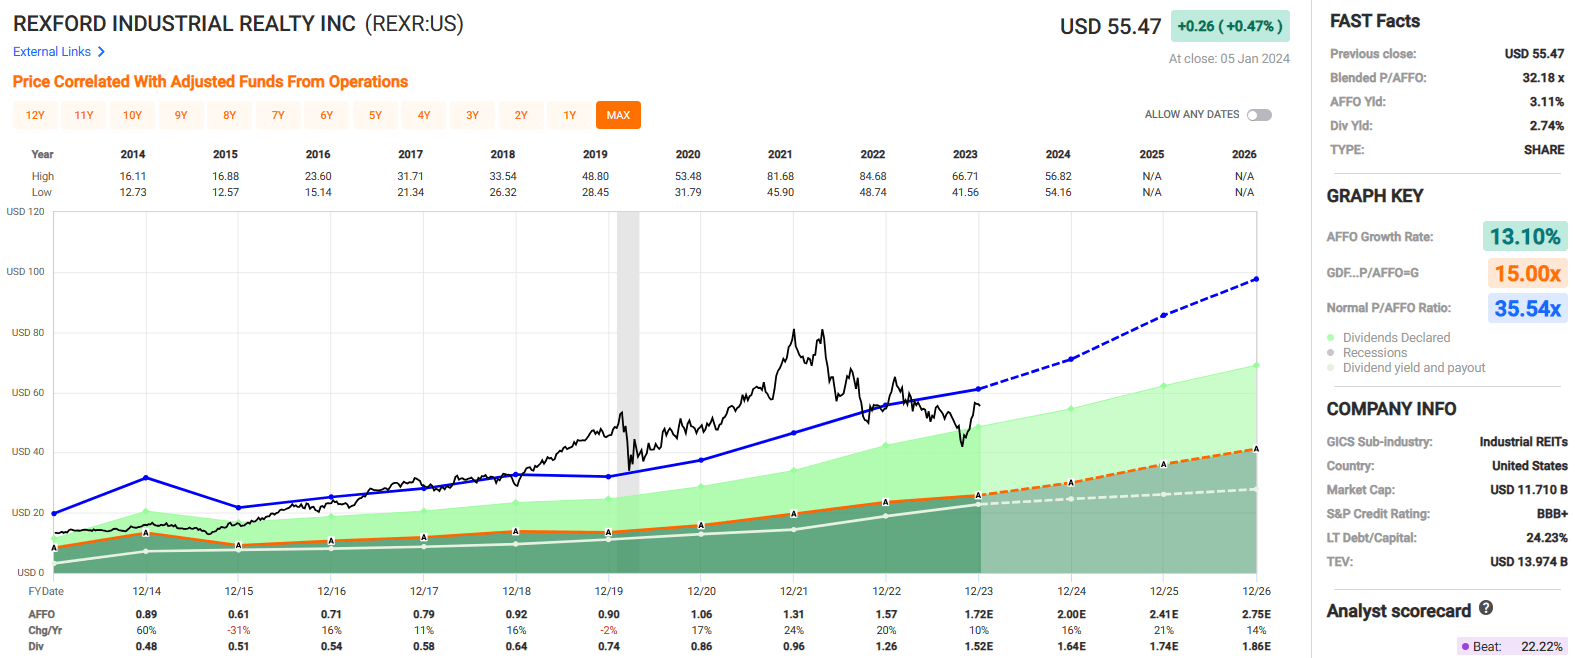
Rexford Industrial Realty, Inc. ( REXR )
This BBB+ rated REIT has a market cap of almost $12.0 billion and a 45.8 million SF portfolio comprised of 373 industrial properties located exclusively throughout infill Southern California (“SoCal”).
REXR is fully concentrated in SoCal by design. It is the largest major industrial market in the United States and the fourth largest in the world.
REXR has carved out its territory in SoCal over the years and considers its portfolio irreplaceable due to the high demand for industrial space, with approximately 22 million residents and more than 600,000 businesses located in the region.
While the SoCal region has enormous demand, there is also a scarcity of developable land due to natural barriers surrounding the region and restrictive zoning regulations in the state.
Rexford has earned its BBB+ credit rating with excellent debt metrics and a strong balance sheet . As of their most recent update, REXR had a net debt to Adjusted EBITDA of 3.7x, a long-term debt to capital ratio of 24.23%, and an EBITDA to interest expense ratio of 7.92x. Plus their debt is 100% fixed rate with a W.A. interest rate of 3.6% and a W.A. term to maturity of 4.8 years.
Since 2014, REXR has delivered an average AFFO growth rate of 13.10% and an average dividend growth rate of 13.08% over the last 8 years. There are high earnings expectations over the next several years, with analysts projecting AFFO per share to increase by 10% in 2023, and then increase by 16% and 21% in the years 2024 and 2025, respectively.
REXR pays a 2.74% dividend yield that is well covered, with an expected 2023 AFFO payout ratio of 88.37%. The stock trades at a P/AFFO of 32.18x, compared to its average AFFO multiple of 35.54x.
We rate Rexford Industrial a Buy.
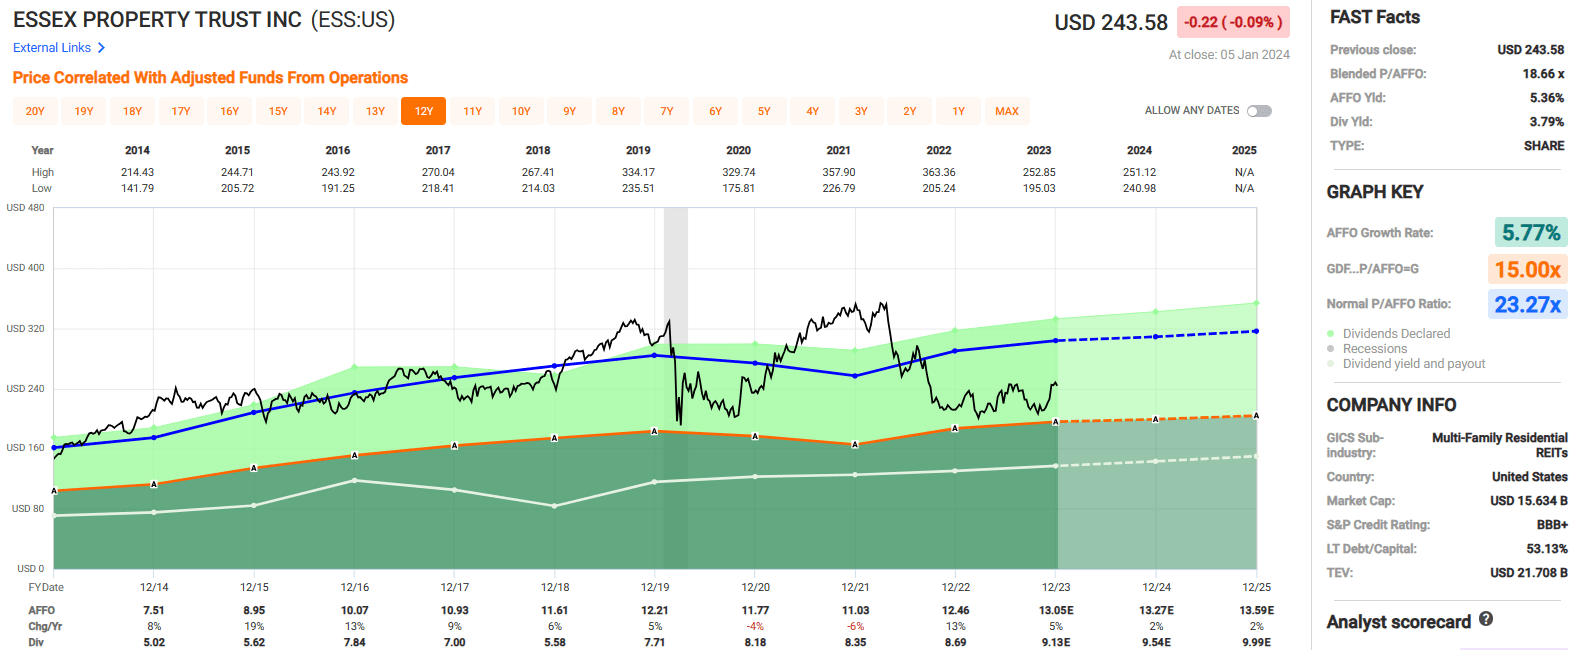
Essex Property Trust, Inc. ( ESS )
This BBB+ rated REIT has a market cap of almost $16.0 billion and a portfolio of multifamily communities exclusively located on the West Coast.
ESS specializes in the development, acquisition, and management of apartment communities in supply-constrained West Coast markets.
Their portfolio is comprised of 252 apartment buildings that contain roughly 62,000 apartment homes located across 8 major markets in Southern and Northern California as well as Seattle.
As a percentage of their portfolio’s net operating income (“NOI”), Southern California made up 42%, Northern California made up 41%, and Seattle made up 17%, while their largest sub-market is Santa Clara County in Northern California which made up approximately 20% of its portfolio’s NOI.
ESS was publicly listed in 1994 and since that time, the apartment REIT has created enormous value for its shareholders. It is an S&P 500 Dividend Aristocrat and has increased its dividend for 29 consecutive years, with 453% cumulative dividend growth since the company began trading in 1994.
In addition to its stellar dividend record, ESS has a strong balance sheet with a net debt to adjusted EBITDAre of 5.5x, a long-term debt to capital ratio of 53.13%, and interest coverage at 573%.
Since 2014, ESS has had an average AFFO growth rate of 5.77% and an average dividend growth rate of 8.44%. Analysts expect full-year AFFO per share growth of 5% in 2023, and then for AFFO per share to increase by 2% in both 2024 and 2025.
The stock pays a 3.79% dividend yield that is well covered with an AFFO payout ratio of 69.96%. It trades at a P/AFFO of 18.66x, compared to its average AFFO multiple of 23.27x.
We rate Essex Property Trust a Buy.
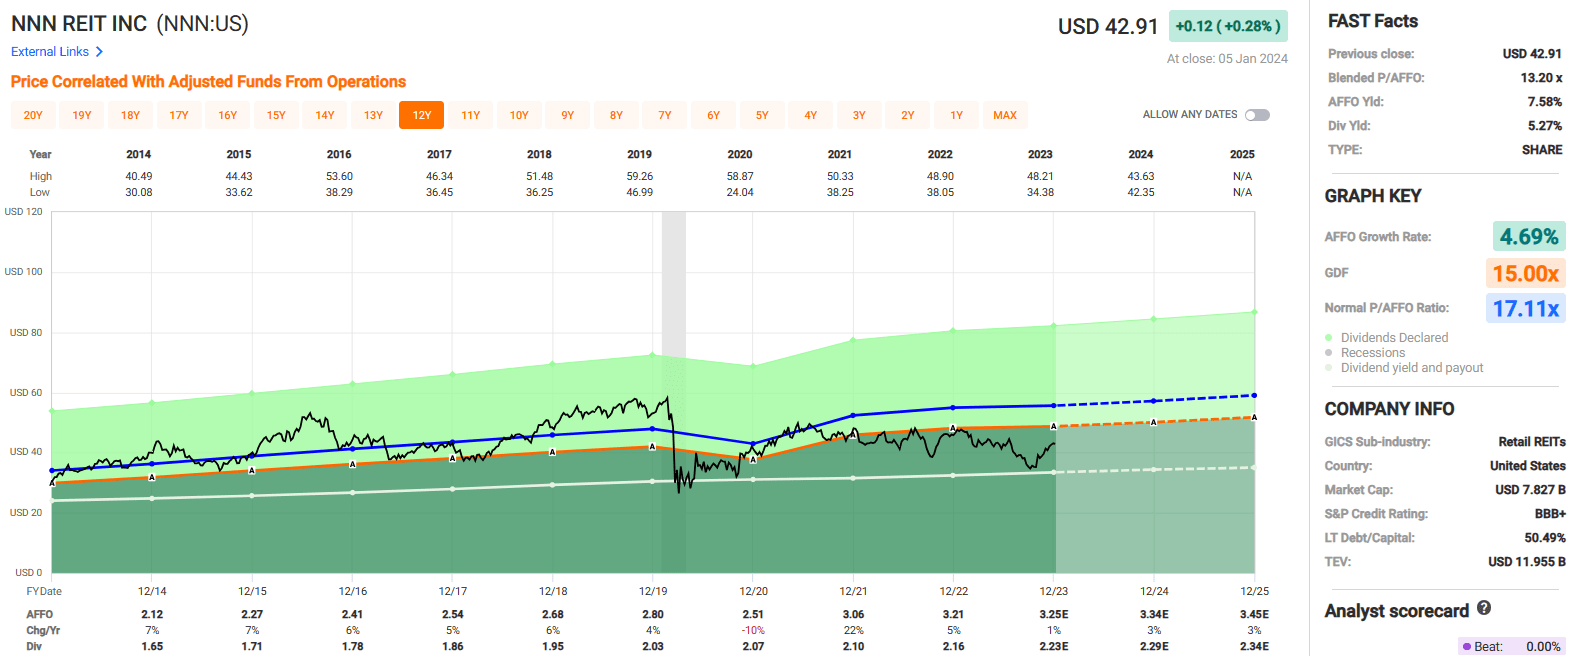
NNN REIT, Inc. ( NNN )
This BBB+ rated REIT has a market cap of almost $8.0 billion and a 35.8 million SF portfolio comprised of single-tenant, net-leased retail properties.
At the end of the third quarter, NNN owned 3,511 commercial properties across 49 states with an occupancy of 99.2% and a weighted average remaining lease term of approximately 10 years.
NNN leases its properties to more than 395 tenants operating in over 30 separate lines of trade. Their leases are structured on a long-term, triple-net basis and they target smaller properties, generally ranging between $2 to $4 million in investment size.
Their largest tenant is 7-Eleven, which leases 138 properties and makes up 4.5% of their ABR and their largest line of trade is convenience stores which make up 16.8% of their ABR, followed by automotive service and full-service restaurants which make up 14.7% and 8.8% respectively.
NNN has a healthy balance sheet with a net debt to EBITDA of 5.4x, a long-term debt to capital ratio of 50.49%, and a fixed charge coverage ratio of 4.6x.
Additionally, 100% of their assets are unencumbered with no secured debt, and their debt carries a W.A. interest rate of 3.9% with a W.A. term to maturity of 12.6 years.
NNN has paid consistent and rising dividends since 1990 and can boast a 34-year record of consecutive annual dividend increases.
Since 2014, NNN has had an average AFFO growth rate of 4.69% and an average dividend growth rate of 3.38%. Analysts expect AFFO per share growth of 1% in 2023, and then 3% in both 2024 and 2025.
NNN pays a 5.27% dividend yield that is well covered with an AFFO payout ratio of 68.62% and trades at a P/AFFO of 13.20%, compared to its average AFFO multiple of 17.11x.
We rate NNN REIT a Buy.
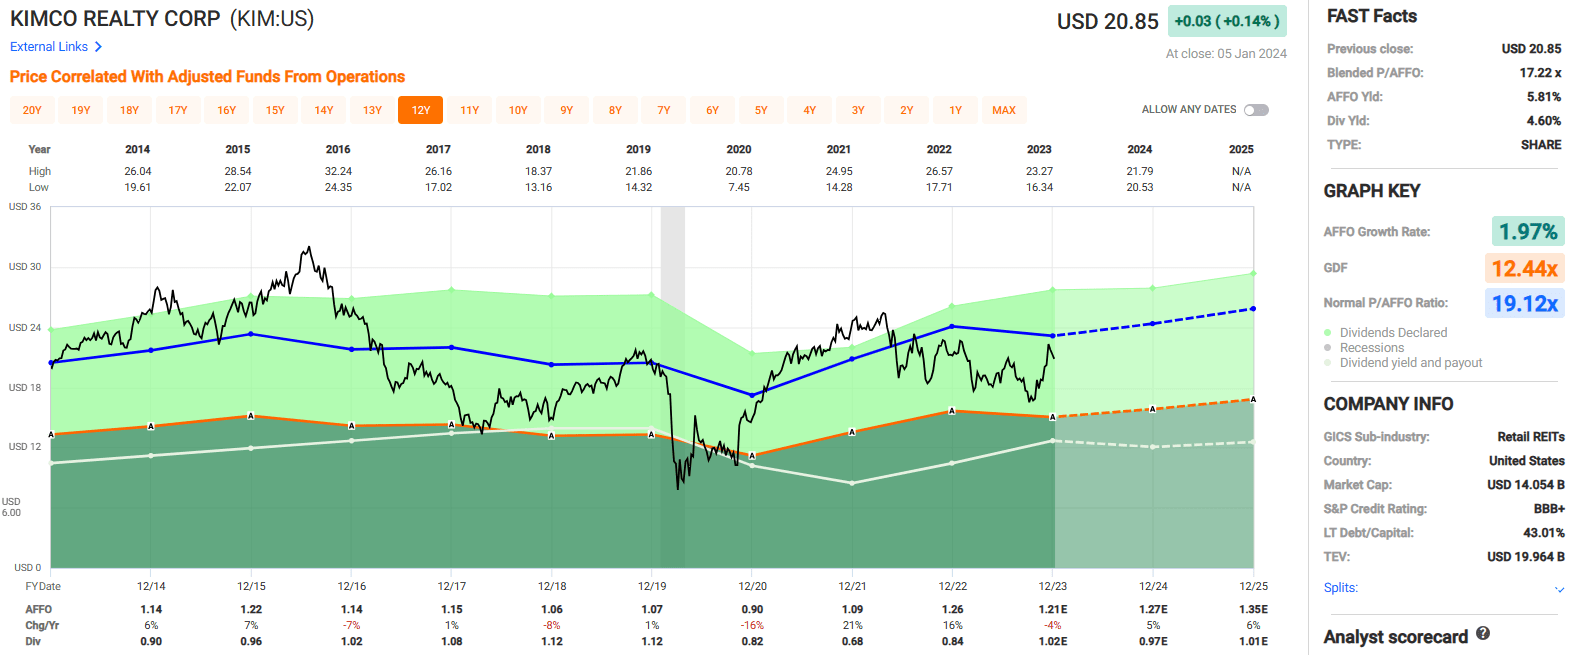
Kimco Realty Corporation ( KIM )
This BBB+ rated REIT has a market cap of approximately $14.0 billion and a 90 million SF portfolio containing 527 properties comprised primarily of shopping centers and a growing number of mixed-use assets across the U.S.
KIM invests in open-air, grocery-anchored shopping centers that are typically located in first-ring suburbs of major metros across high-growth Sunbelt markets and high-barrier-to-entry coastal markets.
KIM targets tenants operating in industries that provide necessity-based goods and services with many of its shopping centers anchored by off-price or grocery tenants.
At the end of the third quarter , 82% of KIM’s ABR was derived from grocery-anchored centers and the company reported a pro-rata occupancy of 95.5%.
On January 2, 2024, KIM closed its previously announced acquisition of RPT Realty. The acquisition will add 56 open-air shopping centers covering 13.3 million SF to KIM’s existing portfolio and is expected to be accretive to FFO per share through an expected $34 million in cost-saving synergies.
The acquisition is expected to be leverage neutral, which will help maintain the strength of KIM’s balance sheet .
At the end of the third quarter, Kimco reported a Look-through net debt to EBITDA of 5.9x, a fixed charge coverage ratio of 4.3x, a debt maturity profile of 8.8 years, and over $2.4 billion in immediate liquidity.
KIM is expected to release its fourth quarter earnings results on February 8, 2024, before the market opens.
Since 2014 Kimco Realty has had an average AFFO growth rate of 1.97% and a compound dividend growth rate of 1.96%. KIM had several years of consecutive dividend growth before it had to slash its dividend by -26.79% in 2020, and then by -17.07% the following year. However, since that time, KIM increased its dividend by 23.53% in 2022 and by 21.43% in 2023.
KIM pays a 4.60% dividend yield that is well covered with an AFFO payout ratio of 84.30% and trades at a P/AFFO of 17.22x, compared to its average AFFO multiple of 19.12x.
We rate Kimco Realty a Buy.
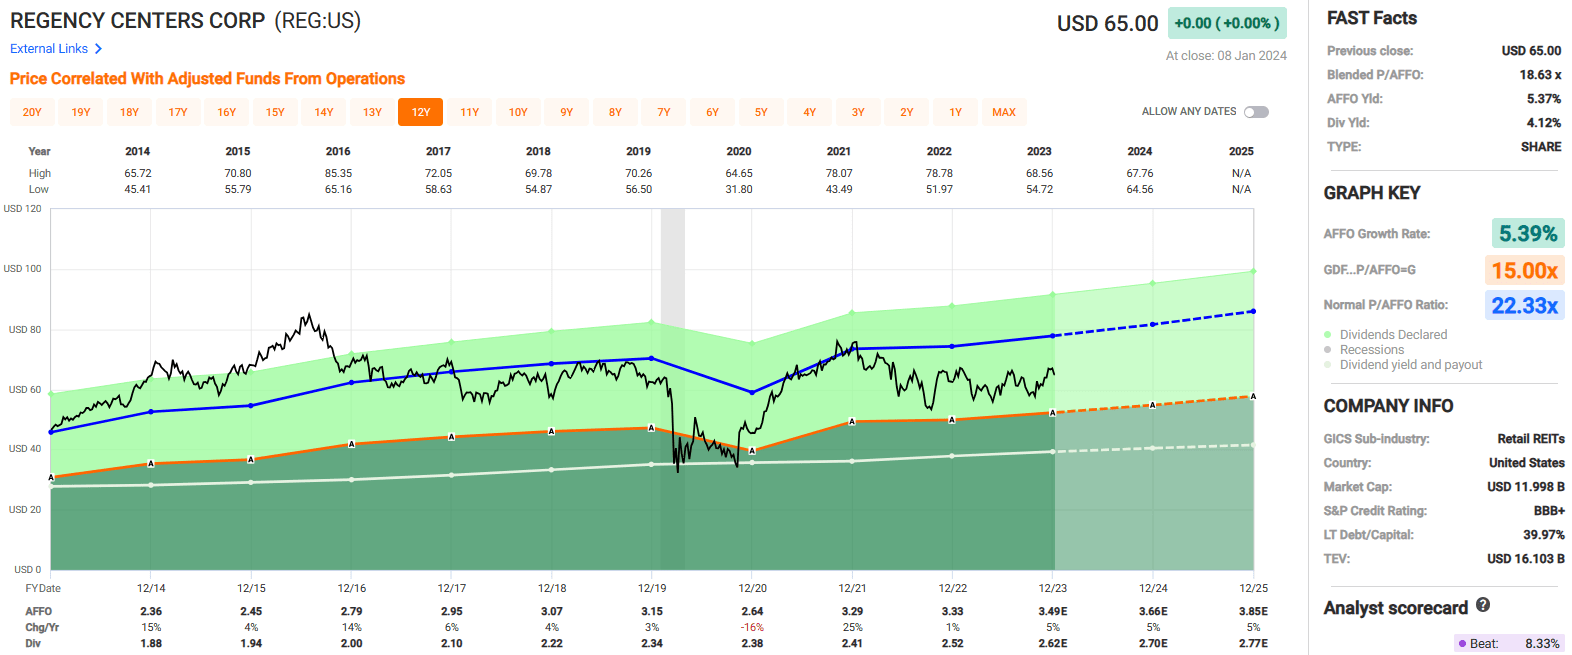
Regency Centers Corporation ( REG )
This BBB+ rated REIT has a market cap of approximately $12.0 billion and a 56.0 million SF portfolio with more than 480 shopping center properties that are leased to over 9,000 tenants.
REG specializes in the development and operation of shopping centers located in markets with attractive demographics such as a high 3-mile area population, an above average W.A. household income, and a median home value that exceeds the national average.
As of their most recent update, REG’s shopping centers had an average 3-mile area population of 124,000, a W.A. household income of $152,000, and a median home value of $585,000.
Over 80% of their shopping centers are grocery-anchored which is a key part of REG’s leasing strategy to target retailers that operate in industries that focus on essential goods and services, convenience, and value/discount retail.
At the end of the third quarter, REG reported that their Same Property portfolio was 95.4% leased.
REG has a strong balance sheet and solid debt metrics including a net debt plus preferred to EBITDAre of 5.0x, an EBITDA to interest expense ratio of 5.52x, and a long-term debt to capital ratio of 39.97%.
Additionally, REG’s debt has a W.A. interest rate of 3.9% with a W.A. term to maturity of 7.4 years.
Since 2014, Regency Centers has had an average AFFO growth rate of 5.39% and an average dividend growth rate of 3.55%. Analysts expect AFFO per share to increase by 5% in 2023, and then increase by 5% in both 2024 and 2025.
The stock pays a 4.12% dividend yield that is well covered with an AFFO payout ratio of 75.18%. It trades at a P/AFFO of 18.63x, compared to its average AFFO multiple of 22.33x.
We rate Regency Centers a Buy.
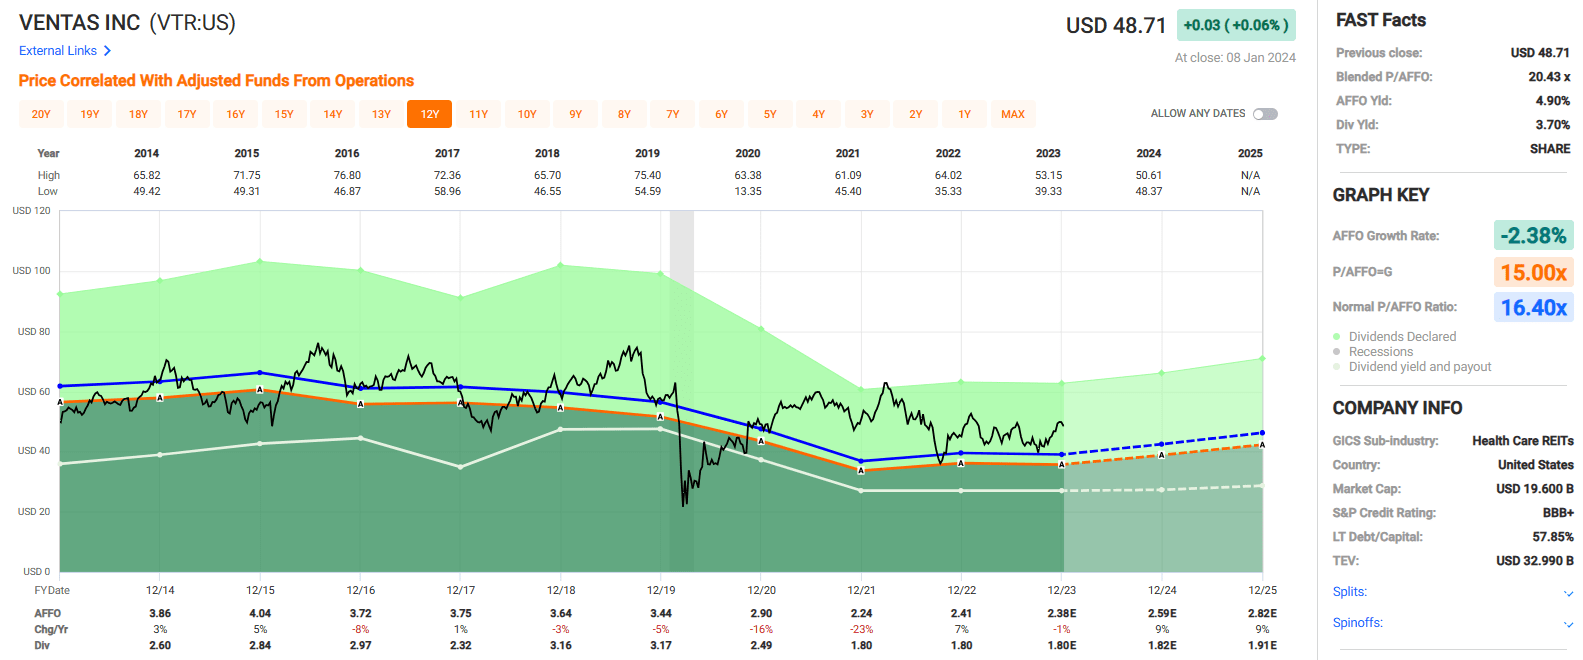
Ventas, Inc. ( VTR )
This BBB+ rated REIT has a market cap of approximately $19.6 billion and a portfolio of approximately 1,400 healthcare-related properties located in the U.S., Canada, and the United Kingdom.
Ventas owns or has an ownership interest in multiple healthcare property types including senior housing, outpatient medical, research centers, and hospitals.
VTR categorizes its assets into 3 portfolios: Senior Housing Operating Portfolio (“SHOP”), Outpatient Medical & Research Portfolio (“OM&R”), and a Triple-Net Portfolio.
At the end of the third quarter, VTR’s SHOP portfolio consisted of 587 properties which made up 37% of its 3Q23 NOI and represented 54% of its total gross book value.
VTR’s OM&R portfolio consisted of 460 properties which made up 32% of its 3Q23 NOI and represented 28% of its total gross book value.
And VTR’s Triple-Net portfolio consisted of 334 properties which made up 31% of its 3Q23 NOI and represented 18% of its total gross book value.
VTR has an investment-grade balance sheet and reasonable debt metrics, including a net debt to further adjusted EBITDA of 7.0x, a total indebtedness to gross asset value ratio of 38%, a secured debt to gross asset value ratio of 9%, and a fixed charge coverage ratio of 3.3x.
Additionally, as of their 3Q update , VTR improved its variable rate debt exposure to 8% of its total consolidated debt and had approximately $3.0 billion in liquidity as of September 30, 2023.
Since 2014, VTR has had a negative average AFFO growth rate of -2.38%. AFFO per share is expected to fall by 1% in 2023, but then to increase by 9% in both 2024 and 2025.
VTR’s dividend history could be better, as they have made 3 significant dividend cuts since 2014. In 2017, VTR cut its dividend by -21.59%, but then increased it by 35.91% the following year.
In 2020, VTR cut its dividend by -21.61% and then cut its dividend again by -27.57% in 2021. Since that time VTR has maintained its annual dividend rate of $1.80 per share.
Currently, VTR pays a 3.70% dividend yield that is well covered with an AFFO payout ratio of 75.63%.
Shares are trading at a premium right now, with a current P/AFFO of 20.43x, compared to its average AFFO multiple of 16.40x.
We rate Ventas a Hold.
In Closing
Our focus here at our Investing Group is to focus on high-quality REITs with rock-solid balance sheets.
Our screening process is not exclusively on credit ratings; however, we do like to see how the rating agencies view each company within our coverage spectrum.
Over the years I've learned that access to low-cost capital is extremely important to the value creation process because companies create value by investing at rates of return that exceed their cost of capital.
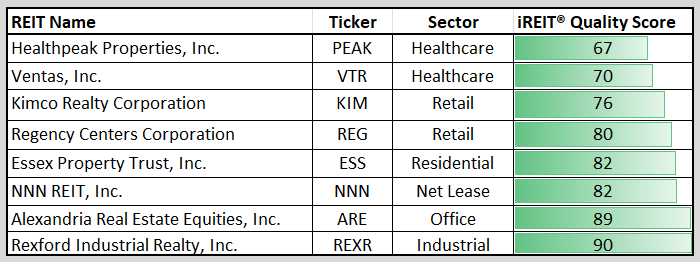
In 2022 we created an Index called the iREIT ® -MarketVector ™ Quality REIT Index that provides exposure to high-quality U.S.-listed common and preferred equity securities of REITs while ensuring sector diversification.
In order to be selected, the company must be included in the iREIT ® Equity REIT-100 universe. Our automated quality screener generated the following scores as of January 8, 2024.
It's important to always insist on quality and value when selecting individual securities. As always, thank you for reading.
Happy SWAN Investing!
For further details see:
Who's Buying BBB+ Rated REITs