SPG - Who's Buying These 'Fortress' A-Rated REITs?
2023-12-29 07:00:00 ET
Summary
- Blue chip REITs are high-quality companies with access to equity and debt, stable earnings, and conservative dividend policies.
- Eight A-rated REITs with strong balance sheets and credit ratings are highlighted, including Realty Income, Equity Residential, AvalonBay, Simon Property Group, Prologis, Public Storage, MidAmerica, and Camden Property.
- These REITs have demonstrated consistent growth in adjusted funds from operations and dividends, making them attractive investments.
I know you've heard me preaching blue chip real estate investment trusts, or REITs, for quite some time on Seeking Alpha.
For a good reason.
Blue chips are the crème de la crème, the very best quality companies that you can own.
They're great stocks to own in almost any market cycle because they most always have access to equity and debt.
And they typically generate stable earnings and dividends.
The most common attributes for a blue chip are its balance sheet and conservative dividend policy.
Specifically, blue chip companies mostly always have modest debt ratios with low-risk credit ratings.
Over the last six months I've become fixated with owning just the highest quality REITs.
Knowing that, I decided to search for the best balance sheets. That requires first using credit agency ratings to identify candidates with A- or higher rating.
iREIT®
As you can see, there are eight A-rated REITs. In this article, I will provide a snapshot of each company along with charts that demonstrate the resiliency of the underlying earnings (adjusted funds from operations, or AFFO, per share) as well as the future growth prospects.
Later I'll put together a similar article for the BBB+ rated REITs.
Realty Income Corporation ( O )
Realty Income is a net-lease REIT with a market cap of approximately $42 billion and a 262.6 million SF portfolio consisting of single-tenant, free-standing commercial properties that are net leased to tenants operating in defensive industries such as grocery and convenience retail.
Realty Income was formed in 1969 and went public in 1994. The company is a member of the S&P 500 and a Dividend Aristocrat, having raised its monthly dividend for 29 consecutive years.
Their portfolio includes more than 13,000 commercial properties leased to tenants operating in 85 separate industries across all 50 states, the U.K., Spain, Italy, and Ireland. At the end of the third quarter, Realty Income reported physical occupancy of 98.8% with a weighted average lease term ("WALT") of 9.7 years.
Realty Income has been operating for more than 54 years and has delivered dependable and consistent results for decades.
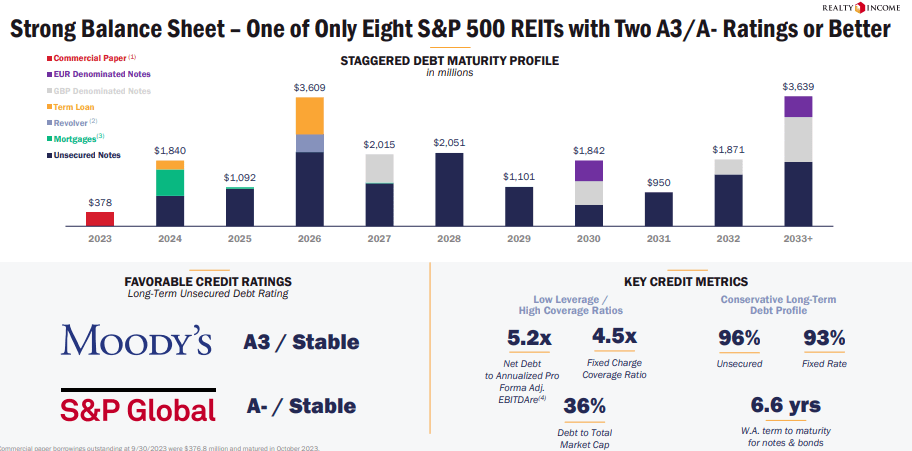
They have an A- credit rating and strong credit metrics including a net debt to pro forma EBITDAre of 5.2x, a long-term debt to capital ratio of 39.81%, and a fixed charge coverage ratio of 4.5x.
Their debt is 96% unsecured and 93% fixed rate with a weighted average interest rate of 3.84% and a weighted average term to maturity of 6.6 years for their outstanding notes and bonds.
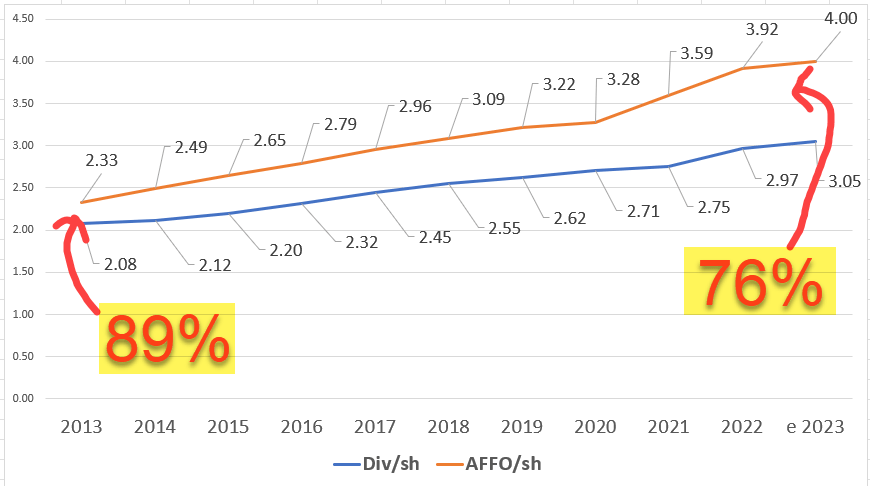
Since 2013 Realty Income has had an average adjusted funds from operations ("AFFO") growth rate of 6.11% and an average dividend growth rate of 5.76%.
Not only has Realty Income paid uninterrupted dividends, but they have improved their dividend coverage over the last decade with their AFFO dividend payout ratio improving from 89% in 2013 to an AFFO payout ratio of 76% expected for the full year 2023.
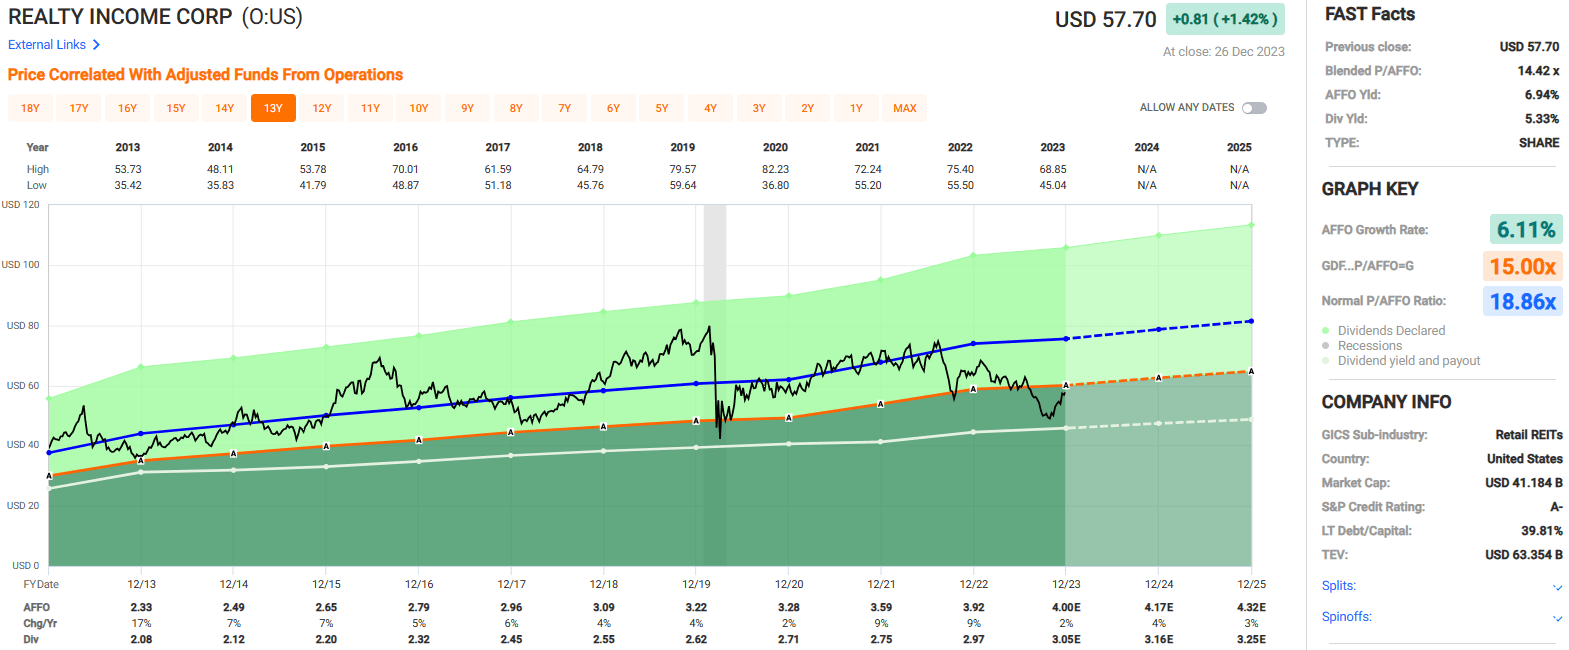
Currently the stock pays a 5.33% dividend yield and trades at a P/AFFO ratio of 14.42x, compared to its 10-year average AFFO multiple of 18.86x.
We rate Realty Income a Buy.
Equity Residential ( EQR )
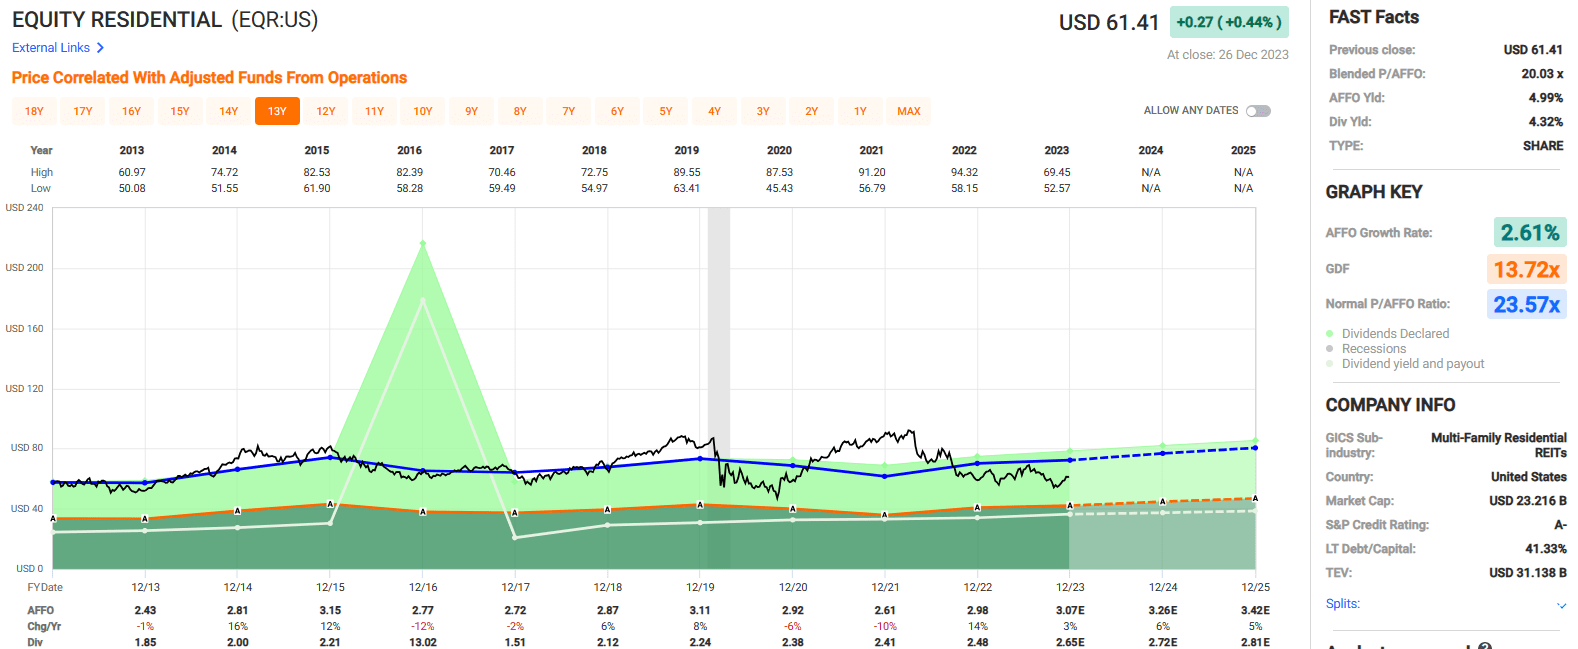
Equity Residential is a multifamily REIT with a market cap of approximately $23 billion and has a portfolio of real estate consisting of 305 multifamily communities containing 80,683 apartment homes.
EQR specializes in the development, acquisition, and management of multifamily communities and attempts to appeal to affluent renters by targeting dynamic markets such as Boston, New York, San Francisco, Los Angeles, Seattle, and Washington, D.C.
In addition to their established markets, EQR has been expanding into fast-growing markets such as Denver, Atlanta, Austin, and Dallas/Ft. Worth.
At the end of the third quarter, EQR reported a same-store physical occupancy of 96.0%.
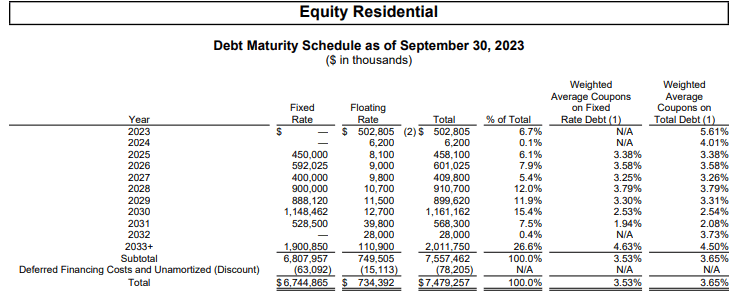
Equity Residential has an investment-grade balance sheet with an A- credit rating and solid credit metrics, including a net debt to normalized EBITDAre of 4.24x, a long-term debt to capital ratio of 41.33%, and a debt service coverage ratio of 6.08x.
Their debt is 78.1% unsecured and 90.2% fixed rate with weighted average interest rate of 3.65%, and a weighted term to maturity of 8.3 years.
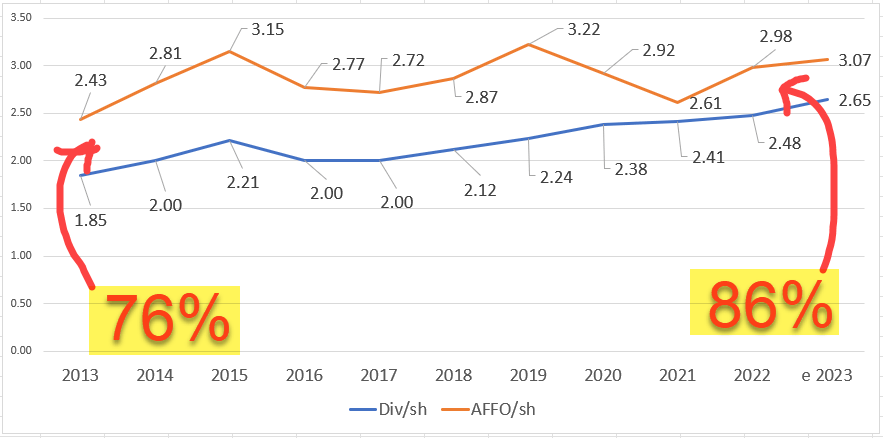
Since 2013 Equity Residential has had an average AFFO growth rate of 2.61% and a compound dividend growth rate of 3.36%.
EQR's AFFO payout ratio has gotten a bit higher over the past 10 years, going from 76% in 2013 to 86% expected in 2023.
While the AFFO payout ratio has gotten higher, it is still well within reason, and EQR's cash flow can still comfortably cover the dividend.
Currently EQR pays a 4.32% dividend yield and trades at a P/AFFO of 20.03x, compared to its 10-year average AFFO multiple of 23.57x.
We rate Equity Residential a Buy.
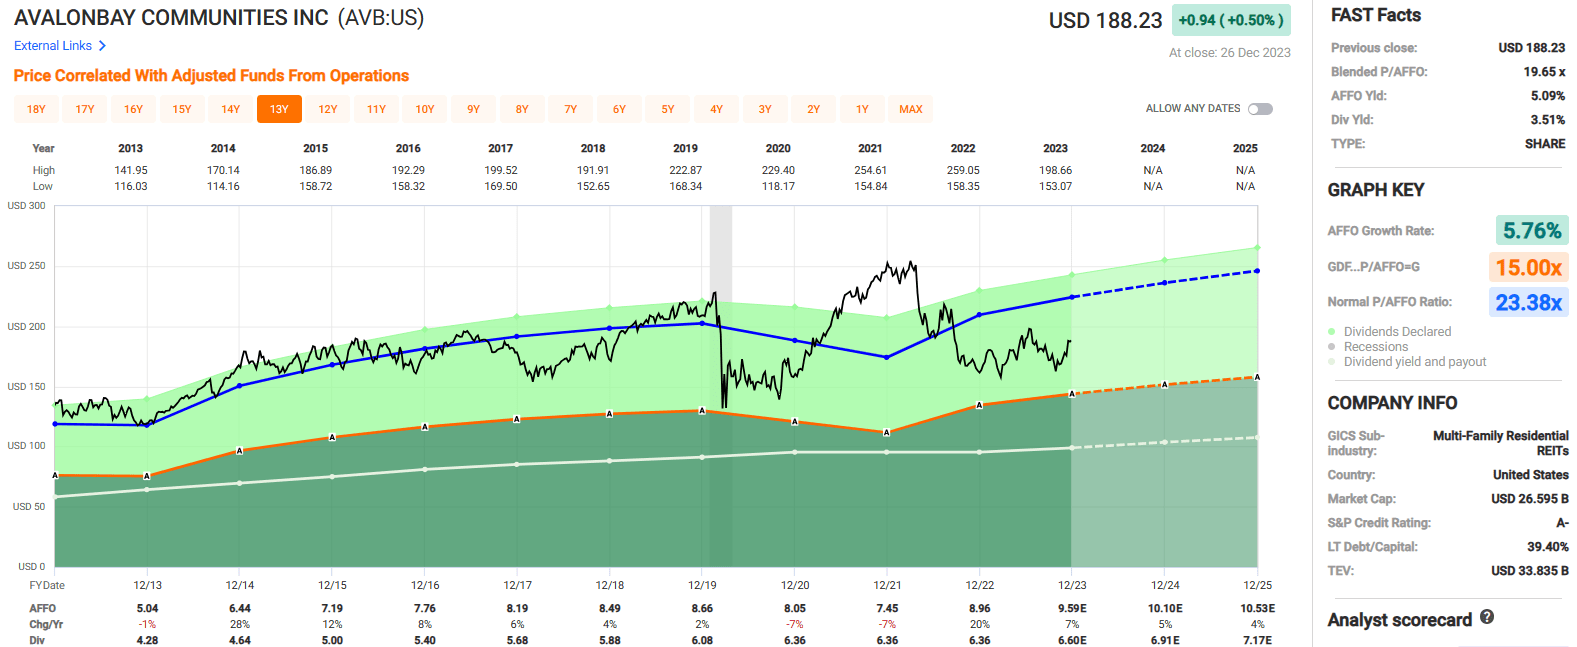
AvalonBay Communities, Inc. ( AVB )
AvalonBay is a multifamily REIT with a market cap of approximately $27 billion and has a portfolio consisting of 296 multifamily communities containing approximately 89,200 apartment homes across 12 states and Washington D.C.
AVB specializes in the development, acquisition, and management of apartment communities with their established markets located in the leading metro areas of New York, New England, New Jersey, the Mid-Atlantic, California, and the Pacific Northwest.
Additionally, the company is increasing its national footprint with expansion regions located in North Carolina, Southeast Florida, Texas, and Colorado.
At the end of the third quarter, AVB reported same-store average rental revenue per home of $2,962 and same-store economic occupancy of 95.7%.
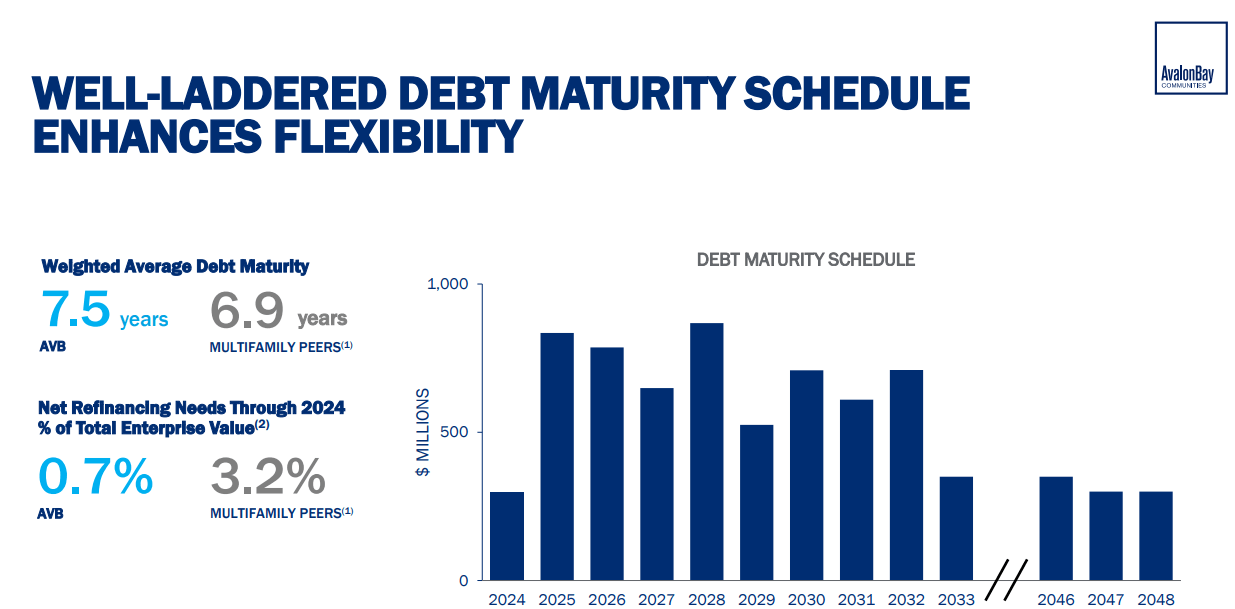
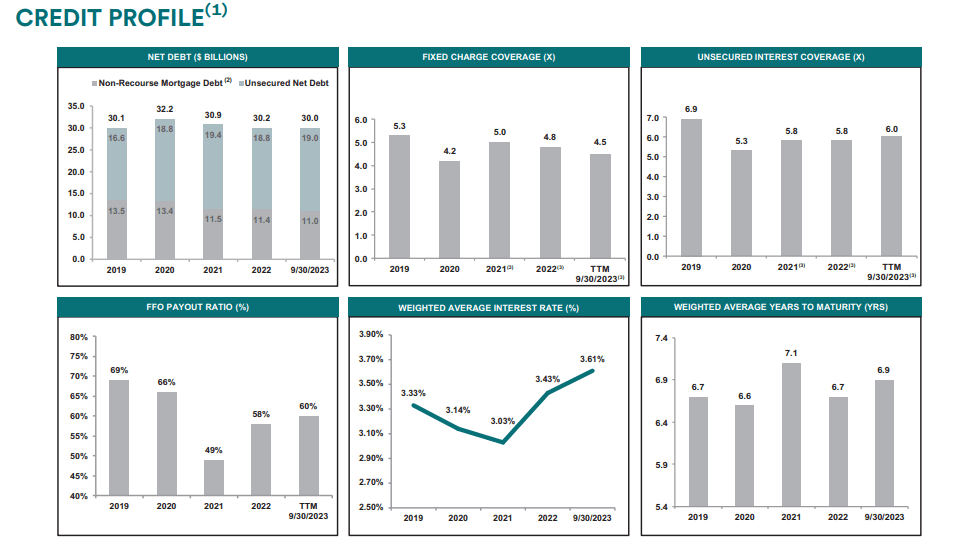
AvalonBay has an A- credit rating and strong credit metrics including a net debt to core EBITDAre of 4.1x, a long-term debt to capital ratio of 39.40%, and a debt service coverage ratio of 7.3x.
Additionally, AVB's debt has an average interest rate of 3.4% and a weighted average term to maturity of 7.5 years.
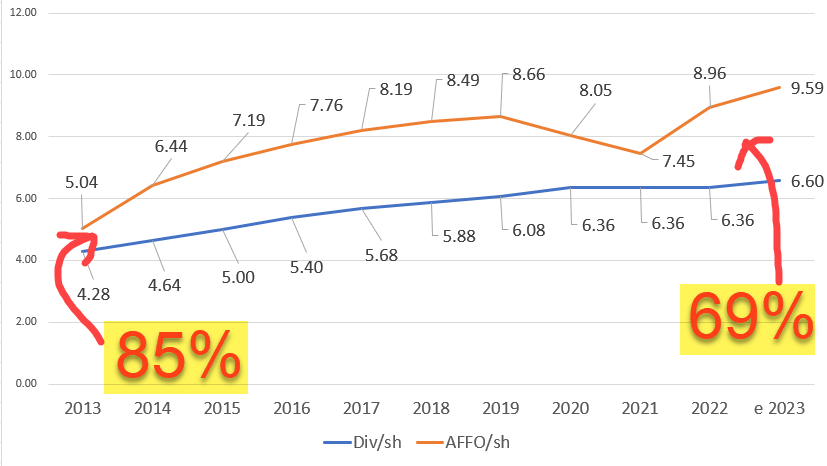
Since 2013 AvalonBay has had an average AFFO growth rate of 5.76% and an average dividend growth rate of 5.12%.
The apartment REIT has made excellent progress getting its AFFO dividend payout ratio to a more conservative level over the past 10 years, with the AFFO payout ratio going from 85% in 2013 to an AFFO payout ratio of 69% expected in 2023.
Currently the stock pays a 3.51% dividend yield and trades at a P/AFFO ratio of 19.65x, compared to its 10-year average AFFO multiple of 23.38x.
We rate AvalonBay a Buy.
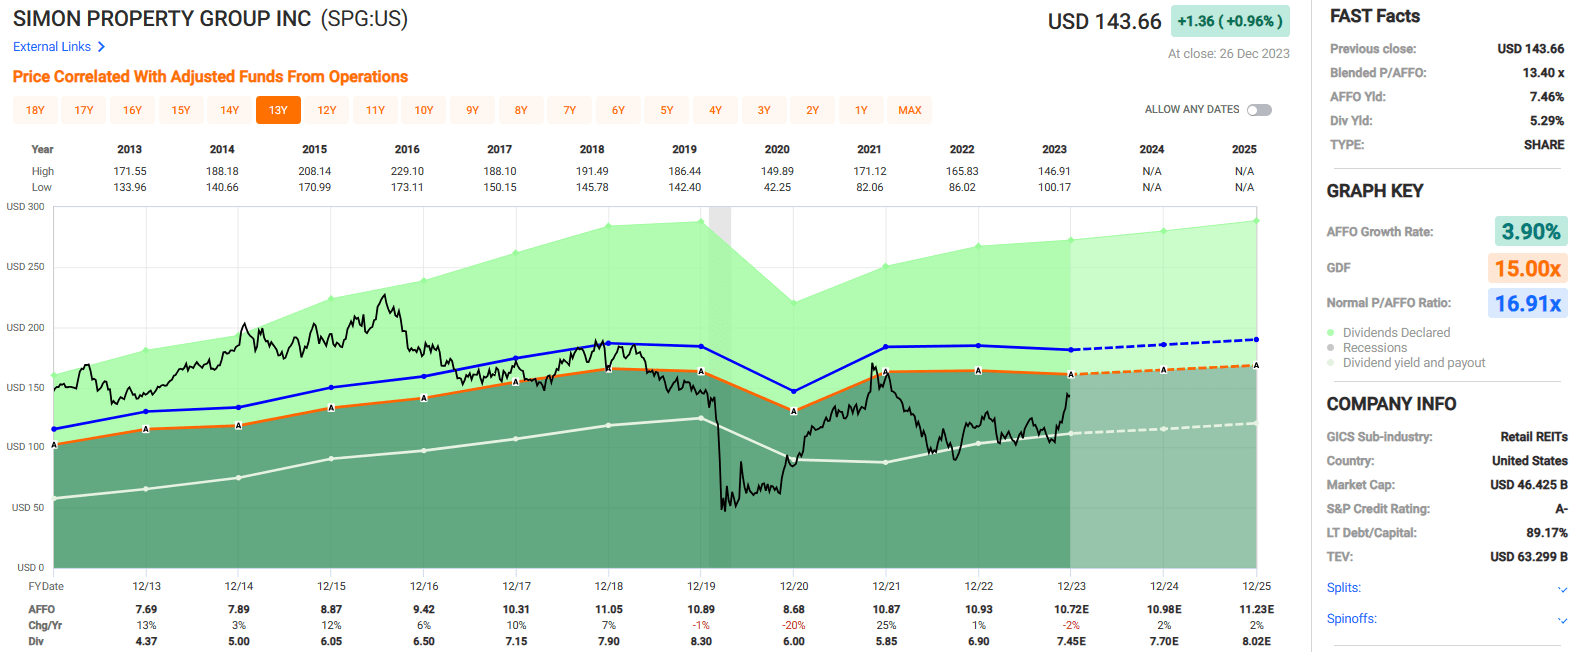
Simon Property Group, Inc. ( SPG )
Simon Property is a mall REIT with a market cap of approximately $47 billion and a 183 million SF portfolio comprised of 230 income producing properties located in North America, Asia, and Europe which primarily consist of shopping malls, Premium Outlets, and The Mills.
Simon's U.S. properties are located across 37 states, and they have interests in international properties in Asia through their 84% noncontrolling interest in the Taubman Realty Group.
In addition to its properties in the U.S. and Asia, Simon Property owns 35 Premium Outlets in Canada and Europe.
Finally, SPG has a 22.4% equity stake in Klépierre, which is a Paris-based real estate company that has a portfolio of shopping centers located in 14 countries across Europe.
At the end of the third quarter, Simon's U.S. Malls and Premium Outlets had an occupancy rate of 95.2%.
SPG is investment grade with an A- credit rating and has strong credit metrics including a total debt to total assets ratio of approximately 42%, a net debt to EBITDA of 6.10x, and a fixed charge coverage ratio of 4.5x.
Additionally, SPG's debt is 95.7% fixed rate with a weighted average interest rate of 3.61% and a weighted average term to maturity of 6.9 years.
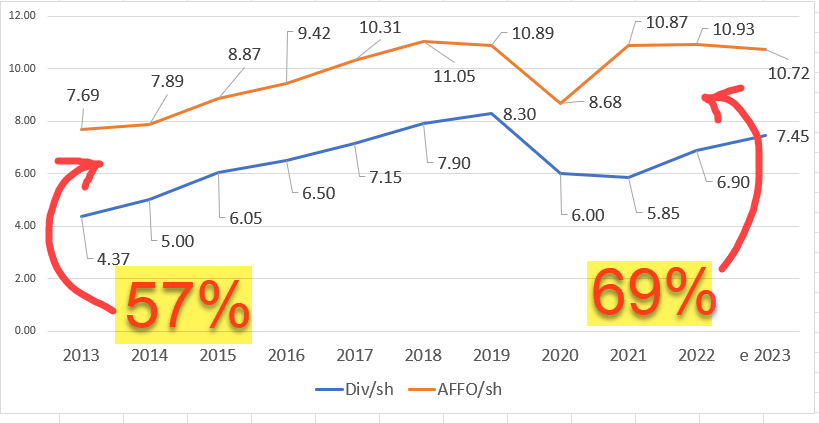
Since 2013 Simon Property has had an average AFFO growth rate of 3.90% and an average dividend growth rate of 6.95%.
SPG's AFFO dividend payout ratio has increased over the last decade from 57% in 2013 to 69% expected in 2023, but with an AFFO payout ratio under 70%, Simon Property should have no problem covering and raising its dividend going forward.
Currently the stock pays a 5.29% dividend yield and trades at a P/AFFO ratio of 13.40x, compared to its 10-year average AFFO multiple of 16.91x.
We rate Simon Property Group a Hold.
Prologis, Inc. ( PLD )
Prologis is an industrial REIT with a market cap of approximately $125 billion and a 1.2 billion SF portfolio consisting of approximately 5,500 industrial properties located on 4 continents and across 20 countries.
PLD is simply an industrial juggernaut, with the next largest publicly traded industrial REIT, Rexford (REXR), having a market cap of around $12 billion compared to PLD, which has a market cap well exceeding $100 billion.
Prologis has approximately 6,700 tenants. This includes nationally recognized companies such as Amazon, Home Depot, Walmart, UPS, FedEx, and DHL. During the third quarter, PLD's owned and managed properties had an average occupancy of 97.1%.
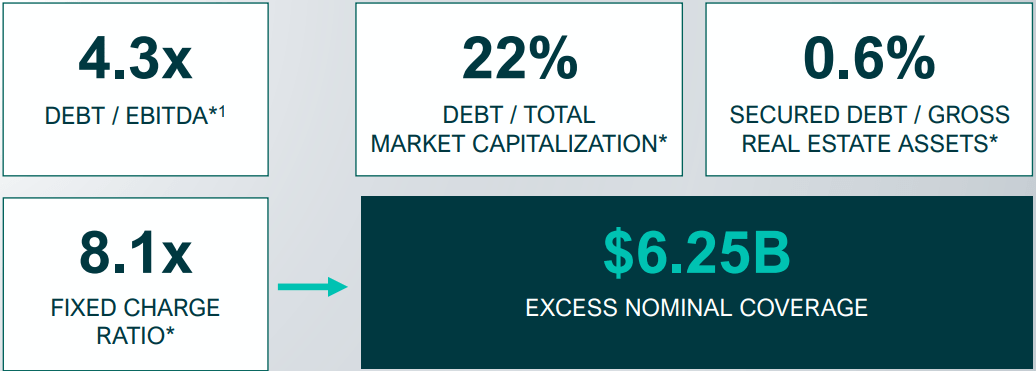
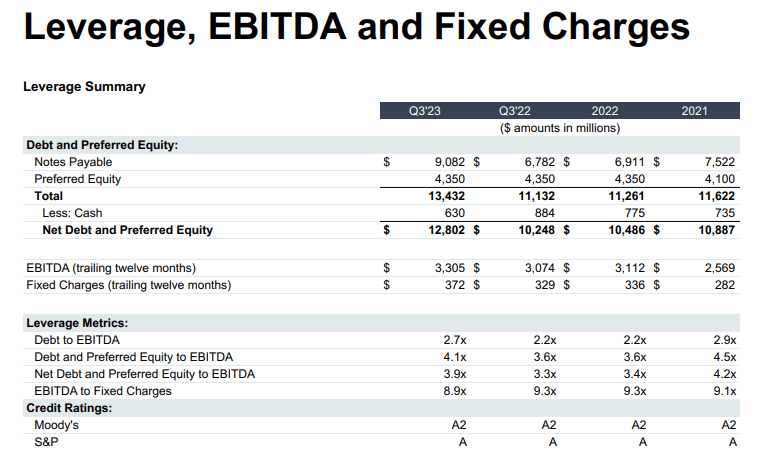
PLD has an investment-grade balance sheet with an A credit rating from S&P Global and an A3 credit rating from Moody's. Prologis has excellent credit metrics including a debt to EBITDA of 4.3x, a long-term debt to capital ratio of 34.43%, and a fixed charge coverage ratio of 8.1x.
At the end of the third quarter, PLD's debt as a percentage of its total market cap was 22%. It had a weighted average interest rate of 2.9%, with a weighted average term to maturity of 9.5 years.
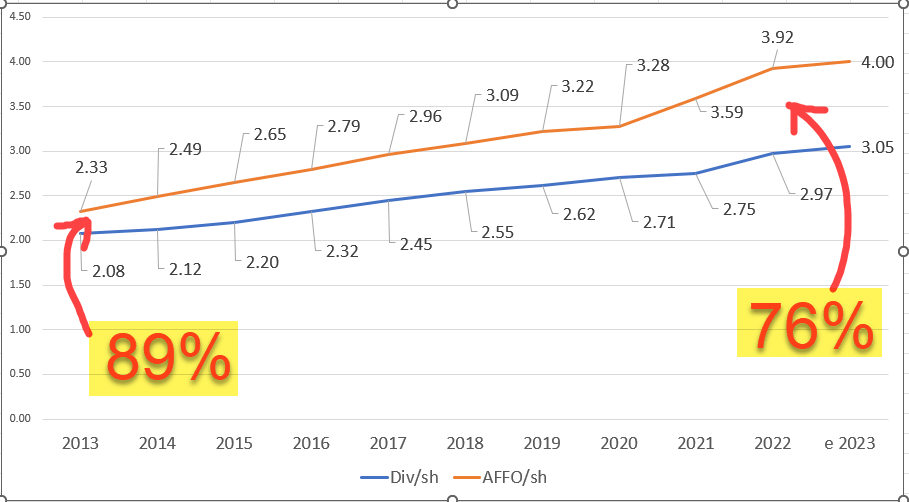
Since 2013 Prologis has had an average AFFO growth rate of 12.05% and an average dividend growth rate of 11.13%.
PLD has done an excellent job in growing the dividend while improving the AFFO dividend payout ratio, which stood at 89% in 2013, compared to just 76% expected for 2023.
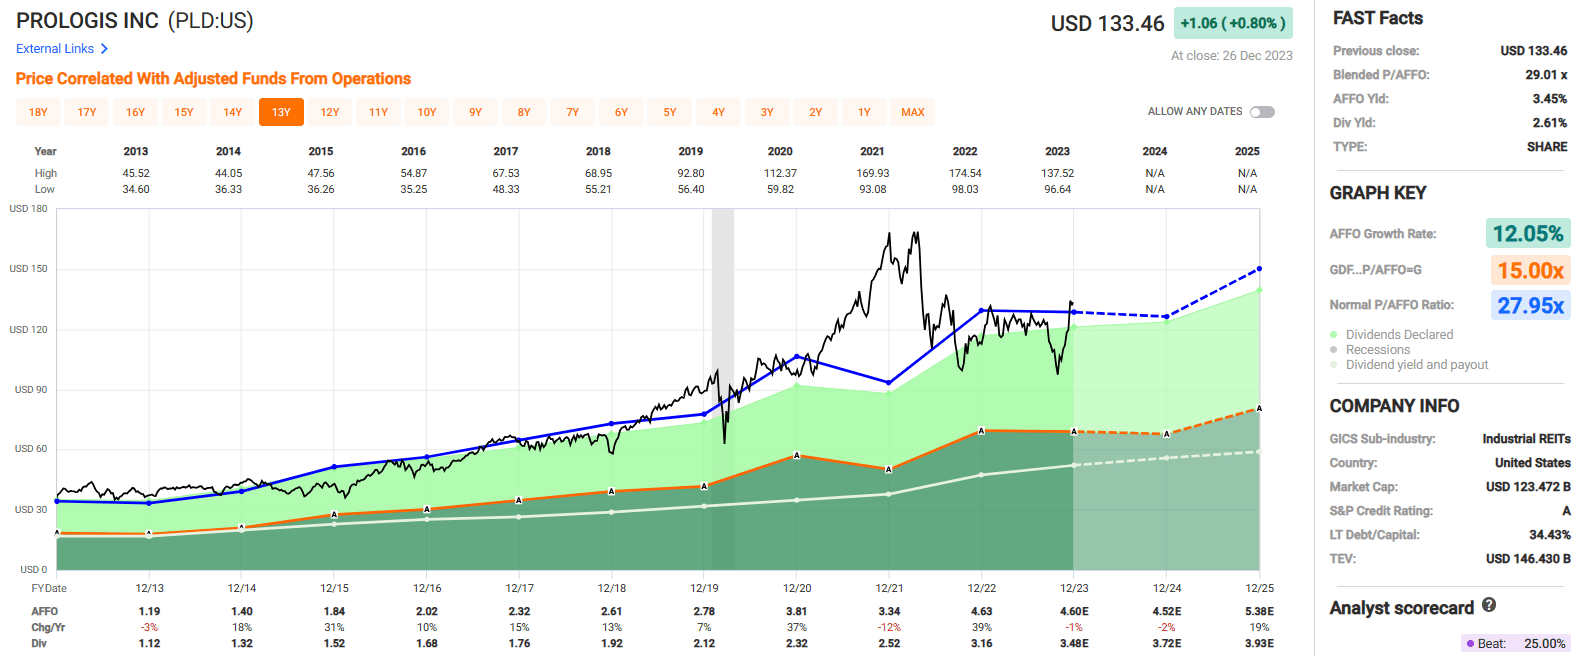
Currently the stock pays a 2.61% dividend yield and trades at a P/AFFO ratio of 29.01x, compared to its 10-year average AFFO multiple of 27.95x.
We rate Prologis a Buy.
Public Storage ( PSA )
Public Storage is a self-storage REIT with a market cap of approximately $54 billion. It has a portfolio comprised of 3,028 self-storage facilities covering roughly 217 million SF across 40 states in the U.S.
Additionally, PSA has a 35% equity interest in Shurgard Self-Storage (EBR: SHUR), which owns more than 250 self-storage properties covering 15 million SF across 7 countries in Europe.
Public Storage specializes in the development, acquisition, and operation of self-storage properties which serve almost 2 million customers across the U.S. and Europe.
PSA offers multiple types of storage including traditional self-storage, business storage, vehicle and RV storage, boat storage, and climate controlled storage.
At the end of the third quarter, PSA reported Same-Store square foot occupancy of 93.4%.
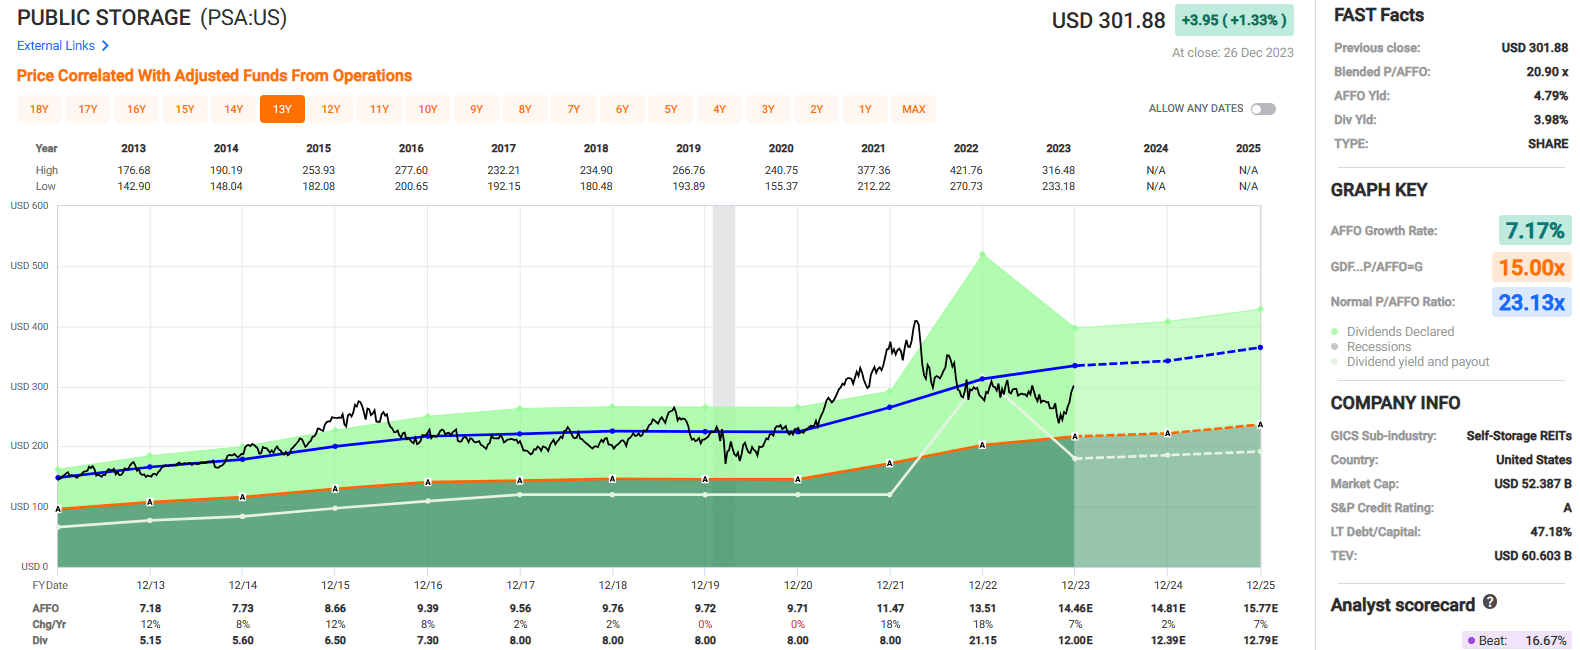
Public Storage has an investment-grade balance sheet with an A credit rating from S&P and an A2 credit rating from Moody's.
They have excellent credit metrics, including a net debt + preferred equity to EBITDA of 3.9x, a long-term debt to capital ratio of 47.18%, and a fixed charge coverage ratio of 8.9x.
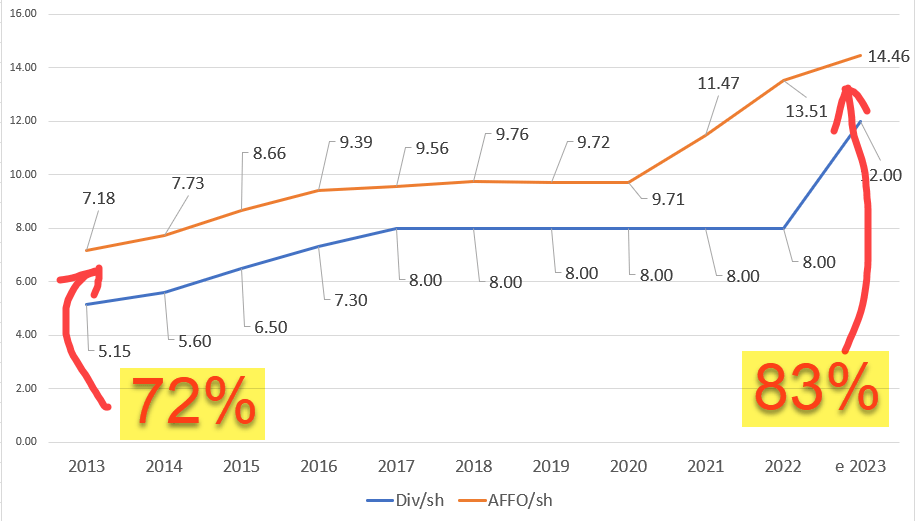
Since 2013, Public Storage has had an average AFFO growth rate of 7.17% and a compound dividend growth rate of 17.00%.
PSA paid a quarterly dividend of $2.00 per share from the fourth quarter of 2016 to the fourth quarter of 2022.
However, the company paid a special dividend of $13.15 per share in 2022 and raised the quarterly dividend from $2.00 to $3.00 per share in the first quarter of 2023, representing an increase of 50% over the rate paid in the prior quarter.
PSA's AFFO dividend payout ratio has increased over the past 10 years, but it is still well within reason at 83% expected in 2023.
Currently the stock pays a 3.98% dividend yield and trades at a P/AFFO ratio of 20.90x, compared to its 10-year average AFFO multiple of 23.13x.
We rate Public Storage a Buy.
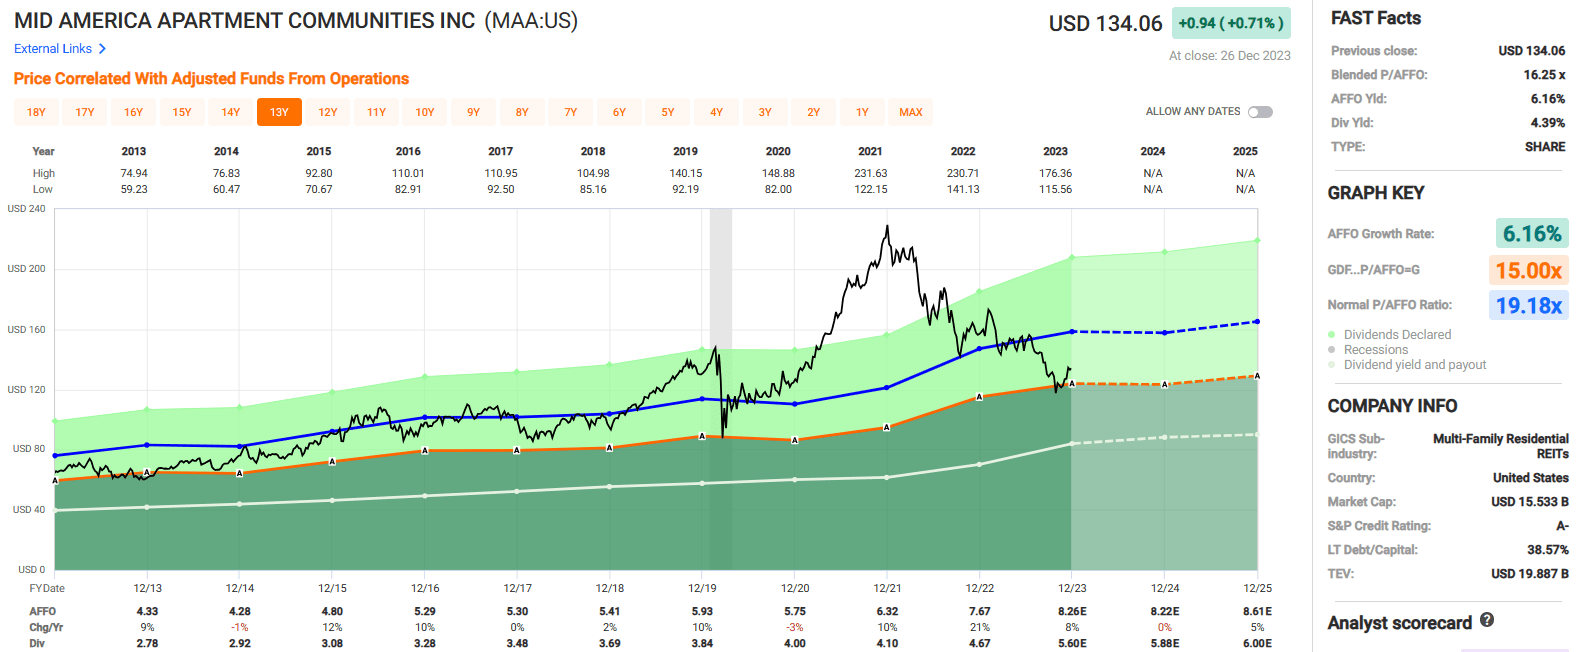
Mid-America Apartment Communities, Inc. ( MAA )
MidAmerica is a multifamily REIT with a market cap of approximately $15.72 billion and has a portfolio comprised of 101,987 apartment homes located in 16 states and the District of Columbia.
MAA specializes in the development, acquisition, and management of apartment communities with a strong focus on high-growth Sunbelt markets.
As a percentage of third quarter same store net operating income ("same-store NOI"), MAA's largest 5 markets during 3Q-23 were: Atlanta at 12.7%, Dallas at 10.0%, Tampa at 6.9%, Orlando at 6.7% and Charlotte at 6.4%.
MAA is an S&P 500 company that has paid consecutive quarterly dividends since 1994.
While MAA has not increased its dividend each year, the company has never suspended or reduced its dividend , even during the Great Financial Crisis and the covid pandemic.
At the end of the third quarter, MAA reported an average physical occupancy of 95.7%.
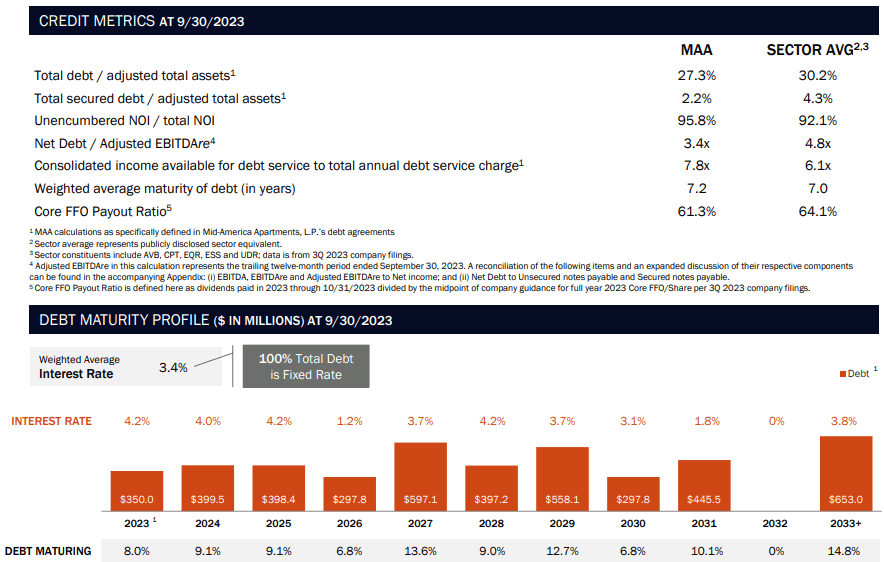
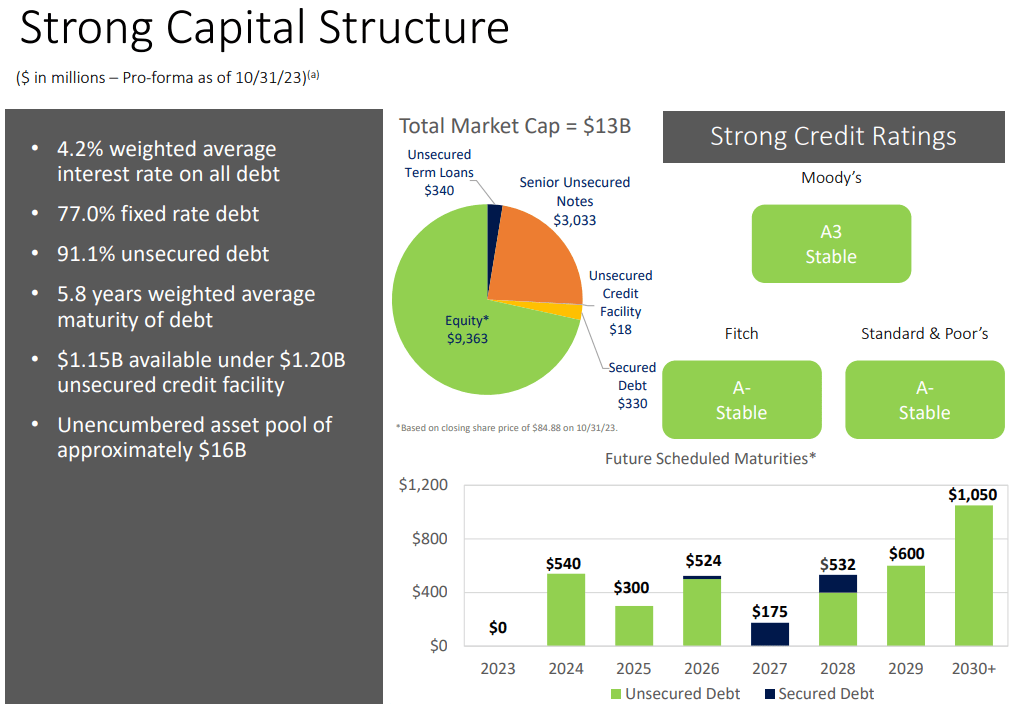
MidAmerica has an A- credit rating and excellent credit metrics including a net debt to adjusted EBITDAre of 3.4x, a long-term debt to capital ratio of 38.57%, and a debt service coverage ratio of 7.8x.
Additionally, 100% of MAA's debt is fixed rate with a weighted average interest rate of 3.4% and a weighted average term to maturity of 7.2 years.
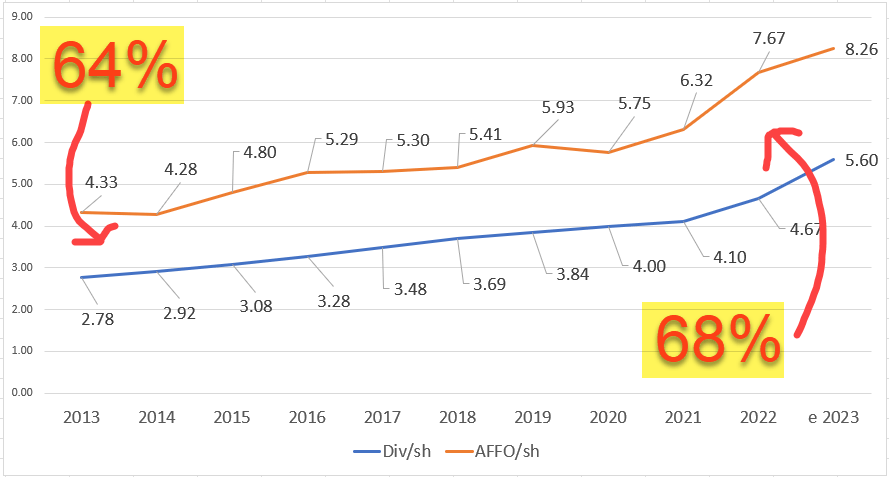
Since 2013, MidAmerica has had an average AFFO growth rate of 6.16% and an average dividend growth rate of 5.92%.
The AFFO dividend payout ratio has remained steady at a conservative level over the past 10 years with the payout ratio increasing from 64% in 2013 to 68% expected in 2023.
While MAA's dividend payout ratio has increased slightly since 2013, their expected AFFO payout ratio of 68% in 2023 is still very conservative and MAA should have no issues covering its dividend.
Currently the stock pays a 4.39% dividend yield and trades at a P/AFFO ratio of 16.25x, compared to its 10-year average AFFO multiple of 19.18x.
We rate MidAmerica a Buy.
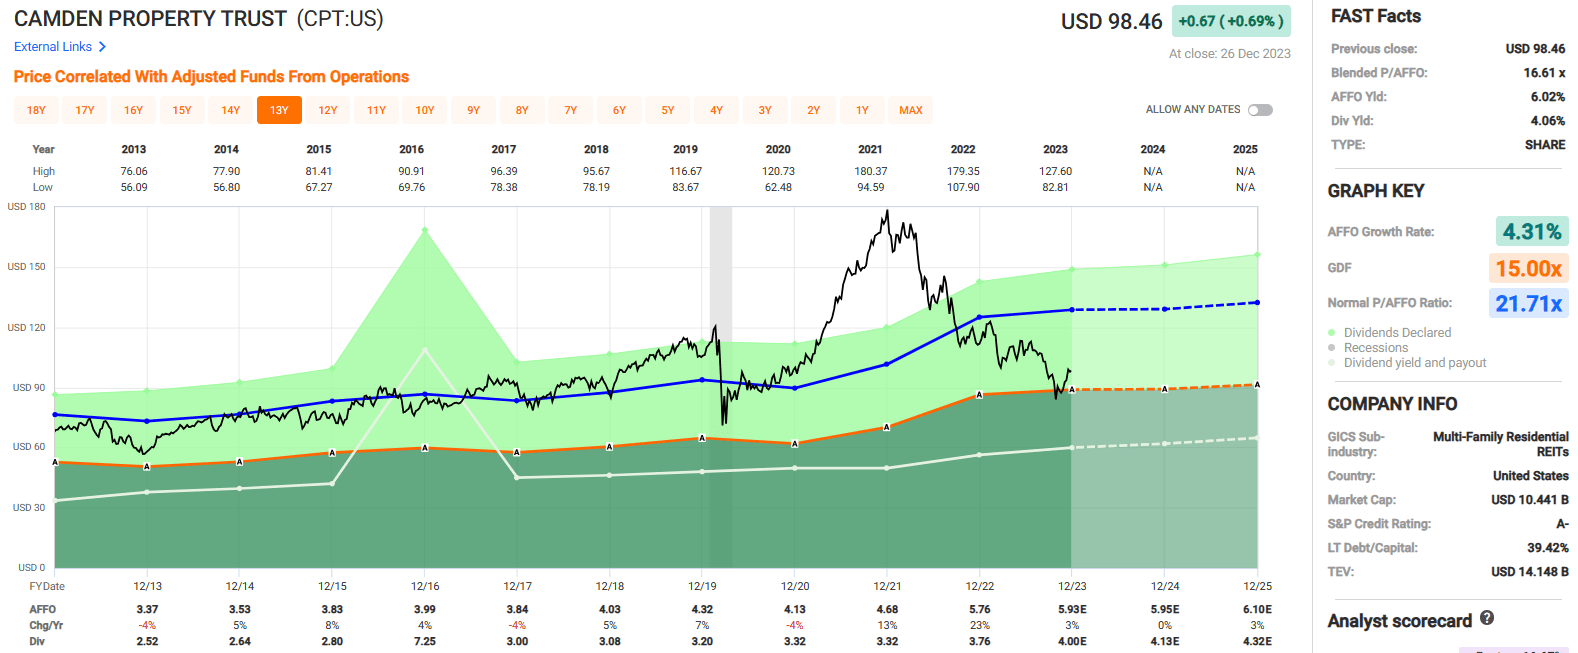
Camden Property Trust ( CPT )
Camden Property is a multifamily REIT with a market cap of approximately $10.5 billion and has a portfolio comprised of 172 properties that contain approximately 59,000 apartment homes across 15 major markets within the United States.
CPT specializes in the development, redevelopment, acquisition, and management of apartment communities located primarily in high-growth Sunbelt markets and to a lesser extent the Mid-Atlantic region of the country.
As a percentage of 3Q-23 NOI, Camden Property's largest market is Washington, D.C. at 12.7%, followed by Houston, Phoenix, and Dallas which made up 11.6%, 8.5%, and 8.2% of their 3Q-23 NOI respectively.
At the end of the third quarter, CPT reported an average monthly rental rate per apartment of $1,999 and an average same property occupancy rate of 95.6%.
Camden has an A- credit rating and excellent credit metrics including a net debt to adjusted EBITDAre of 4.1x, a long-term debt to capital ratio of 39.42%, and a fixed charge coverage ratio of 5.9x.
Additionally, 77% of CPT's debt is fixed rate and 91% is unsecured. Their total debt carries a weighted average interest rate of 4.2% and has a weighted average term to maturity of 5.8 years.
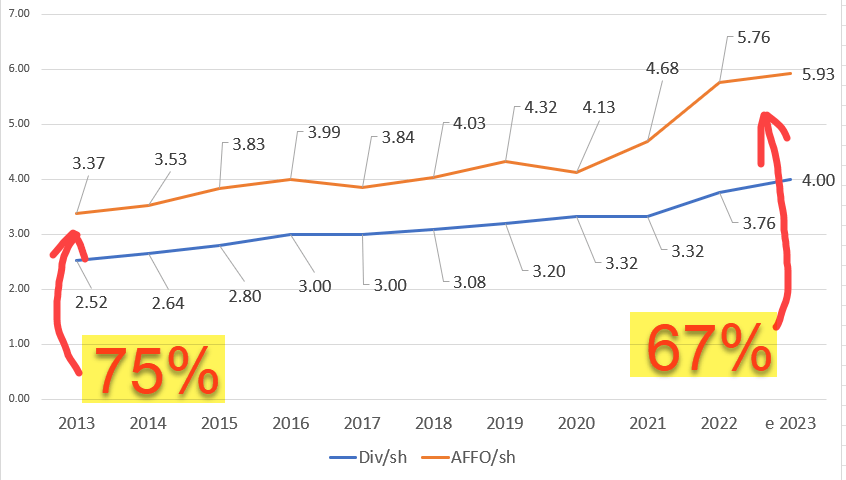
Since 2013 Camden Property has had an average AFFO growth rate of 4.31% and a compound dividend growth rate of 5.32%.
Over this period CPT has improved their AFFO dividend payout ratio from 75% in 2013 to just 67% expected in 2023. This conservative payout ratio should insulate CPT's dividend from any potential downturns and provide room for dividend growth.
Currently, the stock pays a 4.06% dividend yield and trades at a P/AFFO ratio of 16.61x, compared to its 10-year average AFFO multiple of 21.71x.
We rate Camden Property Trust a Strong Buy.
In Closing
Now here's a snapshot of the eight A-rated REITs showing dividend per share ("Div/Sh"), AFFO per share ("AFFO/sh"), and the 2023 Payout Ratio ("Pay Rat"):
iREIT® (using FAST Graph data)
Now, the consensus growth estimates for the eight A-rated REITs:
iREIT® (using FAST Graph data)
I own six of them: ( CPT ), ( SPG ), ( MAA ), ( O ), ( PSA ), and ( PLD ).
How about YOU?
Stay tuned for the BBB+ rated REITs...
"The dynamics of capitalism guarantee that competitors will repeatedly assault any business "castle" that is earning high returns. Therefore, a formidable barrier such as a company's being the low-cost producer...or possessing a powerful worldwide brand...is essential for sustained success." Warren Buffett.
For further details see:
Who's Buying These 'Fortress' A-Rated REITs?