V - Why I'm Buying DIA This Month Instead Of VOO
2023-07-05 10:00:00 ET
Summary
- Tax loss harvesting is a strategy to offset taxable capital gains with corresponding capital losses that are not possible with a single fund in a taxable account.
- We explore the idea of alternating new investments between the Vanguard S&P 500 ETF and the SPDR Dow Jones Industrial Average ETF to make tax loss harvesting easier.
- We look at DIA's history of performing under different market scenarios and explore whether it avoids investing in the S&P 500's most aggressively overvalued stocks.
- Despite its odd index construction, DIA appears to offer today's investors looking to track the market a reasonable value-tilted alternative to investing in market cap-weighted indexes.
As much as I enjoy researching and, occasionally investing in individual stocks, I'm at the point in life where it is not impossible that in coming years other people might have to take over my portfolio. Because no one else in my family has the time or inclination to go deeply into managing individual stocks, that means simplifying my portfolio. The best way to do that, I believe, is to invest in a broad based index fund. The one I've chosen is an S&P 500 fund, the Vanguard S&P 500 ETF ( VOO ). I've discussed my reasons for preferring it and other funds that track the S&P 500 Index ( SP500 ) to "total market" funds like the Vanguard Total Stock Market ETF ( VTI ) in previous articles, most recentl y "Is VTI a Better Investment than VOO after 2022's Big Correction."
All this year VOO has been where I've been investing new money, Required Minimum Distributions from my IRA, and the money I am investing to increase my stock allocation as I get older and am investing more for my heirs than my own needs. Since my IRA is now filled with fixed income that is finally paying reasonable yields, my VOO holding is in my taxable account.
It's Tough Tax Loss Harvest with One Index Fund
An advantage of investing in a taxable account is that you can make lemonade out of a lemon market by tax loss harvesting. But if you are investing new money every month in one fund in a taxable account you can miss out on the chance to take advantage of sharp market decline by tax loss harvesting.
What is Tax Loss Harvesting?
Tax loss harvesting is a strategy that keeps investors fully invested in the market, while they still can take the capital losses made possible by a steep correction. This can have benefits when it comes to tax time. If you aren't familiar with the concept look up the details as they may be different in different countries, depending on the specifics of their tax laws. I'll summarize how tax loss harvesting works in the U.S. here.
The current U.S. tax code lets you offset any taxable capital gains you make with corresponding capital losses. So if you have a loss of $5,000 you won't pay any taxes on a capital gain of the same amount or less. U.S. Tax law also lets you offset $3,000 of ordinary income--salary, business income, or interest, with capital losses that weren't applied to capital gains. Any losses that exceed both the total of your gains and the $3,000 limit in the year you take your losses can be carried over and applied to offset future capital gains.
A tax loss harvesting strategy is based on the idea that decreasing your stock, bond, or ETF holdings during a downturn is usually a mistake, because the market moves in very unpredictable spurts and it is all too easy to miss out on a sudden recovery.
So rather than sell and wait for what you think is a better entry point--a strategy commonly known as market timing--when you tax loss harvest, as soon see a significant loss in one of your holding, you sell it and then immediately invest the proceeds of that sale in some other security that shares very similar characteristics. A month later, as long as you haven't seen a significant gain in the tax loss harvest partner, you can sell you tax loss harvest partner and buy back into your original investment. Thus you end up invested at all time, and eventually with the same net position but with the losses you took leave you with less taxes to pay.
In a serious downturn tax loss harvesting can be extremely useful. Because you can carry over unused gains, some people who tax loss harvested in 2008 were able to write off all their capital gains and $3,000 of ordinary income every year for the next decade!
Avoiding a Wash Sale is Key
The one catch here is that U.S. tax law decrees that:
- The two securities in the trade not be identical. You can't sell VOO and buy the iShares Core S&P 500 ETF ( IVV ) or the SPDR S&P 500 Trust ETF ( SPY ) as all three ETFs track the same index extremely closely.
- You also won't get the benefits of the tax loss if you sell a security that you bought within the period of 30 days before and 30 days after the sale.
If you violate those guidelines, you will create a Wash Sale, which will keep you from being able to use your loss to nullify taxation on your capital gain or $3,000 of income. It's not a serious infraction. Your brokerage will modify the basis of the security involved in the wash sale to include that loss. But you won't have achieved a tax benefit.
Choosing a Tax Loss Partner is Trickier Than It Sounds
I have been tax loss harvesting individual stocks and ETFs for long enough to have learned what the pitfalls can be with this strategy. The biggest one is that if the market surges unexpectedly while you are invested in your tax loss harvesting partner you may end up trapped in your tax loss harvest partner because it now has significant gains that will be taxed if you sell it.
The other issue I've encountered is choosing a tax loss harvest partner that seems nearly identical to what you are selling only to have the two securities prices stop corresponding to each other. For example, I have sold Lowe's ( LOW ) and bought Home Depot ( HD ) only to watch Lowes stock price rise sharply during the 30 days I have to hold my Home Depot while Home Depot declined.
The Usually Recommended Tax Loss Harvest Partner for VOO is VTI
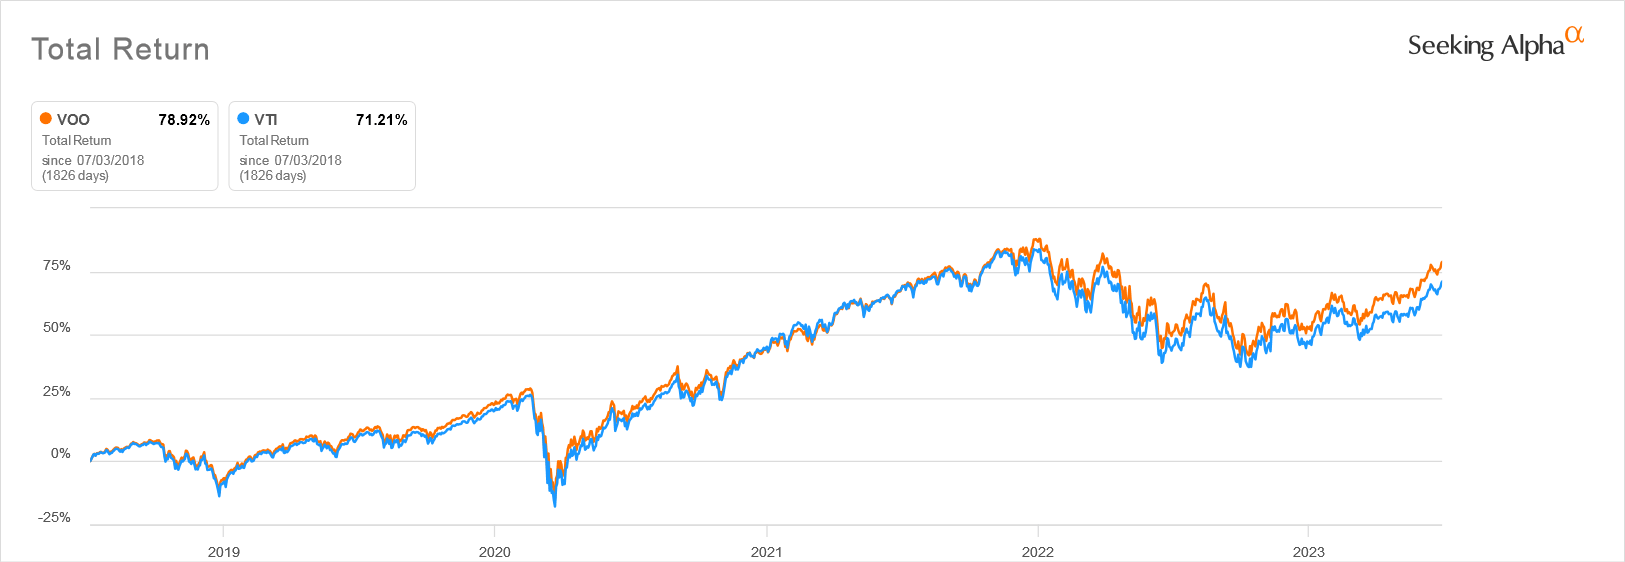
For years I used to tax loss harvest between VOO and the Vanguard Total Stock Market ETF. This is an often recommended pairing. The two ETFs did indeed perform very similarly for years. But then, when the Tech Megastocks took off over during past decade, their performance began to diverge and that divergence has become very significant over the past five years. At times I ended up being stuck holding a lot of VTI when I would have much preferred to be back in VOO.
VOO and VTI 5 Year Total Return Performance
Because of these experiences I've learned to never use as a tax loss harvest partner anything I wouldn't want to hold for months or even years.
Expecting There Will be A Chance to Tax Loss Harvest My 2021-2023 VOO Shares I'm Thinking Ahead
Like many other investors, I keep looking at the current market surge wondering if it is the last gasp of a dying, low-rate funded market that will correct severely once companies and investors face the fact that we are in an interest rate regime now unlike any we have seen since 1982.
If the market does decline back to where it was before the 2023 recovery, I will have a lot of VOO sporting losses. And because of the way the market works, I know that the opportunity to take those losses could appear very suddenly. The last time I tried to tax loss harvest VOO I ran into the problem that I had made my monthly investment in it just 3 weeks before. Since I had forgotten that very small investment, I ended up with a wash sale.
So it struck me recently that what I can do is prepare for a future tax loss harvest opportunity is to investing new money in two different ETFs now, good tax loss harvest partners, alternately investing in one each month. This will prevent me from carelessly ending up with a big wash sale.
The question then became what ETF should I invest in. I toyed with the idea of investing in VTI, which I already own way too much of with a cost basis going back more than two decades. But as you can see from the chart above, over the past five or so years, if the S&P 500 takes a hit, VTI almost always takes a bigger one.
The Top Stocks that Dominate the S&P 500 are Dangerously Expensive
One reason I may be looking at tax loss harvesting VOO in the near future is that like many investors I'm troubled by the outsized role that a handful of tech-related stocks now play in it.
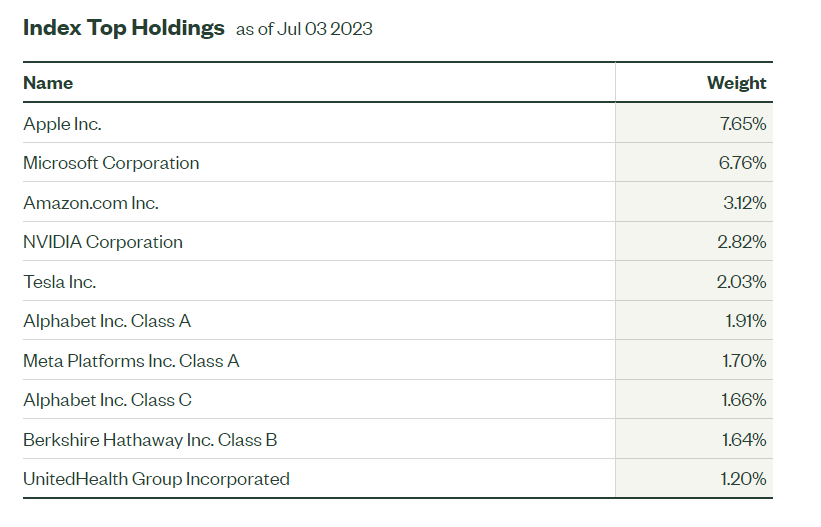
S&P 500 Top Holdings
As you can see, if we consider Alphabet's two share classes, ( GOOG ) and ( GOOGL ) as being one company, the top 5 companies in the S&P 500,s alone make up 24% of the value of the entire index, have extremely rich valuations.
P/E Ratios and Market Caps of the Top 5 Stocks in the S&P 500
| Ticker |
| Market Cap |
| P/E Ratio |
| ( AMZN ) Amazon |
| 1.338T |
| 201.24 |
| ( NVDA ) NVIDIA |
| 1.045T |
| 82.63 |
| ( MSFT ) Microsoft |
| 2.532T |
| 35.4 |
| ( AAPL ) Apple |
| 3.051T |
| 32.21 |
| ( GOOG ) Alphabet Class C |
| 1.536T |
| 24.4 |
| ( GOOG L) Alphabet Class A |
| 1.520T |
| 24.12 |
In particular three stocks concern me: Apple ( AAPL ), Amazon ( AMZN ) and NVIDIA.
Apple Is Trading At A Level That Ignores The Company's Maturity
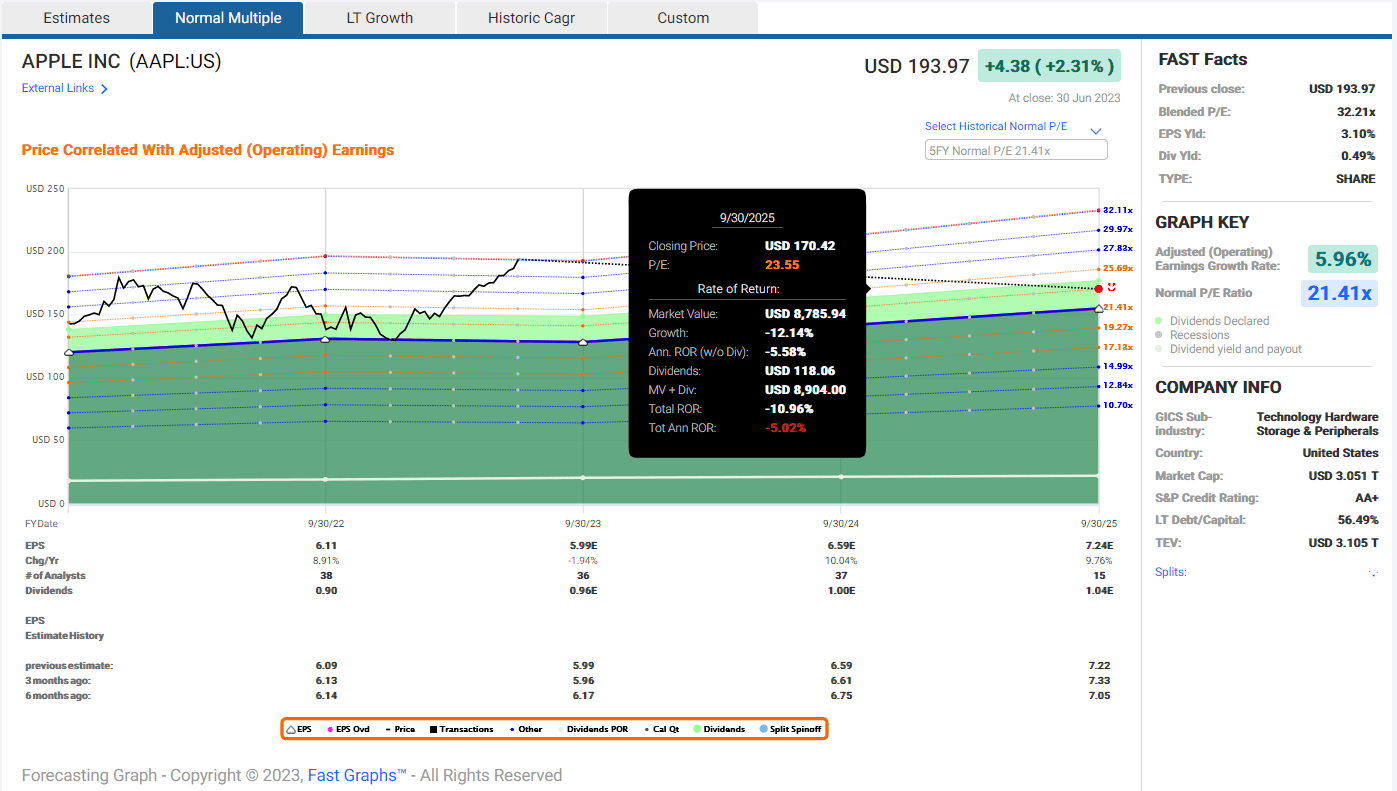
Three of these are of particular concern to me. Apple has been a superb investment for many years and because of its consistent outperformance it's understandable that investors will pay up for its shares. But even so, its current valuation is considerably higher than its average has been over the past 5 years.
Furthermore, with a market capitalization of $3.051 Trillion I keep thinking "Trees don't grow to the sky." Going forward, Apple will be growing its earnings, and no doubt it will be able to have the growth rate of its earnings slightly beat inflation. But even so, based on the typically optimistic analysts' forecasts, its earnings growth appears to be stabilizing at an annual level below 10%, which makes it hard to justify a valuation in the mid-30s.
With Apple stock priced for more than perfection, a single disappointing quarter or unexpected threat to its business might cause Apple's stock price to dive. And as they say, if Apple sneezes, the rest of the tech sector catches cold. A sharp decline in Apple's appeal could easily cause the S&P 500 as a whole to tank.
Apple Future P/E Ratio Based On Current Analyst Forecasts
Compared to Its Historical Average P/E Ratio
How Much Longer Will Investors Keep Buying Into Non-Profit Amazon?
With a forward P/E ratio of 201.14, based on an optimistic forecast that Amazon will earn a paltry $1.58/share for each of its $193.97 shares, and with a recent loss of $.27/share in 2022 you really have to wonder how anyone can still believe that Amazon will ever be a truly profitable investment.
Even if it meets the always optimistic forecasts for its earnings 2 years in the future if its price were to decline to a level that would give it a P/E ratio of 30, which would still be higher than is justified by its projected earnings growth, investors would still be sitting on years of losses.
Amazon Earnings History and Forecast Based on Current Estimates
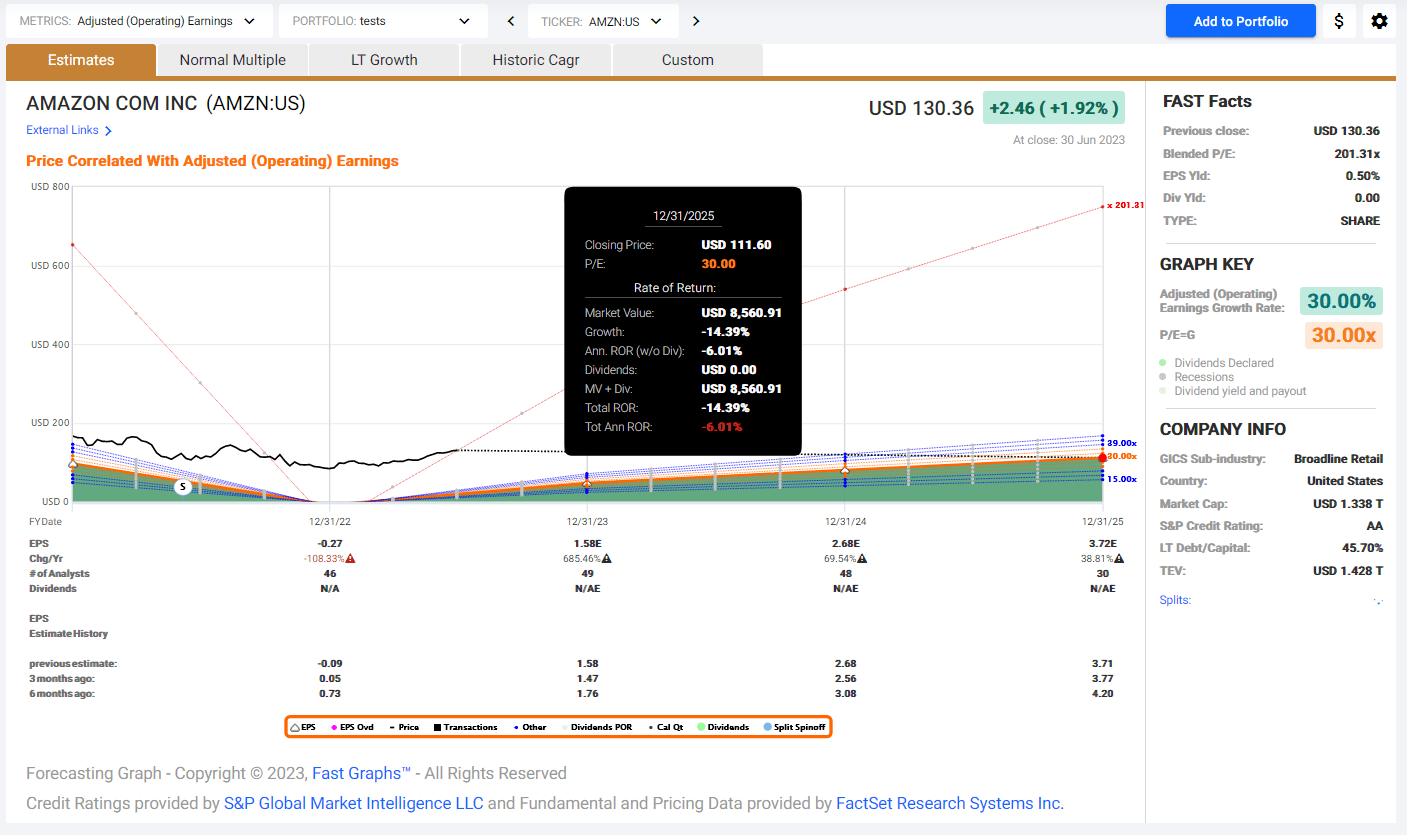
Amazon has been selling investors the dream of a profitable future for well over 20 years now. But it is currently facing with a number of important headwinds. Along with the slowing growth of its Cloud business , Amazon is also dealing with huge problems with a declining reputation due to its years of hosting vendors selling counterfeit products , AI generated nonsense books , and its long history of hosting paid-for fake reviews which has led to a lot of erstwhile Amazon customers to no longer use it for product discovery.
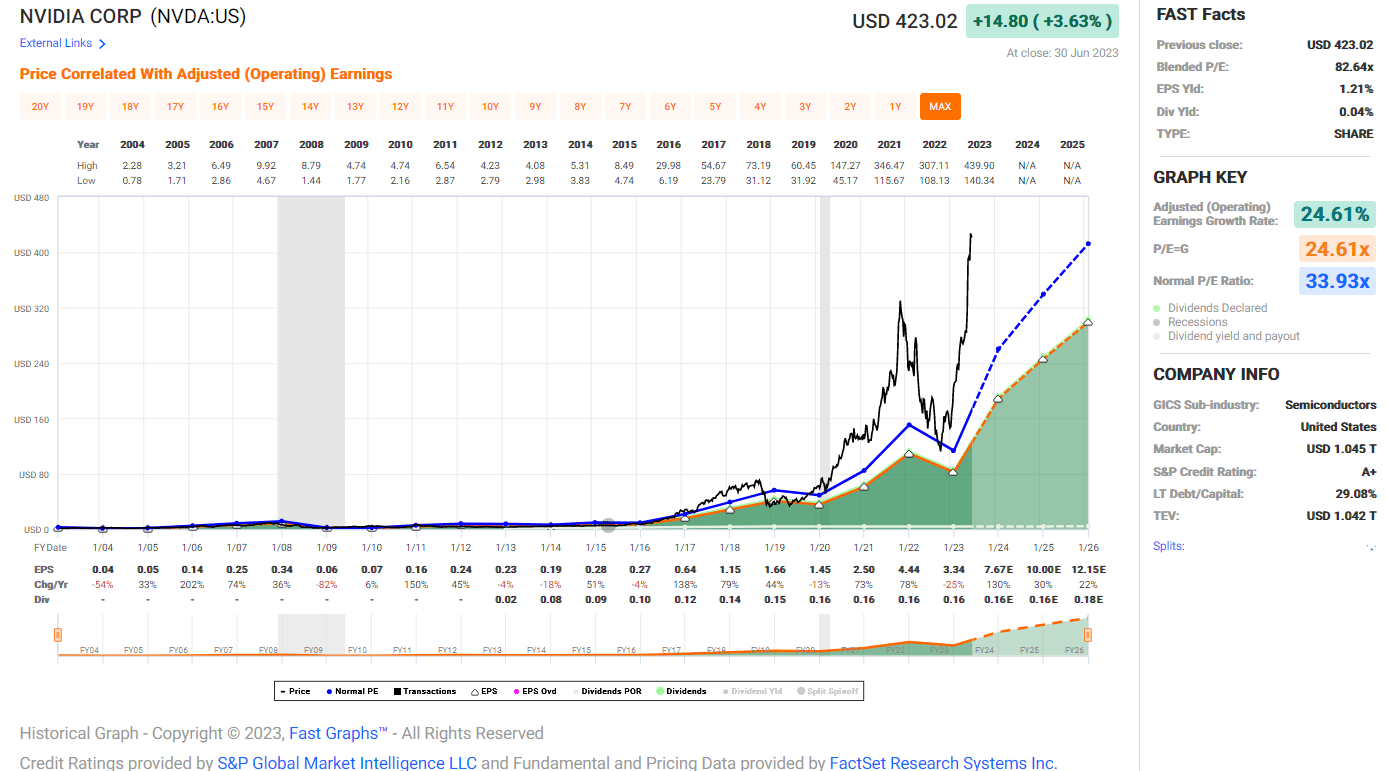
NVIDIA The Latest Fad's Latest Darling
I have no doubt that NVDA is a great company with a solid future. But its current valuation assumes that it will be able to quadruple its market cap--a market cap that is already a bit over $1 Trillion.
NVIDIA Price, Earnings, and P/E Ratio Past 20 Years
Seeking Alpha Analyst, Stuart Allsopp has written a detailed analysis of its current valuation in his article 'Nvidia's Stock Price is Detached from Reality.' The comments include some interesting arguments worth reading too.
Overall, I really don't feel like buying something so much like VOO that its fortunes rest heavily on the fate of these three, and to a lesser extent the likes of Alphabet and Tesla.
So Is There A Large Cap Index Tax Loss Harvest Partner That Avoids These and Similar Stocks?
This is the question I have been asking myself for the past few weeks. VTI is also overweight these same stocks and its index's main difference from the S&P 500 index is that it also holds a lot of small stocks and a lot of unprofitable stocks which have driven down its performance compared to VOO's. These stocks include the overleveraged zombie companies which will be under extreme pressure as interest rates remain far higher than they have been for the last 15 years, which is very likely to happen. I really don't want to own them.
So I was mulling this question when looking at the line on my brokerage screen that shows me the current price of the S&P 500, the Nasdaq, and the Dow Jones Industrial Average. I was thinking how much I liked investing in VOO because I could get a good idea of its performance at any time just by looking at that kind of summary information.
That was when I remembered that my portfolio which still holds a selection of individual stock holdings bought at good valuation has generally tracked a point midway between the daily performance of the S&P 50 and the Dow Jones Industrial Average which is the other index that is widely reported minute to minute. My value stocks have outperformed the S&P 500 during down markets, as has the Dow quite often.
That inspired me to have another look at the ETF that tracks the Down Jones Industrial Average, the SPDR Dow Jones Industrial Average ETF Trust ( DIA ).
The Dow Jones Average Tilts More to Value Than Does The S&P 500
I looked deeply into the Dow Jones Industrial Index ( DJI ) in my article 'Value And Income Investors: Benchmark Your Portfolio With The Dow Not The S&P 500' which I published in May of 2021. I urge you to read that article for the details.
A brief summary of my findings is that the Dow is the oldest market index. It was first constructed long before computers made it easy to keep up with hundreds of stocks on a daily basis. It tracks 30 "Blue Chip" stocks that are chosen by The Wall Street Journal. The index touts itself as " the only index composed of companies that have sustained earnings performance over a significant period of time." Interestingly though it holds only 30 stocks compared to the S&P 500's 500 and VTI's 3,000-4,000 for much of the time I've been investing it has tracked their movements within a reasonable margin of error.
The Dow is price weighted, not market cap weighted. It owns the same number of shares of each stock it holds. But the price of the index isn't a simple sum of the price of a share of each index constituent because it uses complicated formula to arrive at the index's price.
Nevertheless a stock with a high share price will weigh more heavily in the Dow than one with a cheaper price. The Dow Stocks are older, better established as profitable stocks, and also more likely to pay dividends than are the stocks in the S&P 500. All this itself suggests that the Dow may be tilted more towards value.
The Dow's Performance Lags The S&P 500 When The S&P 500 Is Over-Exuberant but Leads in Bad Times
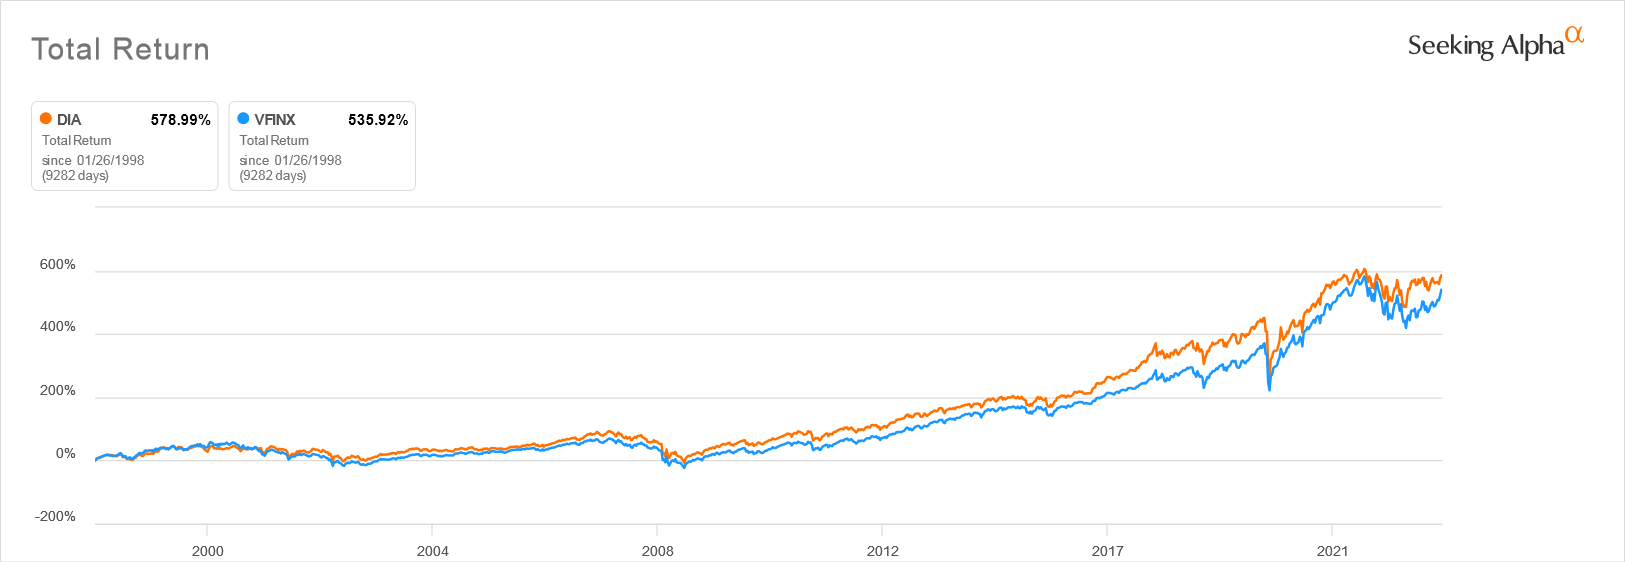
Surprisingly, if you had bought the SPDR® Dow Jones Industrial Average ETF Trust (DIA) that tracks the Dow Jones Industrials in January of 1998, when it first began trading, and held it until now, your total return from DIA would have been better than if you had been invested in the Vanguard 500 Index Fund ( VFINX ) that tracks the S&P 500 over the same period. (The Admiral and ETF share classes of Vanguard's 500 Index Fund did not exist in 1998 so I can't compare it to VTI over a longer period.)
DIA vs VFINX Total Return 1998 - Present
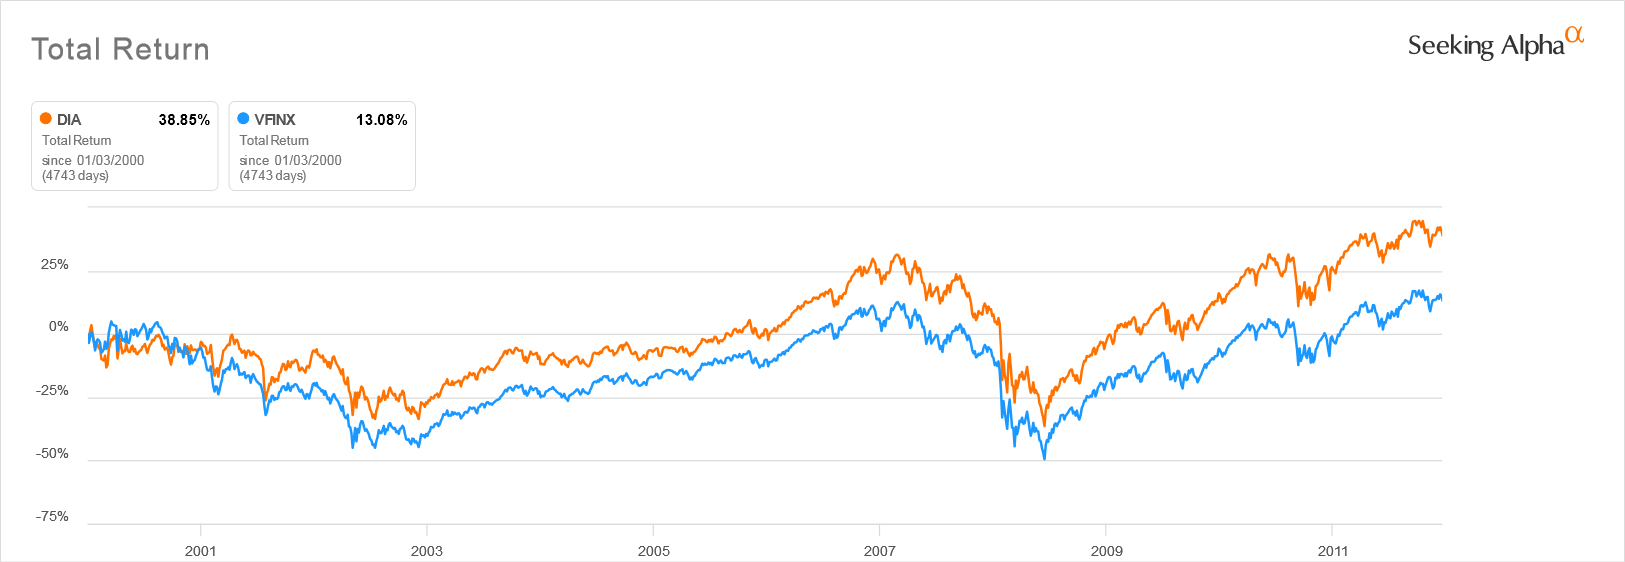
The DOW Outperformed During The Lost Decade of Challenging Markets
As you can see, DIA's better performance over the long term is entirely due to the way that it held up during the "lost decade" that followed the Dot.com bust.
DIA vs VFINX Total Return 2000 - 2012
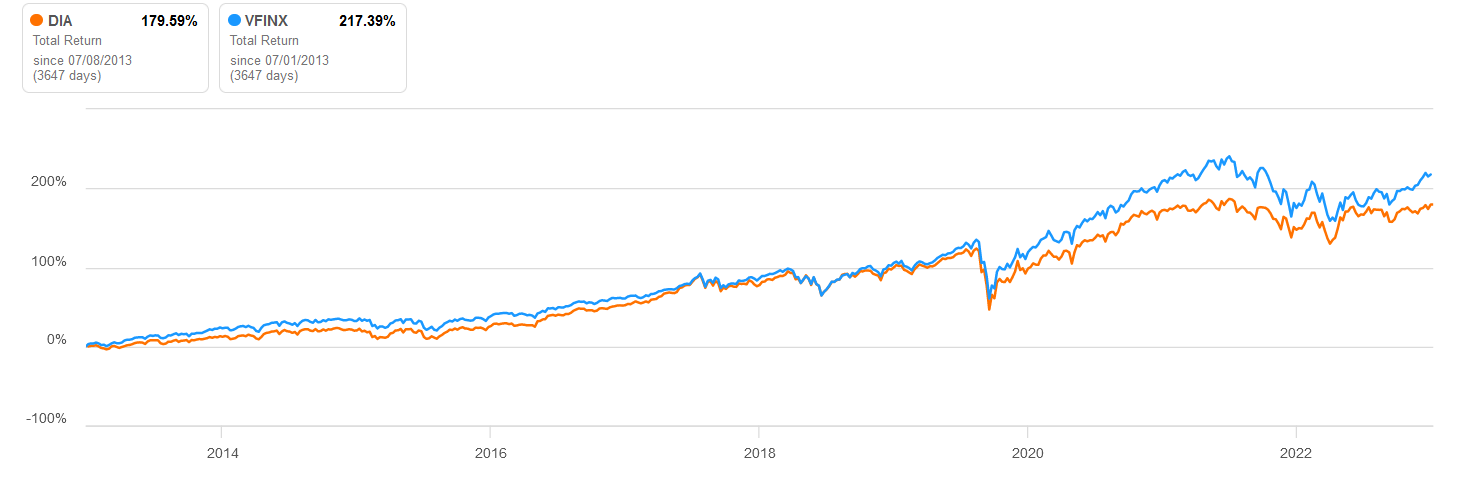
But increasingly, throughout the Bull Market spawned by the Fed's Quantitative Easing, the Dow Jones ETF has performed considerably more poorly than the S&P 500 index fund. You can see this clearly in this comparison of the two ETFs since 2013 when the great, post-Financial Crisis bull market began, fueled by the Fed's dedication to providing the market with cheap money. This underperformance would also suggest that its stocks have more of a value rather than growth tilt as value has underperformed growth through this period.
DIA vs VFINX Total Return 2013 - Present
DIA's Current Holdings Avoid the S&P 500's Stocks with Extreme Valuations
While DIA is, by definition, highly concentrated, since it only holds 30 stocks, the top 10 stocks it holds, which make up 55% of its total value represent more sectors of the market than do the Tech-heavy top 10 of VOO. There are only 2 tech-related companies in DIA's top 10, as opposed to the 8 out of the top 10 found in VOO.
DIA Top 10 Holdings by Weight
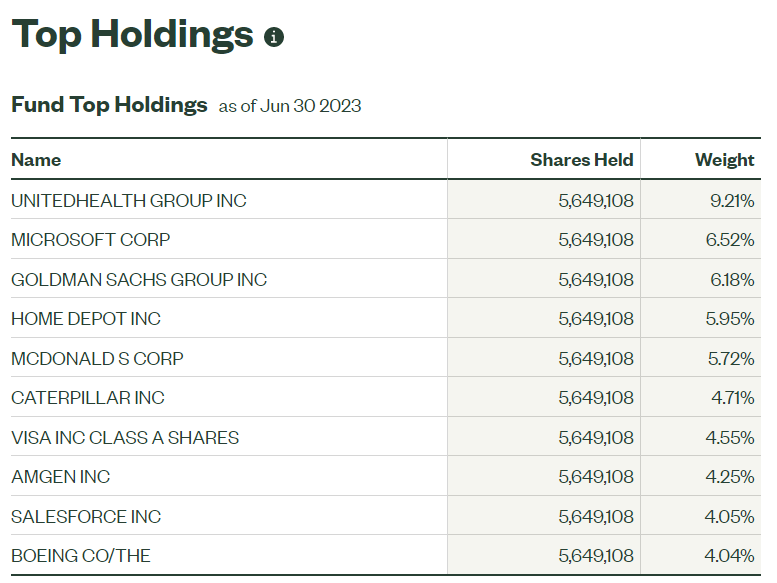
When we look at DIA's top 10 stock's valuations, we don't see the extreme valuations we saw with AMZN and NVIDIA. Though admittedly Boeing's past five years of steady losses are a concern.
We also don't see Apple in this list. Instead Big Tech is represented by Microsoft ( MSFT ) which though it, too, appears to be overvalued in view of its future earnings potential, is still forecast to grow its earnings at an average annual rate of 13.28% going forward, which is more than twice the 5.96% earnings growth rate analysts are forecasting for Apple. (Statistics from FactSet as reported by Fastgraphs.com)
P/E Ratios and Market Caps of Top 10 DIA Holdings
| Ticker |
| Name |
| GICS Industry |
| P/E Ratio |
| Market Cap in |
| ( MSFT ) |
| MICROSOFT CORP |
| Information Technology |
| 35.4 |
| 2.532T |
| ( CRM ) |
| SALESFORCE INC |
| Information Technology |
| 34.41 |
| 205.767B |
| ( V ) |
| VISA INC |
| Financials |
| 28.43 |
| 486.834B |
| ( MCD ) |
| MCDONALDS CORP |
| Consumer Discretionary |
| 28.2 |
| 217.867B |
| ( UNH ) |
| UNITEDHEALTH GROUP INC |
| Health Care |
| 20.42 |
| 447.491B |
| ( HD ) |
| HOME DEPOT INC |
| Consumer Discretionary |
| 19.43 |
| 312.311B |
| ( CAT ) |
| CATERPILLAR INC |
| Industrials |
| 15.42 |
| 126.803B |
| ( AMGN ) |
| AMGEN INC |
| Health Care |
| 12.48 |
| 118.631B |
| ( GS ) |
| GOLDMAN SACHS GROUP INC |
| Financials |
| 10.88 |
| 107.228B |
| ( BA ) |
| BOEING CO |
| Industrials |
| -33.95 |
| 127.033B |
DIA's Stocks Pay More Dividends than VOO's Too
As was the case the last time I looked at the Dow Jones Industrial Average, most of its mature stocks pay dividends. Eight out of its top 10 stocks are dividend payers. Contrast this with the 3 stocks out of the S&P 500's top 10 that are.
DIA's annual dividend is currently reported by State Street Global Advisors, the company that offers it, as being 2.11%. This is 39% more than VOO's 1.52% dividend. Given that in lean times the dividend is often a major part of your profit from a company, this is not a trivial difference.
There is also a slightly better range of market capitalizations in the stocks that contribute most heavily to DIA's performance, compared to the valuations of VOO's top 5 stocks which all have market caps over $1.5 Trillion.
DIA is Surprisingly Liquid
Finally, when I went in to look at purchasing shares in DIA, I could see immediately why State Street promotes it as having extremely good liquidity. Its shares appear to trade more frequently than VOO. So though it charges a higher expense ratio, .15% compared to VOO's .03%, you don't have to worry about the spread.
All in all, though DIA's index is constructed on principals far less clear than the market cap weighted broad market funds that are usually recommended to investors. I am finding myself attracted to it. If nothing else, it is a simple way to hedge the possibility of a long, 2000's like, period of poor stock performance.
My Strategy For the Next Year Or Until A Significant Correction
After conducting my research, I've decided to alternate my regular monthly new ETF share purchases over the next year between DIA and VOO. I will be buying shares of DIA one month and of VOO the next.
That way, if, or should I say, when, we see another correction in the market, I will be able to tax loss harvest immediately from whichever ETF I did not invest in over the previous 30 days.
If we do go into another prolonged period of market decline followed by stagnation, which I believe to be a real possibility. DIA could very likely outperform again during a period when the extreme valuations of too many stocks in the S&P 500 revert to a mean.
If the market continues to rise, investing this way won't capture all the gains we could see from more exuberance in VOO's top Tech stocks, but it will begin to return my portfolio to a more balanced, value-tilted state.
For further details see:
Why I'm Buying DIA This Month Instead Of VOO