VOO - Why The Correction Could Get Worse
2023-08-08 11:38:01 ET
Summary
- The S&P 500 Index is experiencing its first meaningful pullback in months, with a potential 5-10% correction on the horizon.
- Rising interest rates impact the economy and could lead to a more significant slowdown in the coming months.
- Mortgage rates have surged, affecting new home buyers and consumer spending.
- The Fed needs a catalyst to pivot, leading the agency to adopt a more accessible monetary stance.
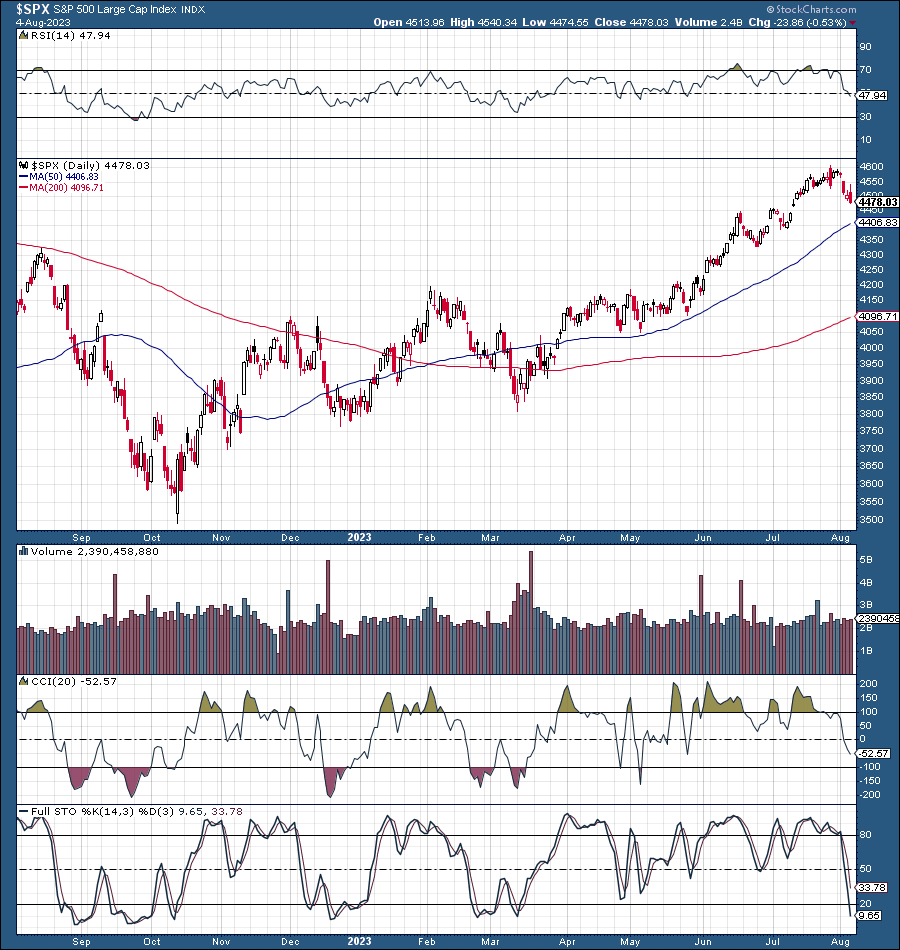
The S&P 500 Index ( SP500 , [[SPX]]) has been on fire, skyrocketing by 30% since the bear market ended last year. However, despite the fantastic returns, we haven't seen a meaningful correction all year. The SPX went through an 8% pullback in February and March. However, aside from this minor, temporary setback, the SPX has not had a pullback in months. Until now! And it could get worse. Despite my short-term negative view on SPX, I remain bullish, especially in the intermediate and long term.
SPX: 1-Year Chart
We discussed trimming specific positions and initiating specific hedges around the highs recently. Several days later, the market put in a blowoff top at about 4,600 SPX. While the fall in the SPX has been about 3%, there could be more downside in the near term.
The current pullback/rotation/consolidation phase could continue due to technical, fundamental, and psychological factors. Therefore, I am keeping my current SPX base-case target of a 5-10% correction, followed by a move higher toward the 4,800-5,000 target range in the second half of 2023.
A 5-10% pullback in the S&P 500 would reset the significant average to about the 4,400-4,200 range, leading to substantial short, intermediate, and long-term buying opportunities.
While the long-term technical image remains bullish, the SPX could use a shake-out soon. The 50-day MA is around 4,400, coinciding with higher-end support, and the 200-day MA is much lower, around the 4,100 level. Therefore, if we see more downside, it could be limited to the 4,300-4,200 (worse-case scenario) range.
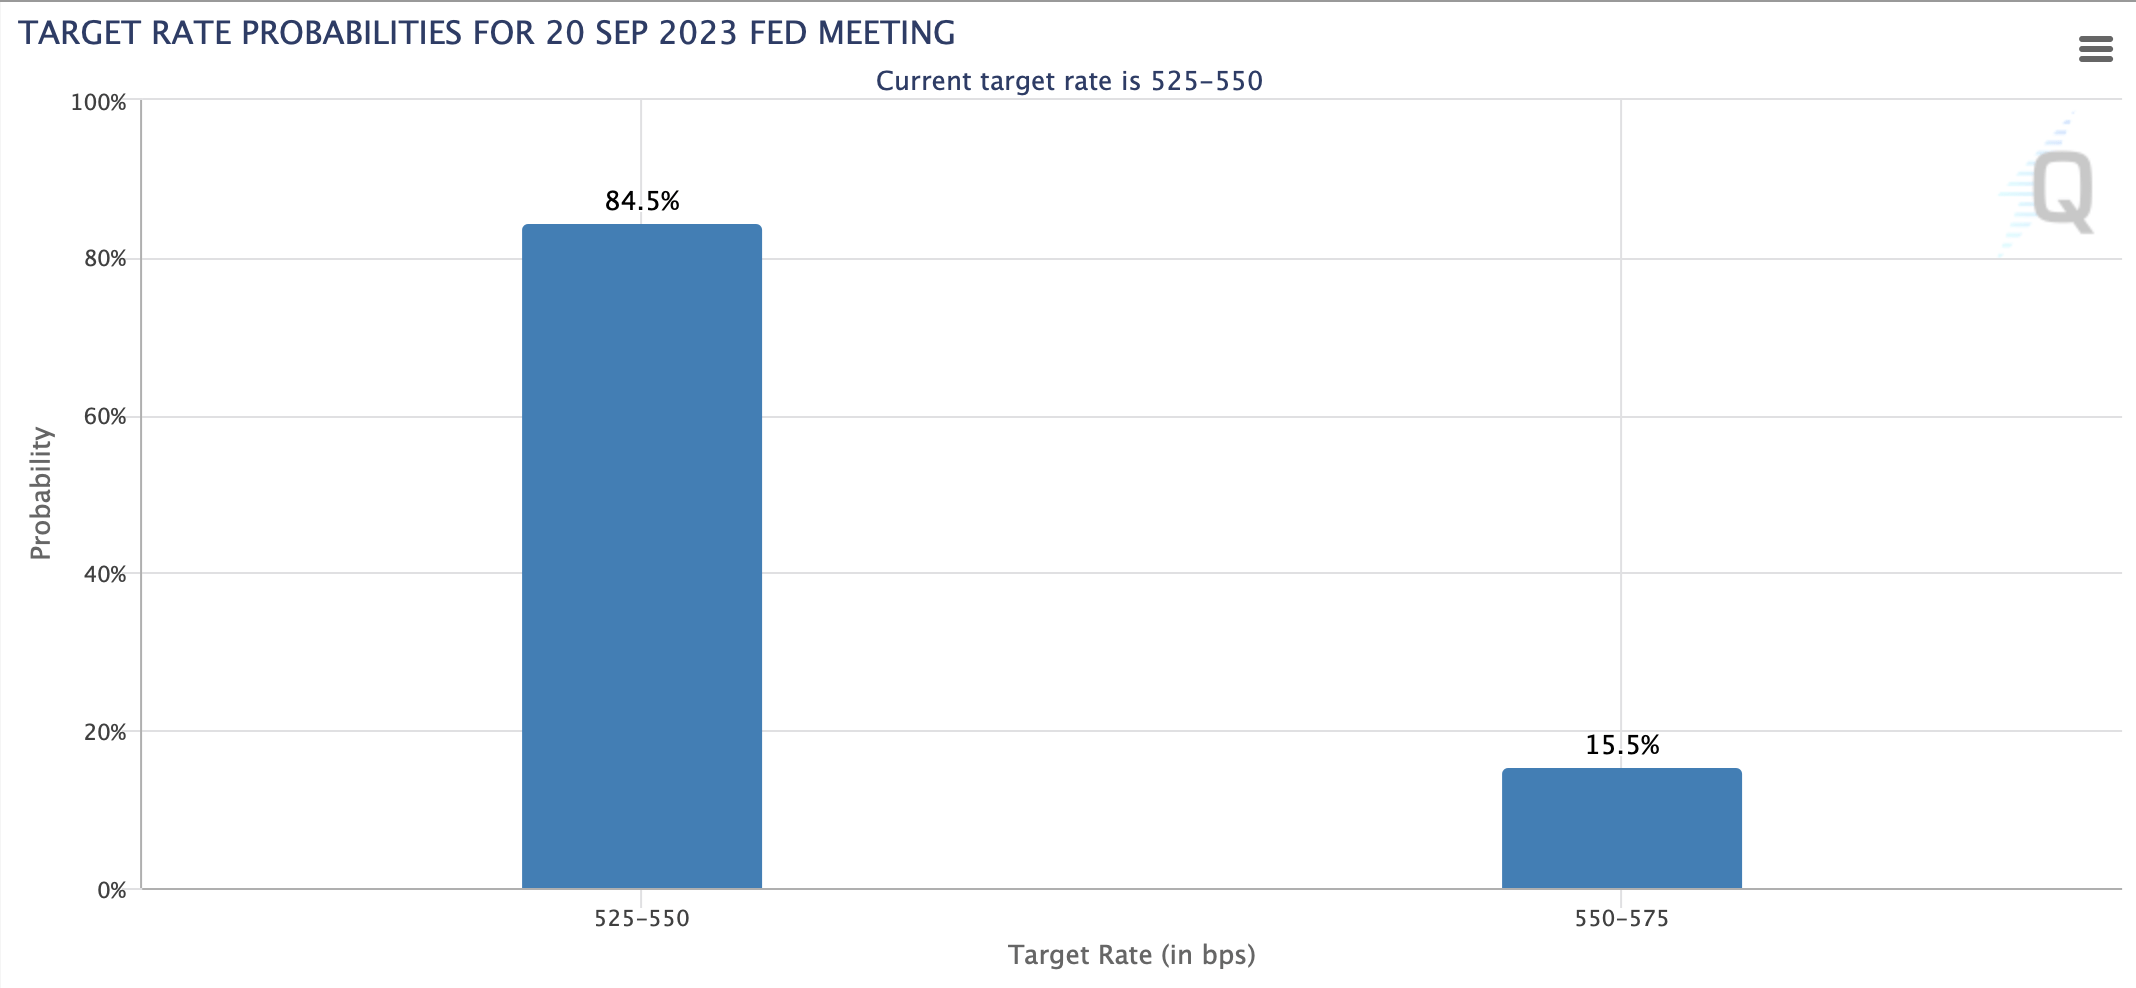
Interest Rates - May Be Too High Now
Benchmark rate (CMEGroup.com )
Currently, the target rate is 5.25-5.5% and may move up to 5.5-5.75% soon. Furthermore, the probability of more rate hikes could increase if the coming CPI report and other inflation gauges show stronger-than-expected rebounds in inflation for July. The economy could find it increasingly challenging to function efficiently and effectively with such high-interest rates. A more significant economic downturn becomes more probable if we continue with the current restrictive monetary policy.
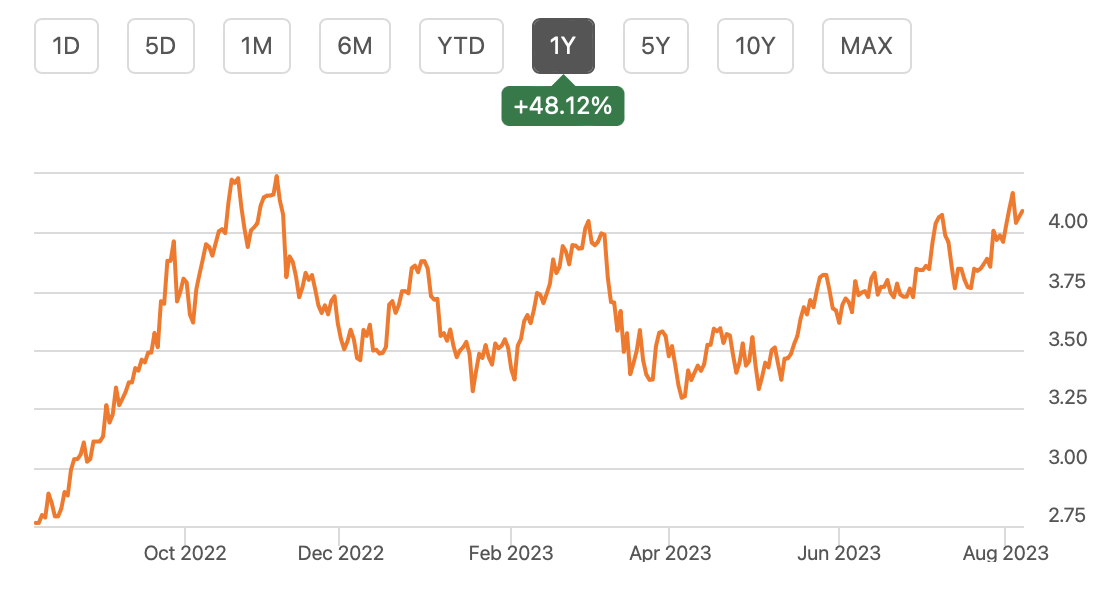
10-Year Treasury: Highest since 2007
The 10-year (US10Y) is above 4% and up by around 50% in one year. Also, the T-bill is around its highest level in 15 years. With the Fed's benchmark above 5%, interest rates all around us are moving higher. Therefore, the economy will continue struggling to produce growth. Additionally, higher bond yields incentivize investors to allocate higher portions of their holdings to bonds relative to costly stocks (arguably).
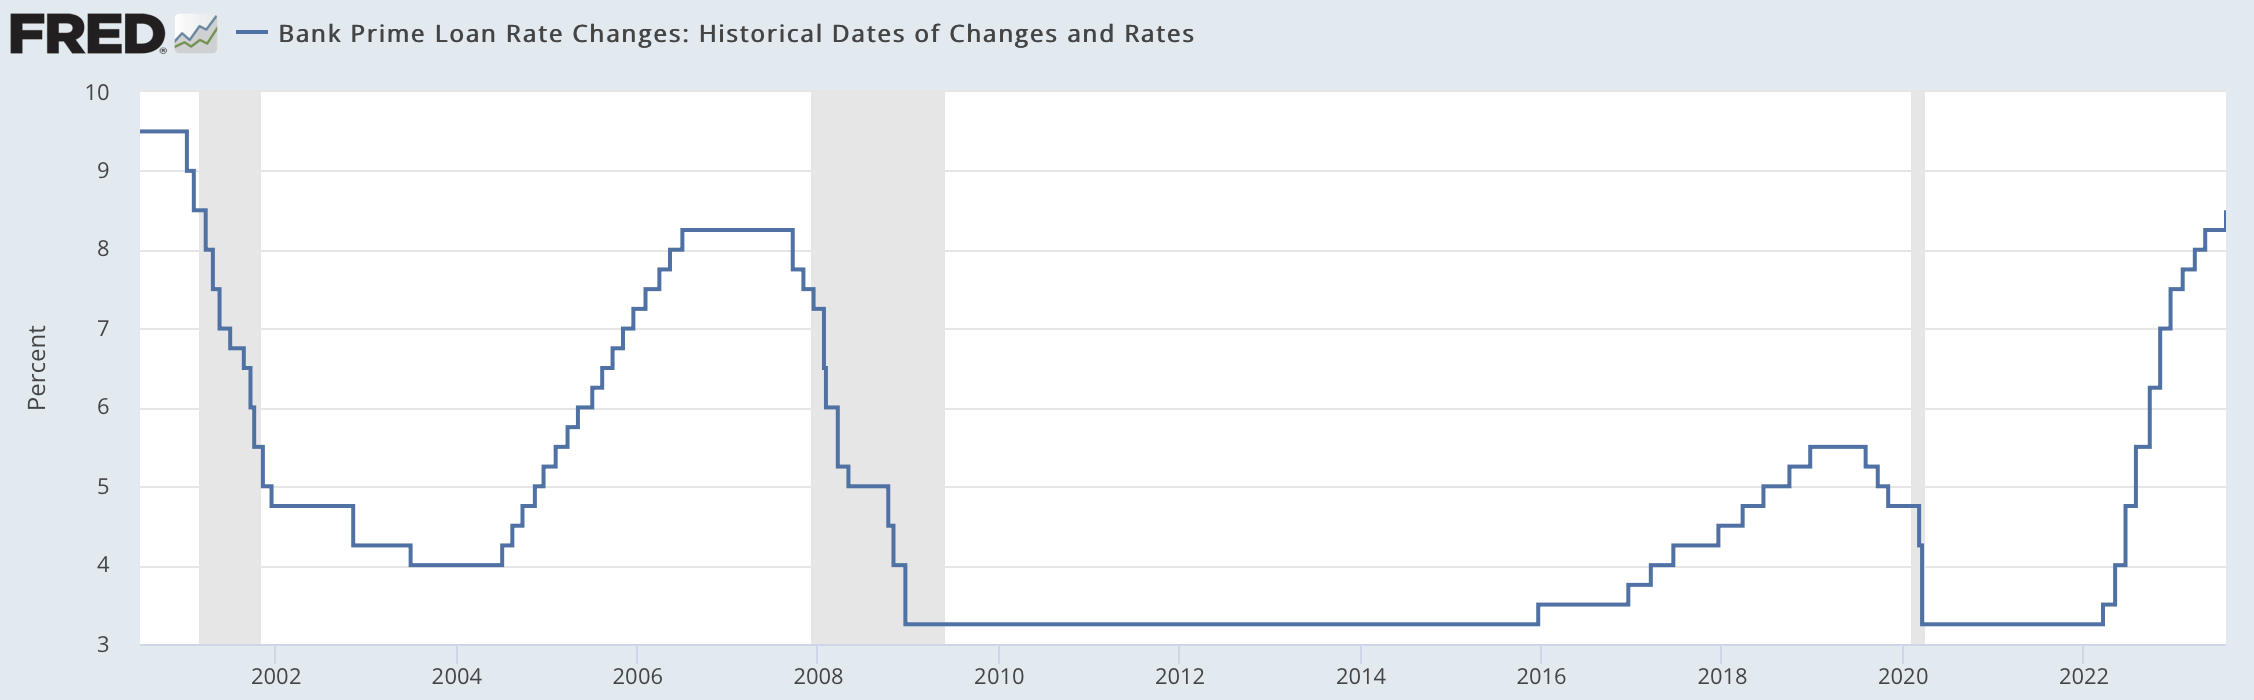
Bank Prime Lone Rate - Time to Slowdown
Prime rate (fred.stlouisfed.org)
The prime rate has surged from an ultra-low of 3.25% to 8.5% in slightly over a year. We have not seen the full repercussions of higher interest rates due to rates spiking so quickly. However, we have various interest rates (credit cards, auto loans, mortgages, etc.) moving higher. This dynamic has slowed the economy considerably in recent quarters, and we could see more slowdown effects ahead.
30-Year Mortgage Rate - Highest since the early 2000s
Mortgage rates have skyrocketed recently, surging from below 3% in 2021 to almost 7%. We're dealing with the highest mortgage rate since the early 2000s. This phenomenon illustrates several challenges. First, new home buyers are much less likely to buy a home with current rates. Second, the potential homebuyers won't be eligible for credit/loans associated with their home. Therefore, consumer spending/sentiment/confidence could continue suffering as we advance.
The Fed - Needs A Catalyst To Pivot
The market is very excited about a potential Fed pivot. However, the FOMC needs a catalyst before it pivots and begins cutting rates. Provided the Fed has a dual mandate, we need lower inflation, or the labor market must be in distress. While the labor market illustrates some challenges, the economy continues adding jobs, and the unemployment rate remains low. Also, a distressed labor market could lead to a substantial correction, potentially leading to an easier monetary stance from the Fed.
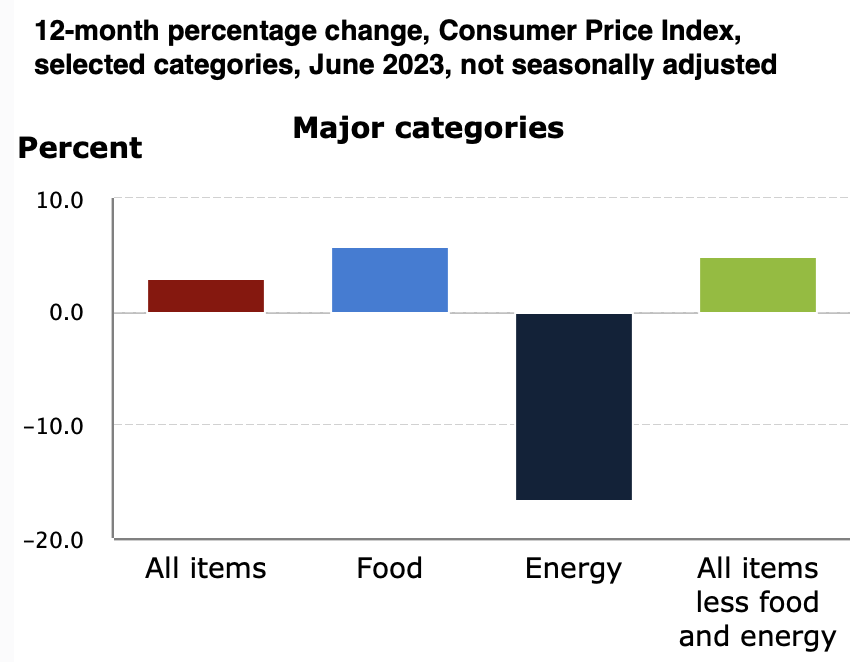
The CPI Data - Not As It Seems
While the CPI dropped to just 3% last month, food prices increased by nearly 6% YoY. Moreover, all items minus food and energy rose by almost 5%. Therefore, much of the drop in the CPI was due to lower oil/energy prices in recent months. Yet, oil prices have risen recently and likely have more upside ahead. Thus, the CPI and other inflation metrics could fluctuate instead of moving lower in the coming months.
This dynamic could reflect poorly on stocks, prompting the Fed to adopt a more accessible monetary stance. While we've seen considerable progress on the inflation front, the inflation rate still needs to be around the Fed's 2% target rate. Instead, inflation is highly persistent, and there's a risk of seeing a rebound in the months ahead. If inflation resurges, the probability of another interest rate hike should increase, leading to more volatility in the stock market due to the repricing of risk.
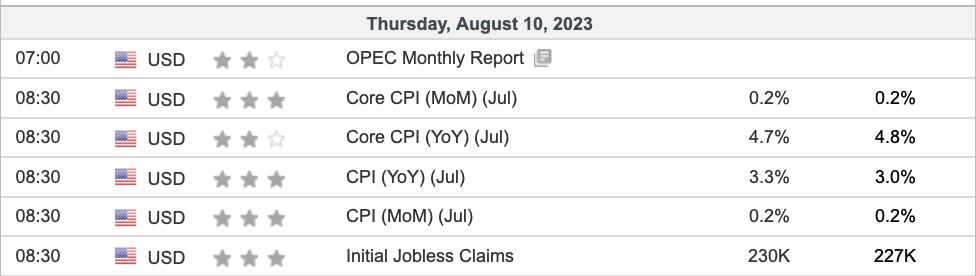
The CPI Report - Could Tank The Market
The market expects a rebound to 3.3% in July. However, we could see a CPI number above 3.3% due to higher oil and other prices. Anything above 3.5% may be disastrous concerning the Fed's battle on inflation. This dynamic would imply the Fed's plan needs adjusting, and a more stringent economic policy may be required to achieve the desired results on inflation. The market reaction could be swift, leading to significant selling pressure in the S&P 500 and many stocks.
What We Want - A Goldilocks Scenario
We want CPI inflation around 3% during Thursday's announcement. These results would imply the Fed's strategy is working and should continue working as we move on. Moreover, this outcome could signal that the economy does not need any more rate increases, and inflation could come down on its own.
Also, progress on inflation brings us closer to a pivot as the Fed looks forward to how it can stimulate the labor market and the economy to better growth next year and in the years ahead. This scenario could give us a relatively smooth path higher, potentially bringing the SPX to my 2023 year-end target range of 4,800-5,000. However, this outcome may require a more significant shakeout process and possibly some blood in the streets before moving ahead (SPX target add/buy-in range: 4,400-4,200).
For further details see:
Why The Correction Could Get Worse