SPYG - Why The Market Could Drop By Another 20%-25%
Summary
- We've seen one heck of a rally since the market reached an intermediate-term bottom in mid October.
- Incidentally, a textbook 20% bear market rally took the S&P 500 from 3,500 to 4,200 in about three months.
- However, I'm highly skeptical that the worst is behind us.
- Unfortunately, inflation remains more persistent than anticipated, the Fed should continue tightening, and the economy will likely worsen as we advance.
- Furthermore, stocks are not cheap, and my "all-in" bear market bottom target remains 3,000-3,200, roughly 20%-25% lower from here.
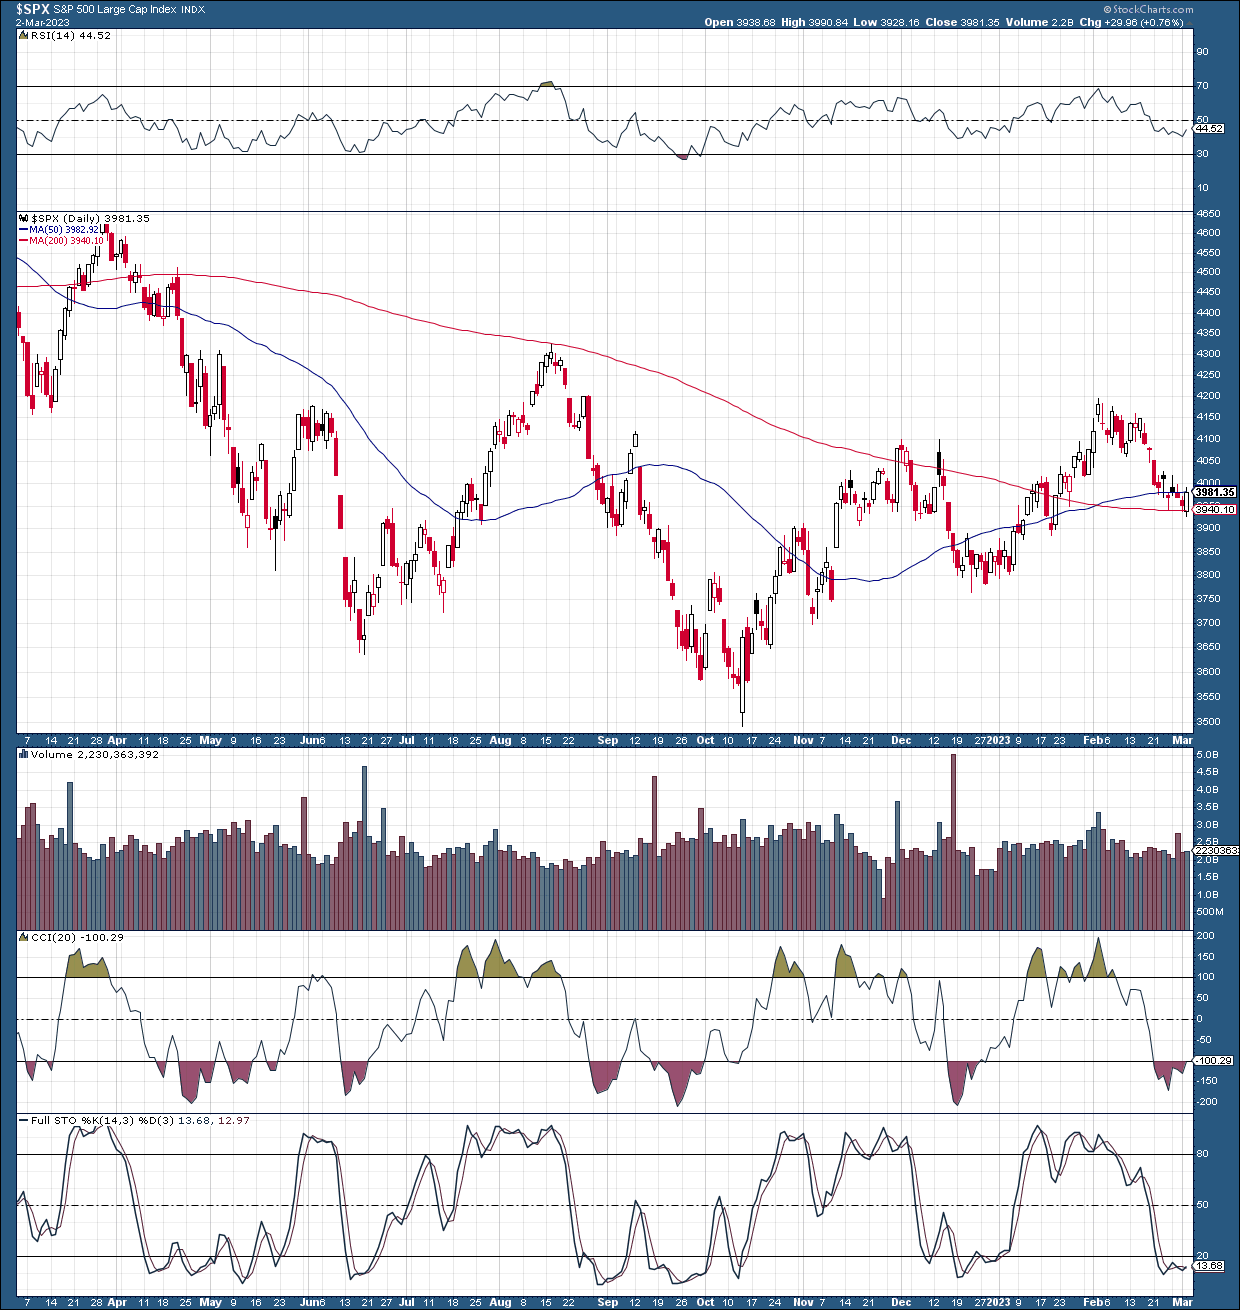
The S&P 500/SPX ( SP500 ) had an excellent rally from its mid-October bottom at 3,500. After calling the bottom in my " Stocks Are Heading Higher " article, I indicated that the likely top for the rally would arrive in the 4,000-4,200. The market recently topped out around 4,200, after a textbook 20% bear market rally. Now, the SPX is at another critical inflection point, and despite a 6% correction from the recent high, the market could go significantly lower as we advance in the coming months. In addition to deteriorating technical conditions, inflation remains persistent.
Moreover, we're seeing worsening economic indicators, implying that the increased rate environment reflects poorly on the economy. Furthermore, due to the persistent inflation problem, the Fed will probably continue raising the benchmark rate, remaining relatively hawkish. Consumer sentiment and other crucial consumer-related readings will likely worsen along with the labor market leading to more pain on Main Street. As corporate profits worsen in the near term, the stock market will probably head lower, causing some panic on Wall Street in the coming months.
SPX - At Another Inflection Point
The SPX is around critical support at 3,940 - 4,000, coinciding with the 50, and the 200-day moving averages. If the SPX decisively breaks down below this crucial support level, the market could swiftly drop to 3,800 support. If the 3,800 support breaks down, the market will likely retest 3,500 and move lower toward my long-term bear market bottom level at 3,000-3,200. This drop would equate to approximately 20-25% more downside from current levels. Unfortunately, due to the deteriorating fundamental factors surrounding the economy, there's a high probability that the SPX will revisit the 3,500 - 3,000 before achieving a true bottom. The peak-to-trough decline (4,800 to 3,000) would equate to a drop of approximately 38%, easily comparable to previous bear markets in recent history.
There's a Chance
Although the probability is relatively low, SPX's support could hold here, and we may see the market rebound and move higher. However, due to the challenging macroeconomic environment, the near-term upside is likely limited, and the path of least resistance is to the downside now. Also, it's premature to call an end to the bear market, and I am highly skeptical that a new bull market began in October and that the SPX will reach new highs soon.
Why Inflation Remains a Big Problem
CPI Inflation
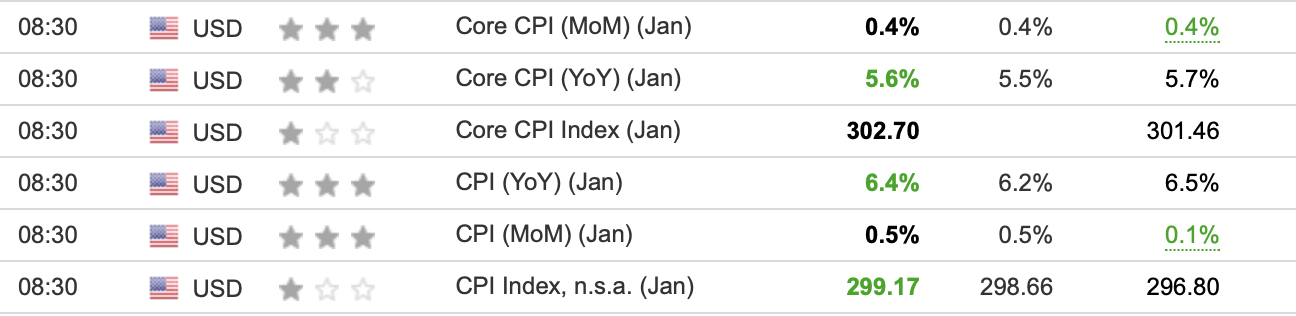
Inflation peaked at around 9% last year, and the Fed has raised rates significantly, utilizing other programs like QT to bring the inflation problem under control. There's been some success as inflation has come down from the ultra-high levels not seen in the last forty years . Nevertheless, inflation is still running red hot above 6%, while the Fed's target rate remains at 2%. Moreover, after several months of constructive inflation readings, January's CPI came in hotter than expected.
The Recent CPI Report
The market expected a drop to 6.2%, but the CPI came in at 6.4%, missing estimates and barely budging from the prior month's reading of 6.5%. Moreover, it's not just the CPI. Other critical inflation readings like the PCE also reversed, coming in hotter than anticipated.
PCE Inflation
The PCE inflation readings were substantially higher than expected. We see the PCE at 5.4% vs. the expected 5%. Moreover, the PCE was even higher than the previous month's 5.3% reading. So, inflation is moving in the wrong direction, and this trend of persistently higher-than-expected inflation could continue. Furthermore, the PCE reading is critical as it's the Fed's preferred inflation gauge. Therefore, we will likely continue seeing tighter monetary for longer, which is a negative development for stocks and other risk assets.
Is the Fed Doing Too Much or Not Enough?
Unfortunately, the Fed is between a rock and a hard place. Remember all that talk about inflation being a transitory phenomenon and everything should be fine? I remember this specific rhetoric as the Fed printed money like there was no tomorrow. I always expressed that inflation would not be as "transitory" as the Fed claimed and that the economy would suffer significantly. Well, here we are. The Fed is battling highly persistent inflation, anything but transitory, and the economy is worsening considerably.
The Worsening Economy
Have you seen the recent economic readings? I see many problems, and they're not likely to go away anytime soon. Let's put inflation aside and look at some troubling critical economic data that's come out recently.
Just from the start of February, we've seen ISM manufacturing PMI , factory orders, consumer expectations, industrial production, building, housing, GDP, consumer confidence, oil inventories, and other crucial data points come in worse than expected. Moreover, the worse-than-expected data is coming in below lowered estimates, and even most of the better-than-anticipated data does not look great.
Is the Labor Market an Exception?
The latest nonfarm payrolls report came in significantly better than expected. The economy added 517K jobs while expectations were for 185K. The unemployment rate also dropped to a rock bottom of 3.4%. So, how can the economy worsen while the labor market remains this robust? First, the labor market data is a lagging indicator, not indicative of future results. Secondly, the labor market appeared very strong in other cycles just before the worst part of a downturn began. And thirdly, the labor market may be one of the last dominoes standing, and when it falls, it could drag the stock market substantially lower. We've recently seen numerous companies reporting mass layoffs. These firings take time to filter through the system and should impact payroll reports negatively in the coming months. Moreover, not all jobs are the same. As major corporations cut hundreds of thousands of relatively high-paying jobs to improve efficiency and increase profitability, those fortunate enough to find new jobs will likely fill lower-paying positions. As this phenomenon persists, millions of consumers could suffer due to being pinched from multiple sides by high inflation and lower wages.
Valuations Are Not Cheap Anymore
We've seen many companies' earnings stagnate or decline in recent quarters. As the consumer continues to soften, lower earnings could continue as we advance in the near/intermediate term. Also, we've seen many stocks appreciate considerably in the recent rally. Thus, while many valuations appeared cheap and attractive, with the SPX around 3,500, many companies are not cheap anymore and could become even more expensive as earnings and future estimates stumble in the coming months.
Shiller P/E Ratio
We've seen the Shiller P/E (cyclically adjusted "CAPE") ratio come down some from the bubble days of November 2021. However, at around 29, the CAPE is still highly elevated, implying that most stocks are not cheap and likely have more room to fall as we grind through this bear market. The historical mean for the CAPE is 17, roughly 40% below its current level. If the CAPE reverts to its mean in this bear market, we could see the SPX bottom around 2,400. However, this ultra-bearish 50% peak-to-trough decline scenario is not a high-probability event due to the Fed and other factors. Nevertheless, the CAPE should move lower before going higher again, and my estimate for a bottom is around the 22-23 level, roughly in line with the 3,000-3,200 level in the SPX.
The Bottom Line
We've seen a textbook 20% bear market rally lift stocks from the profoundly oversold 3,500 level in the SPX. Many stocks have appreciated considerably, some by 100% or more in this relatively short time frame. However, the rally ended around 4,200 due to the lack of constructive catalysts capable of propelling stocks into a new bull market. Moreover, we see persistently high inflation, and the recent progress is overshadowed by the higher-than-anticipated inflation results last month. Therefore, the Fed will likely continue raising interest rates and could remain hawkish for longer as the inflation problem persists.
Moreover, critical economic indicators and many corporate profits continue worsening, implying more pain ahead for Main Street and Wall Street. Furthermore, most stocks are not cheap here. Thus, many could drop precipitously if the selling accelerates. If SPX breaks below support (decisively) around 4,000, it could cascade to 3,800 next and 3,500 or lower afterward. My bear market bottom "all-in" buy-in range remains around 3,000-3,200, roughly 20-25% below current levels.
For further details see:
Why The Market Could Drop By Another 20%-25%