COLL - With 30% Returns On Capital Deployed At 4.4x Earnings Collegium Is A Buy
2023-08-11 11:20:06 ET
Summary
- Collegium Pharmaceutical presents attractive value for investors with a forward earnings multiple of 4.5x and a 30% return on capital deployed.
- Q2 earnings indicate potential for momentum and a target price of $33/share in my view.
- The stock has shown technical breakouts and market data supports a bullish outlook.
- Net-net, reiterate buy.
Investment briefing
There is attractive value on risk capital to be unlocked in buying the equity stock of Collegium Pharmaceutical, Inc. ( COLL ) in my informed opinion.
The company is priced at 4.5x forward earnings producing 30% trailing returns on capital deployed. It is a capital-light compounder that throws off piles of cash to its shareholders, as evidenced here today. Based on the calculus presented in this report, the risk/reward symmetry is tilted in a bullish favour, in my view.
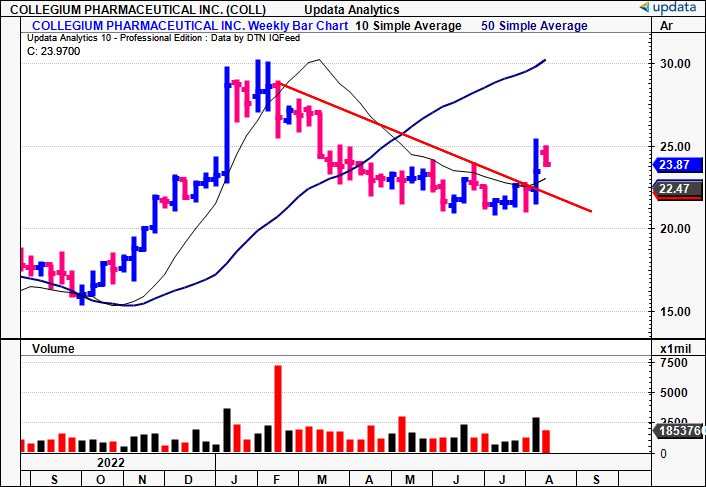
Following the company's Q2 earnings , it looks to build momentum throughout the remainder of FY'23 and could clip $33/share for investors over the coming periods should all go to fruition. I am bullish on COLL over the medium-term, noting the stock has pushed off a wide, tight base in the last 2-weeks, breaking out above long-term resistance [Figure 1]. Similar findings were outlined in my previous COLL analysis in May. It now trades above the 50DMA and is catching a bid at a respective mark above this. High volume buying last week also suggests large accounts are flooding into the company's equity stock. Net-net, reiterate buy at $33/share price objective.
Figure 1.
- Chart very constructive as mentioned in last publication. Breakout above long-term resistance after 8 weeks of relatively tight closes.
- Price line curling above 50DMA and closing above this mark as well last week. Looks to continue this trend.
- Volume dried up 7 weeks ago, now 5 weeks of ascending volume (heavy accumulation) with volume breakout above 10-week average. This is heavy volume buying, indicative of large accounts entering long.
Data: Updata
(1). Q2 financials telling on full-year expectations
Starting with the facts pattern of COLL's Q2 numbers. It did $135.5mm of business in the quarter, up 10% YoY. It missed the Street's estimates on this, but I'll run through the critical facts underlining the result a bit later. COLL pulled this to adj. EBITDA of $85.5mm, up 20% YoY, on earnings of $1.26/share.
Growth was clamped in Q2 relative to other periods given 1) relative seasonality and 2) Medicare coverage changes, in particular, the Medicare coverage twist known as the doughnut hole , and drug pricing reforms under the Inflation Reduction Act 2022 ("IRA"). The doughnut hole is tied to Medicare Part D coverage and limits what the Part D prescription plan will cover for drug costs.
The IRA legislature mandates that prices must be negotiated [between the Federal government and manufacturers] of specific labels that lack generic or bio-similar alternatives. The result equals a maximum "fair price" cap on these medications. In effect, it penalizes any price increases that exceed inflation. Noncompliance results in an excise tax, so there's no avoiding it. Additionally, the legislation establishes rules on rebate payments for manufacturers [under Medicare Parts B and D]. Typically, this is up to 75% of the cost. Finally, manufacturers' discounts on Part D drugs are revised under the legislation.
Hence the 10% growth for COLL was more or less expected and aligns with longer-term trends. For H2 FY'23, the company projects the sales ramp to restore at full pace.
Figure 2. Note Q2 typically behind trend, bar anomalies in Q4 FY'21 into FY'22.
Data: Author, COLL SEC Filings
Divisional Insights
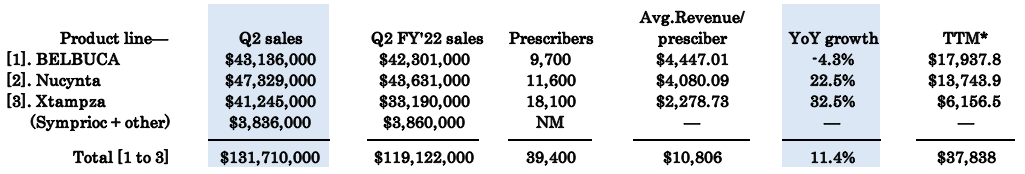
The divisional breakdown on COLL's top-line is as follows:
- BELBUCA sales came to $43.1mm, a modest 2% YoY. Prescription growth, integral to its unit economics, continues to ratchet higher. Total prescriptions grew 3.5% sequentially from Q1 FY'23.
- The Xtampza ER franchise pulled in $41.2mm in net revenue, a 24% spike on last year. It balanced its gross-to-net ratio ("G2N"), which clocked in at 63.5% for the quarter. Critically, looking ahead, COLL looks to fix G2N between 61%—63% for 2023. In my view this is good news given the IRA points raised earlier, because it is the G2N that is impacted most from the legislature.
- Nucynta revenues were up 8% to a $47.3mm clip. Management note Nucynta ER (ER= extended release) holds ~50% share of the ER corner of the pain relief market. The active ingredient, Tapentadol, is an opioid-based analgesic, has been formulated by COLL to act as an ER agent, offering a potentially differentiated mechanism of analgesia, hopefully reducing the risk of forming opioid dependence.
Key to the growth in segment unit economics is expanding the prescriber base for each product line. It added another 700 BELBUCA prescriptions over the year to ~9,700, and average revenue per prescriber is up to $4,447 in the segment, coming to $17,937 in the TTM. Meanwhile, Xtampza prescriptions maintained cadence at 18,700, 600 more over last year, and Nucynta ER prescriptions settled slightly lower off the c.13,000 in Q2 last year.
Critically, revenue per prescriber is up ~11.4% on aggregate YoY, despite a decrease from BELBUCA's contribution on the margin. This is especially true for Xtampza sales, that came in to ~$2,300/prescription. Notably, this falls roughly in line with the cap under the IRA to the doughnut hole [the cap is at $2,000; for more on this, see COLL's Q2 10-Q, pp. 54] , perhaps explaining the relative expansion vs. the other segments.
Figure 3.
Data: Author, COLL SEC Filings
(2). Capital deployment, returns on capital deployed
Management are eyeing $565mm—$580mm at the top line for FY'23, calling for ~25% growth in sales at the upper range. As of H1, it is 48.3% of the way there, meaning it should build momentum at the back end. It could pull $370mm—$435mm in adj. EBITDA on this after OpEx of $135—$145mm for the year.
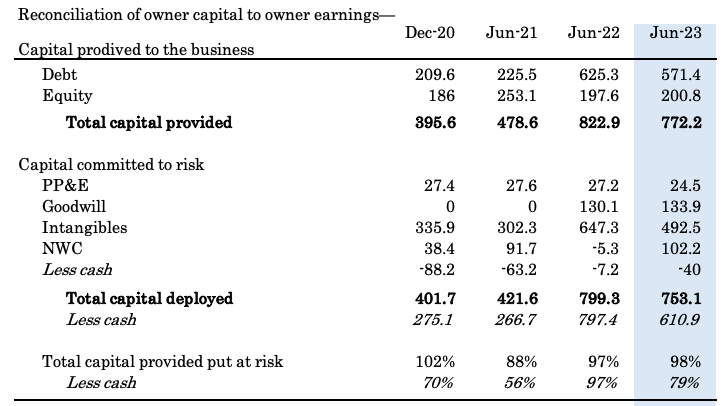
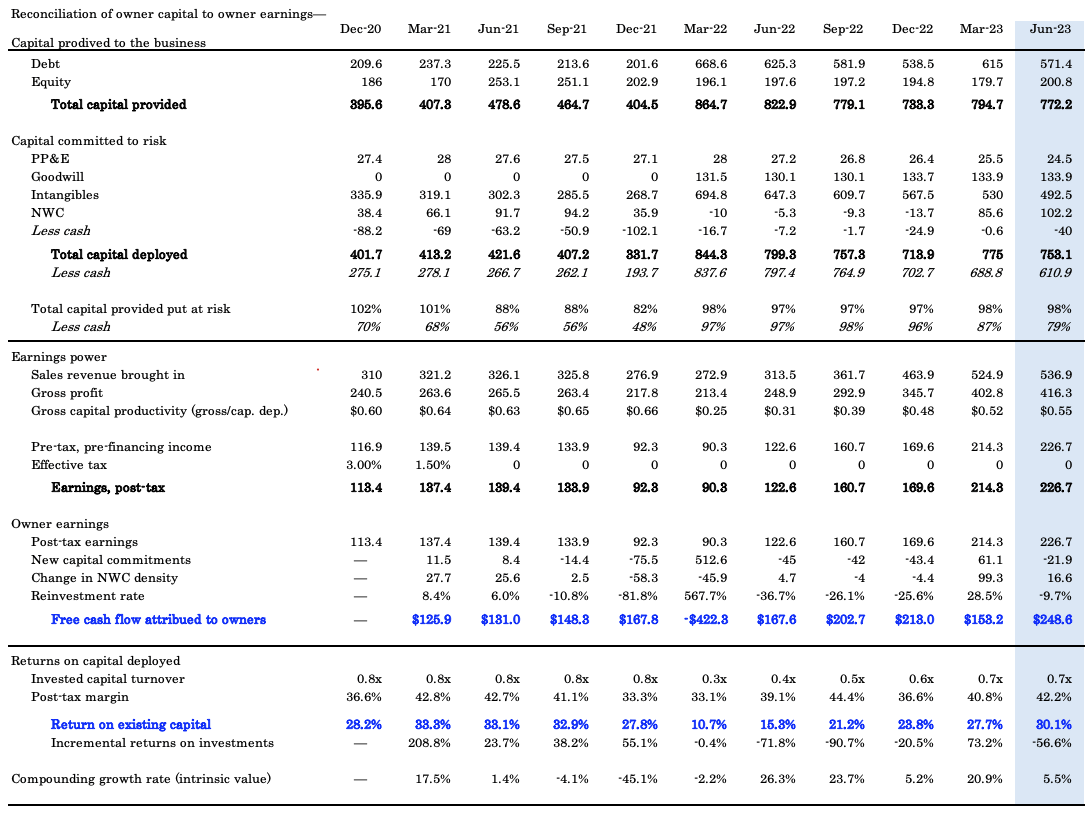
Critically, this bodes well for investors' capital tied up in COLL, on my assessment. The reconciliation of owner capital to owner earnings for COLL's shareholders is observed in Figure 4. It reconciles the capital provided to the business (debt, equity), the percentage of this committed at risk and deployed into the business, to the owner earnings and returns on business capital produced on this.
Of note:
- Around 98% of the total capital provided to the business has been deployed back into operations (79% stripping out cash) as of Q2 FY'23.
- It has put $351.3mm to work into growth operations since 2020, and now runs $753mm at the end of Q2 FY'23 (753.1—401.7 = $351.3).
Figure 4. Note: All figures in ' / %
Data: Author, COLL SEC Filings
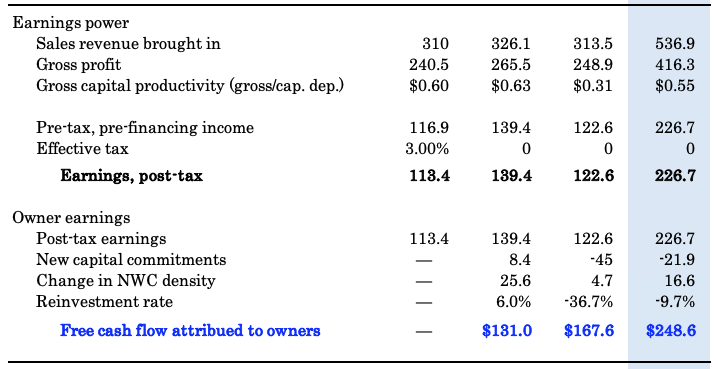
It printed $226.7mm in after-tax earnings in Q2 (TTM figures), up ~$104mm YoY, and an increase of $113.3mm since 2020 (also a TTM basis). By the way, TTM figures are used here to provide a 12-month-period look-back window, to make more statistically relevant inferences. Also, the $351.3mm in investment has produced an additional $113.3mm in earnings since 2020, a 32% incremental return on investment (113.3/351.3= 0.32).
The critical fact is that COLL, net of new capital commitments and changes in NWC density, spun off an additional $81mm in cash to its shareholders last period, throwing off $248.7mm in total over the TTM.
Figure 5. Note: All figures in ' / %
Data: Author, COLL SEC Filings
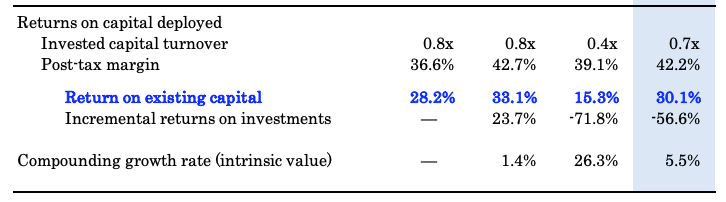
Most pleasing to the investor's eye, are the mouthwatering returns COLL is recycling back to shareholders from the cash it has deployed into the business. From FY'21—date, the trailing returns have pushed 15—30%, well above my required rate of return of ~12% (the long-term market return on capital). You can see the leverage is from the post-tax margin here vs. capital intensity benefits (42% margin, 0.7x capital turnover). This makes sense, given the company's source of income are on product sales, leveraging its IP and licensing.
Hence, the economic earnings generated on this—those profits above/below the hurdle rate—are tremendously attractive, evidencing the value COLL has created, and is creating for its equity holders moving forward.
Figure 6. Note: All figures in ' / %
Data: Author, COLL SEC Filings
Figure 7.
Data: Author, COLL SEC Filings
As such, COLL is compounding value at a rate well above market returns on capital, thus adding superb value for shareholders through gains in intrinsic value. Investors have accepted this and repriced its equity stock off lows of $16 last year.
These are tremendously attractive economic characteristics in my view, that are durable enough given the leverage COLL has over its capital base. That, and the fact it requires small increments of capital deployments to grow earnings, leaving plenty cash left over for shareholders at the end of the day. As such, it can focus on growing the business without jeopardising earnings growth, and vice-versa.
(3). Market generated data corroborative
The stock is showing several technical breakouts that currently support a buy in my opinion.
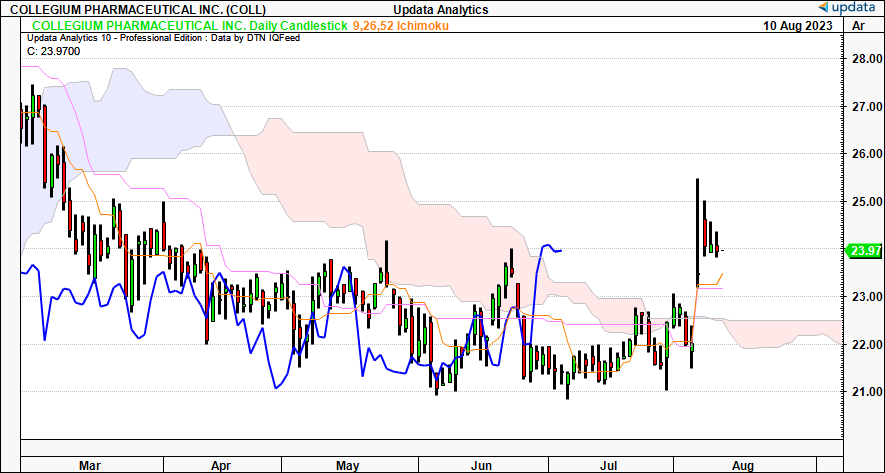
One, on the daily cloud chart, the price line and lagging line have nudged through the cloud top and are in bullish territory. The rapid break last week saw a clear reversal off a wide, tight base with two surges of demand leading into, and then out of earnings. Support is at $22.50 until end of August in my view, and with further upside, this looks like a tasty setup.
Figure 8.
Data: Updata
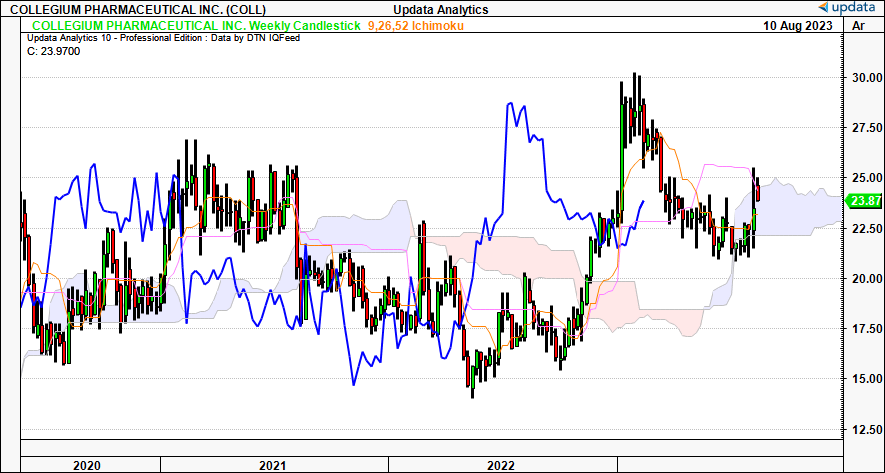
On the weekly chart, that looks to the coming weeks, we've got similar price action. Critically, the lagging line has been bullish all year, a testament to taking a long-term view. The price line is testing the cloud top and looks to break higher. Should it do so, support would be at $24 until next year in my view. A break below $22 would be bad news for the long-term based on these technicals.
Figure 9.
Data: Updata
Confluence is observed on the point and figure studies below, that provide objective findings based on market trends and pricing data. We've got upsides to $28.75 on this based on the 60-minute chart that looks to the coming days, maybe next few weeks. A break higher would send us to this price objective, a break lower and we'd be looking to $21.75 in my view. However, the symmetry is tilted to the upside in terms of probabilities here in my view.
Figure 10.
Data: Updata
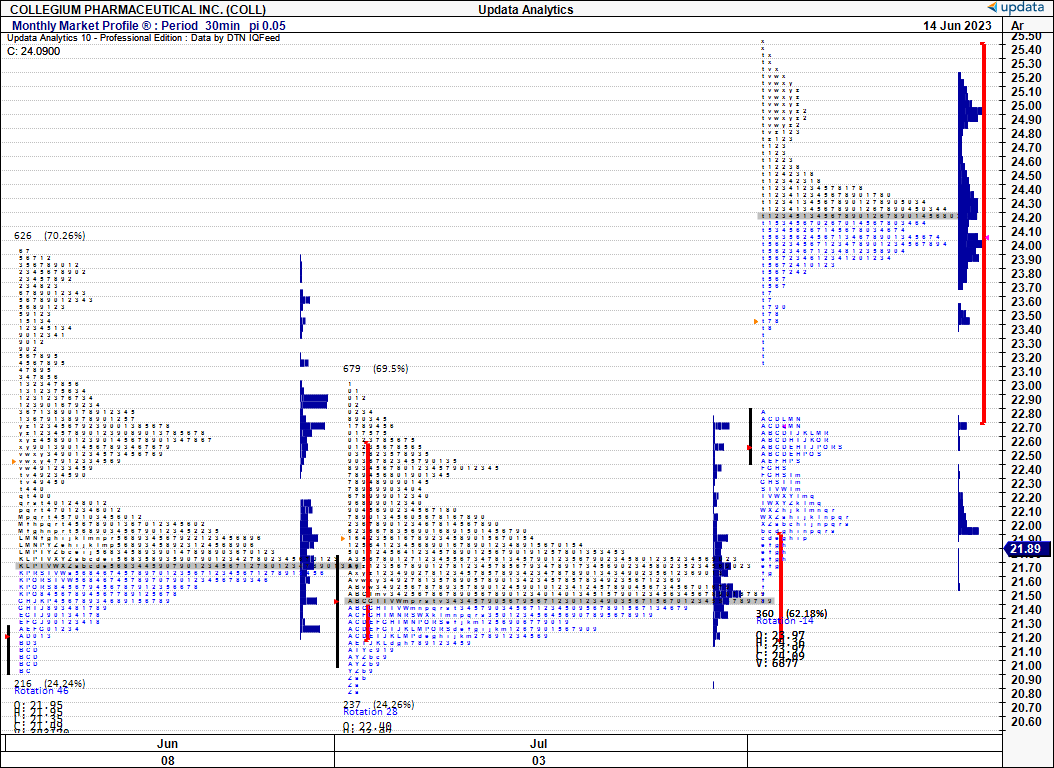
Finally, market profile data is equally supportive on examination. You have below [Figure 11] 3-months worth of market profile below, that shows the duration of time spent at each price, the volume of activity at each mark, and where orders landed throughout the month.
Figure 11.
Data: Updata
The point to note is that markets typically move from areas of high usage to low usage (i.e., in cycles). Taking this principle into the market profile, we can stack the 3 months of market activity onto each other to gauge where the market's being filled for COLL. You can see the bulk of activity in the $21—$23 range, where the break to $24 or so has occurred. My estimates show the low-usage areas up around this mark, and so there's propensity to fill these zones moving forward. The histogram is already forming a relatively normal distribution at this point, adding to the scope of a higher break in my view.
Figure 12.
Data: Updata
Valuation
Two factors on valuation that must be considered here.
One is that you're buying COLL at just 4.5x forward earnings as I write, otherwise, 3.5x reported forward EBITDA. In spite of this, the company has produced $4 in net asset value for every $1 in market value for its equity holders, superb value-add as discussed already (trades at 4x book value). This tells me that you've got a company whose net assets are valued very highly by the market, but is generating excellent profitability for its current market value. I smell a mispricing.
Two, based on the valuation calculus provided in Figure 6 [see: Compounding growth rate, intrinsic valuation), you can see the implied value line versus COLL's market values over the last 2.5 years below. Several things are apparent:
- The stock gapped from its implied fair value across 2022, before reverting back to this mark by the end of FY'22 and rolling into FY'23.
- Investors have paid close attention to the company's capital productivity and look to have priced the equity along these lines.
- Given what we saw macro-wise last year, I'm not surprised to see the dislocation over 2022. This is a further testament to retaining a long-term view, and thoughtful analysis of the future.
Figure 13.
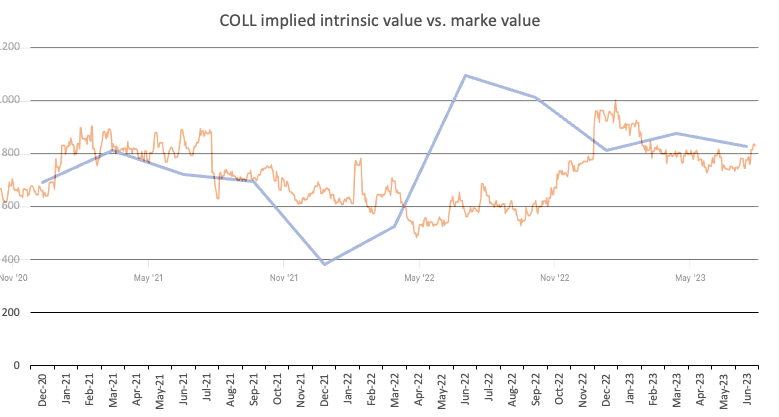
Note: Market cap line is superimposed over implied value line, and retrieved from Seeking Alpha. Hence the slightly blurred image. (Data: Author, Seeking Alpha. )
Question is, what does this mean going forward. My best-case estimates into FY'24 put the company's intrinsic value at >$1.5Bn, and in the more conservative, realistic case, at $1.15Bn by this time in FY'24. You're getting to ~38% potential capital appreciation at these estimates to $33/share. To get there I'd see COLL pushing post tax-margins of ~42% on annual revenues of $600—$650mm, with 0.7x capital turnover, giving c.30% return on capital both years, in line with historical averages.
Figure 14.
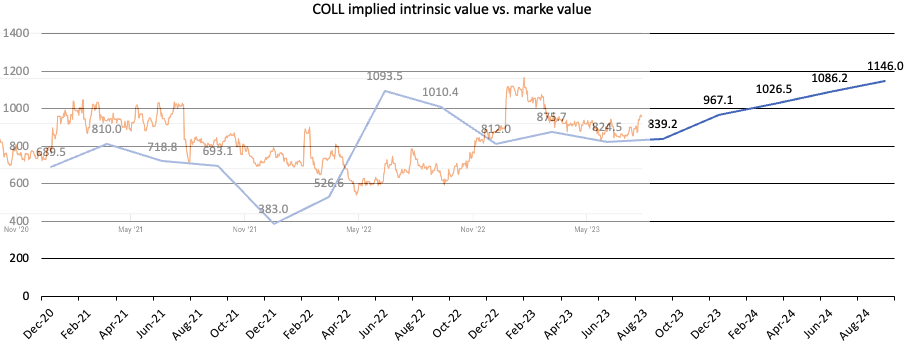
Note: Market cap line is superimposed over implied value line, and retrieved from Seeking Alpha. Hence the slightly blurred image. (Data: Author, Seeking Alpha. )
In short
Net-net, there is sufficient evidence to suggest that COLL can continue compounding its intrinsic valuation to benefit its equity holders. The firm presents with superb economic characteristics that result in it throwing off piles of cash to shareholders, albeit with small incremental capital growth requirements. This is the kind of business I want to be in, especially with projected values of $1.15Bn/$33 per share on my forward estimates, otherwise c.38% potential investment return. This supports a buy rating in my opinion. Reiterate buy.
Risks to investment thesis
Before proceeding, investors must recognize the following risks to the investment thesis:
- Opioid-based medications face regulatory scrutiny and are likely to be phased out for less 'high-risk' alternatives. Should this happen at a faster rate than expected, this could hamper the economics outlined here.
- We shouldn't ignore the macro-level risks either, in that risk assets are at the helm of the inflation/rates axis, with a higher cost of capital weeding out overpriced equities in particular. This could impact the valuation numbers outlined.
- Prescribers could favour substitutes for COLL's offerings, especially with the IRA legislature and Medicare Doughnut hole capping coverage for key customer groups.
- A broad selloff in global equities should also be considered in the investment debate here and what impact this could have to COLL's market values.
Investors must realize these risks in full before proceeding.
Appendix 1. Note: All figures in ' / %
Data: Author
Appendix 2. Note: All figures in ' / %
Data: Author
For further details see:
With 30% Returns On Capital Deployed At 4.4x Earnings, Collegium Is A Buy