XBI - XBI: A Pure Play Biotech ETF In Need Of A Hedge
2023-05-18 03:36:47 ET
Summary
- Several ETFs exist offering investors concentrated biotech exposure that varies in stock selection and weighting schemes.
- While all of the choices exhibit 90%+ exposure to biotech stocks, only XBI is a true pure-play at nearly 100%.
- The low relative risk-adjusted performance and highly available options market make XBI an ideal choice for a risk-reducing hedge strategy.
The biotech industry is marked by high risk and high reward with company outcomes largely dependent on the success of breakthrough drugs and therapies. This magnifies single-stock risk which can be reduced by holding an ETF. This article covers several choices for prospective investors to gain concentrated biotech sector exposure and includes a hedged trade idea at the end.
ETF Overview
iShares Biotechnology ETF ( IBB ) is the largest of the bunch with over $8 billion in assets. It seeks to track the ICE Biotechnology Index and uses market cap for stock selection along with a tiered weighting scheme. The five largest holdings are capped at 8% and the rest are capped at 4%. Despite attempts to limit the weighting of any single holding, IBB carries the highest concentration in its top 10 at 54% and tilts heavily toward large-cap stocks. It also carries the broadest level of international exposure and allocates more than 20% outside of biotechnology, mainly to life sciences companies. The expense ratio is average at 0.44% and the fund has great liquidity. Given the tiered weighting scheme, the top spot is technically shared by five stocks. They include Vertex Pharmaceuticals ( VRTX ), Amgen ( AMGN ), Gilead ( GILD ), Regeneron (REGN), and Biogen ( BIIB ).
IBB Top 10 (Michael Thomas)
SPDR S&P Biotech ETF ( XBI ) is the second largest on the list with assets exceeding $6 billion and is the only pure-play biotechnology fund on the list. It seeks to track the S&P Biotechnology Select Industry Index and uses market cap for stock selection. However, it differs greatly from IBB in weighting methodology with an equal weighting scheme. This significantly reduces the top 10 holding concentration to 11%, which is the lowest on the list by a good margin. It also flips tilting toward small-cap stocks. XBI is 100% focused on US companies. This isn't a huge deal in the space since even those ETFs with international exposure still consist of 90%+ US companies. The 0.35% expense ratio is the lowest on the list and XBI is by far the most liquid. Top holdings are somewhat irrelevant given the equal-weighted nature of the fund but are included for completeness.
XBI Top 10 (Michael Thomas)
First Trust NYSE Arca Biotechnology Index Fund ETF ( FBT ) is another equal-weighted fund that uses market cap for stock selection. It seeks to track the NYSE Arca Biotechnology index and differs from XBI with a 20% allocation to life sciences companies, which has proved beneficial to performance. The top 10 concentration is much higher than XBI at 38% given it only has 30 holdings compared to XBI's 140+ holdings. Expense ratio and liquidity are average for the group. Again, top 10 holdings aren't that important with equal weighting.
FBT Top 10 (Michael Thomas)
ALPS Medical Breakthroughs ETF ( SBIO ) goes with market cap weighting but only focuses on companies that have drugs in Phase II or III clinical trials with enough cash on hand to last a couple of years. It seeks to track the S-Network Medical Breakthroughs Index. The top holding is capped at 4.5% and potential index constituents are limited in market cap to between $200 million and $5 billion, thereby eliminating any large-cap exposure. This leads to higher risk-reward as many smaller companies may be solely dependent on the success of a single drug for profitability. The 0.50% expense ratio runs about average and liquidity is adequate. Prometheus Biosciences ( RXDX ) is the top holding at over 5%.
SBIO Top 10 (Michael Thomas)
Invesco Dynamic Biotechnology & Genome ETF ( PBE ) has some $250 million in assets and uses a multi-factor selection scheme to track the Dynamic Biotechnology & Genome Intellidex Index consisting of 30 stocks. Potential index constituents are evaluated based on price and earnings momentum, quality, management action, and value to produce Model Scores. For weighting, two separate groups are formed with one containing relatively larger companies and the other smaller. The larger group gets eight of the highest Model Scored larger stocks and a portfolio allocation of 40%. The smaller group gets 22 of the smaller stocks and a portfolio allocation of 60%. Larger stock weights are targeted at 5% and smaller stocks at 2.73%. This doesn't do much for top 10 concentration, with PBE having the 2nd highest at 47%. It does do a good job at distributing holdings roughly equally between large, mid, and small-cap companies. The expense ratio is a bit high at 0.59% but may be justified based on long-term performance. Vertex holds the top spot at ~6%, followed by Biogen, Regeneron, Amgen, and Gilead.
PBE Top 10 (Michael Thomas)
Virtus LifeSci Biotech Products ETF ( BBP ) is the smallest fund on the list with $18 million in assets and seeks to track the LifeSci Biotechnology Products Index. The index targets companies with at least one lead drug approved by the FDA. Selected holdings are equally weighted, keeping top 10 concentration relatively low at 28%. This fund carries the highest expense ratio at 0.79% but short and mid-term performance may justify the high cost. Liquidity isn't the best but should be sufficient for most retail investors.
BBP Top 10 (Michael Thomas)
ETF Comparison
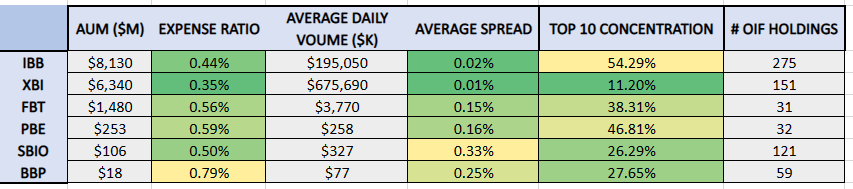
The following table highlights much of the high-level information discussed for each ETF. XBI wins on expense ratio, liquidity, and top-10 concentration.
ETF High Level Comparison (Michael Thomas)
The next chart shows the market cap breakdown of constituents for each ETF. IBB has the heaviest tilt toward large-cap companies, FBT toward mid-caps, and SBIO toward small-caps. The weighting scheme employed by PBE achieves a balanced cap distribution.
ETF Market Cap Breakdown (Michael Thomas)
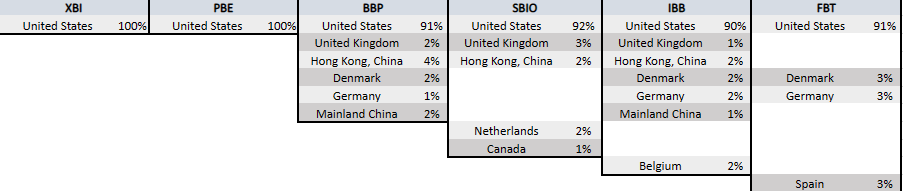
The next graphic shows variation in country exposures by ETF. The US is well represented in all funds with at least 90%+ with no other country garnering more than 3-4%.
ETF Country Exposure (Michael Thomas)
Historical Performance
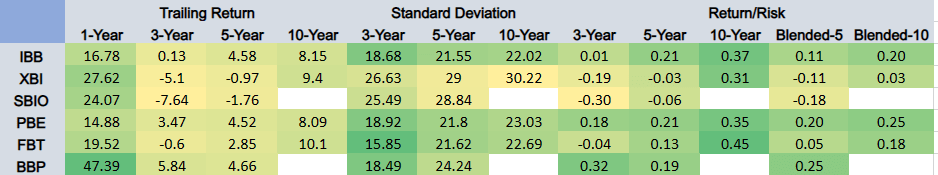
The following table presents return and risk data sourced from Morningstar. Trailing return and standard deviation are included for multiple periods and used to calculate risk-adjusted return in the form of return per unit of risk. Timeframes are then blended (averaged) to smooth out data.
Biotech ETF Performance (Michael Thomas)
The best absolute performance achieved over the long term is FBT with 10%+ annualized returns. Once you factor in risk, PBE takes over with the best long-term blended return/risk ratio of 0.25, lending support for its multi-factor selection scheme. XBI shows the lowest risk-adjusted performance in both 5-year and 10-year blended periods. It still has impressive long-term absolute returns of over 9% but could benefit from employing a risk-reducing strategy. BBP is getting it done in mid-term performance, largely bolstered by an impressive 1-year return of over 47%.
Options Considerations
Many investors utilize options for either leverage or hedging and as such it's good to know what your "options on options" are for an ETF. The following table shows the options available for the funds discussed and a gauge of breadth with the inclusion of weeklies and LEAPS.
Biotech ETF Options Market (Michael Thomas)
IBB and XBI are both excellent choices for those wishing to employ an options-based strategy around their base ETF holding. In particular, the availability of LEAPS offers a hedging strategy well suited for the higher-risk nature of biotech ETFs.
Hedged Trade Opportunity
I've been employing a LEAPS-based hedging strategy for several months and unveiled my portfolio and methodology in a prior article that interested readers can review for background. In a nutshell, the longest-dated LEAPS options are used to create a zero-cost hedge by selling a covered call and using the proceeds to pay for a bear put spread. This encapsulates an underlying ETF position in a buffered loss and maximum profit band.
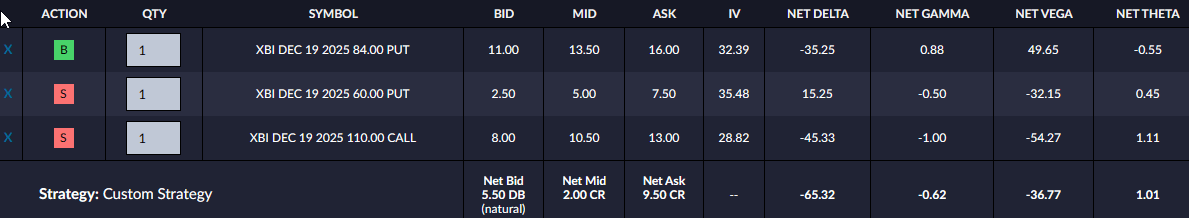
With the highest standard deviation, XBI stands to benefit the most by employing a risk-reducing hedge strategy with LEAPS. For example, XBI was trading at around $84 at the time of writing. Owning 100 shares allows for selling a Dec 19, 2025 115C covered call and simultaneously buying a Dec 19, 2025 84P/60P bear put spread. Your mileage may vary but the order should be executed for at least a small credit.
Example XBI LEAPS Order (Michael Thomas)
This setup caps the maximum return from price appreciation at 36.9%, or roughly 12.9% annualized return over the next ~2.6 years. Taking advantage of rolling opportunities in short options could add another 1% annualized to bring the total to 13.9%. In return, the put spread covers the first 28.5% of losses. This compares favorably to the 9.4% annualized return XBI has had over the last 10 years. Of course, these funds can be volatile and can achieve many multiples of these returns in any given year. That is the opportunity cost associated with the LEAPS hedge. However, the multi-year timeframe associated with LEAPS gives a better chance of staying closer to the long-term average of returns.
A Real Life Ongoing Hedge
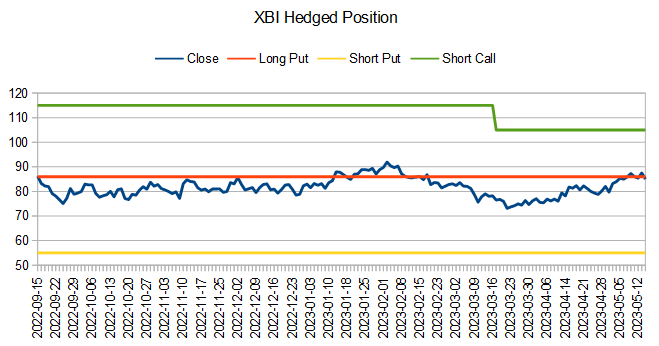
To better illustrate how the LEAPS hedge works, I present a real-life ongoing position I opened using XBI and Jan 17, 2025, expiration LEAPS options. The position was opened on 9/15/2022 by buying 100 shares of XBI at $86.63, selling a 115C covered call, and buying an 86P/55P put spread. The following chart shows the components of the trade. The red line represents the start of the loss buffer zone and the yellow line represents the extent to which losses are covered. The green line represents the maximum price appreciation.
XBI Hedged Position (Michael Thomas)
In mid-March, the 115C call was rolled down to the 105C strike in response to changes in the underlying price and implied volatility for a net credit of $189. This lowered the potential profit for the position which currently stands at 9.75% annualized through Jan 17, 2025. Short options will continue to be rolled in response to future price and volatility changes, contributing to more net premium gains.
Takeaway
While XBI may not be the best choice for a standalone biotech ETF holding, it does offer a major advantage in the flexibility offered by its substantial options market. The higher volatility suits a long-term hedged strategy well and even though opportunity costs could be high in a given period, the ETF itself is a great vehicle for potential double-digit returns with 28.5% downside protection.
For further details see:
XBI: A Pure Play Biotech ETF In Need Of A Hedge