RBCPF - XEI:CA No Options No Leverage Just High Yield
Summary
- XEI:CA holds a portfolio of 75 high-yielding TSX-listed stocks with above average yields.
- This fund does not employ leverage or use a covered call strategy that has the potential to limit capital appreciation in bull markets.
- At 4.5%, this fund has a higher yield than comparable U.S. and global equity dividend ETFs.
- The underlying holdings offer considerable dividend safety, with only 2 out of the top twenty holdings experiencing in a dividend cut in the last 10 years.
- XEI:CA's top twenty holdings have an average dividend growth streak of over 11 years and a forward yield of over 5%, indicating potential for continued dividend growth.
Investment Profile
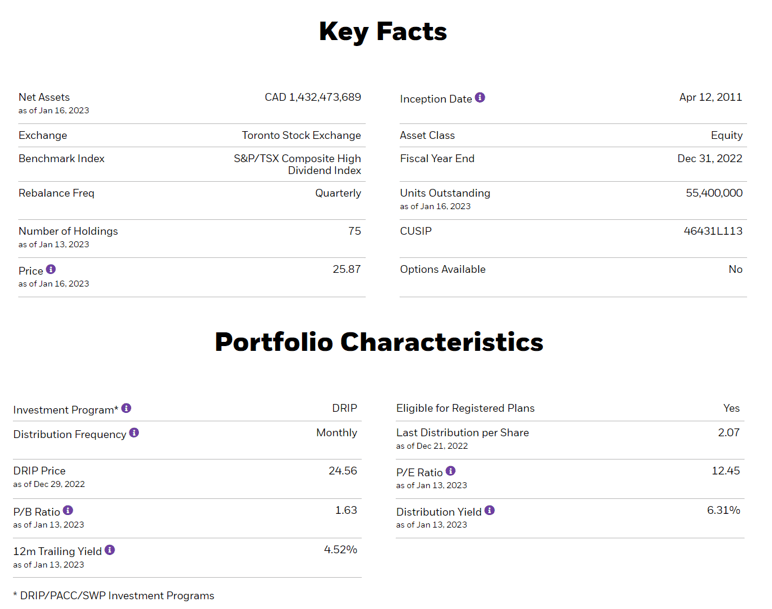
The iShares S&P/TSX Composite High Dividend Index ETF (XEI:CA) is an all equity fund comprised of 75 dividend paying Canadian stocks. Since its inception in 2011, the fund has attracted $1.4B in investment. XEI:CA targets long-term capital growth by replicating the performance of the S&P/TSX Composite High Dividend Index. With a current dividend yield of 4.52%, the fund is also designed as a vehicle for steady dividend income. XEI:CA has a management expense ratio of 0.22% and a risk rating of medium.
XEI:CA Portfolio Data (iShares)
Source: iShares
Attractive Valuation
XEI:CA has a P/E ratio of 12.52 and a P/B ratio of 1.64. This compares favourably to the iShares Core High Dividend ETF ( HDV ) with a P/E ratio of 16.53 and a P/B ratio of 3.26. Relative to HDV's U.S. portfolio with a TTM yield of 3.27%, XEI:CA is attractive with a TTM yield of 4.52%. Although not as attractively valued as the Vanguard International High Dividend Yield ETF ( VYMI ) trading at 8.4X earnings and 1.2X book value, XEI:CA has a slightly higher yield.
S&P/TSX Composite High Dividend Index
The index provider, S&P Dow Jones Indices selects between 50-75 stocks from the S&P/TSX Composite to be included in the index. To be included, S&P Dow Jones Indices determines the median annual dividend yield of all dividend paying stocks in the S&P/TSX Composite Index. The 75 stocks with the largest indicated annual dividend yield, from those stocks which have annual yields above the median are selected to form the index. To be clear, these constituents are not the highest yielding stocks on the TSX, they are the stocks with above-average yields. Interestingly, there is no specific market cap threshold (other than being a constituent of the S&P/TSX Composite) required, nor is dividend history considered in forming the index.
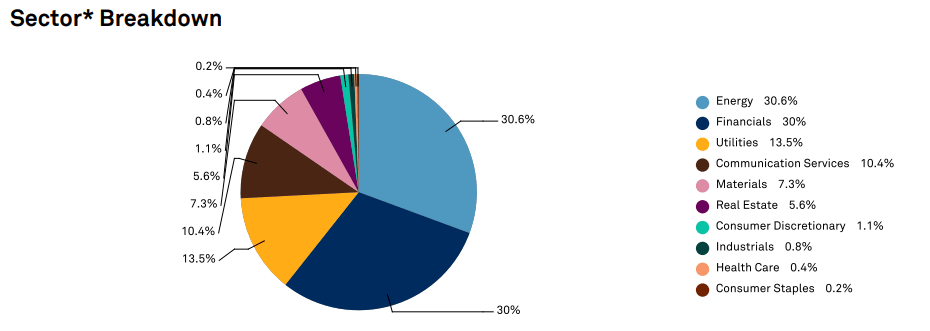
To ensure diversification, individual stocks are capped at a 5% weight, while each sector is capped at 30% weight and rebalanced quarterly.
Sector Breakdown (S&P Dow Jones Indices)
Source: S&P Dow Jones Indices
Compared to the larger S&P/TSX Composite, there is a heavier weighting towards energy and utilities stocks with a lower concentration of industrials and materials.
Distributions
XEI:CA does not use leverage or options to enhance its yield. There are a number of high-yielding ETFs that achieve poor total returns due to the employment of various strategies to boost yield. For example covered call strategies can limit upside on capital appreciation in bull markets. Whereas, the use of leverage to boost yield can also enhance the fund's volatility. XEI:CA simply holds above-average yielding stocks to generate high yield and dividend growth.
XEI:CA's quarterly distributions are somewhat variable, as they are subject to the dividend payments of the underlying holdings. Since 2020, the fund has paid out approximately $0.20 - $0.23 per quarter in cash distribution. The majority of the distribution is eligible dividend income with only a small portion of the distribution classified as return of capital. I tend to prefer dividend income over return of capital for long-term NAV growth in the fund. While return of capital has some tax efficiencies, excess levels can erode NAV over time.
Distribution by Tax Type (iShares)
Data Source: iShares
Dividend Profile And Safety
Taking a closer look at the largest twenty holdings, accounting for 75% of the fund's NAV we can get a sense of the individual dividend paying stocks that comprise XEI:CA. From a dividend safety perspective, only 2 companies: Suncor Energy Inc (SU) (SU:CA) and Barrick Gold Corp (GOLD) (ABX:CA) have cut their dividends in the past decade. In the case of Suncor, the company cut the dividend briefly in 2020 and then restored it to previous levels in 2021. Since then, the company has pursued additional dividend increases and repurchased shares. Barrick Gold Corp has a hybrid dividend model that pays out variable dividend amounts above a fixed base amount. These amounts are set based on the company's operating performance.
Overall, these constituents offer a strong record of consistent dividend payments with a dividend growth streak averaging 11.6 years. This number is artificially low as the six large Canadian banks maintained, but weren't permitted by regulators to increase their dividends during the CoVID-19 pandemic. The big Canadian banks and their predecessors have been consistently paying dividends for more than a century. Bank of Montreal (BMO) (BMO:CA) started paying dividends in 1829. The Bank of Nova Scotia (BNS) (BNS:CA) followed with a dividend program in 1832. Toronto-Dominion Bank (TD) (TD:CA) has paid dividends since 1857, the Canadian Imperial Bank of Commerce (CM) (CM:CA) since 1868 and the Royal Bank of Canada (RY) (RY:CA) since 1870.
Eleven companies out of the top twenty have never cut their dividend and the majority continue to grow their dividends annually. The ETF has achieved a 5-year dividend growth rate of 3.9%. Given that many of these names operate in mature industries with low levels of organic growth, it is evident that these firms tend to be market leaders with significant pricing power.
| Ticker |
| Name |
| Weight (%) |
| Current Yield |
| 5-Year Dividend Growth Rate |
| Dividend Growth Streak (Years) |
| Last Dividend Cut |
| ABX:CA |
| BARRICK GOLD CORP |
| 5.5% |
| 2.9% |
| 40.3% |
| 7 |
| 2015 |
| SU:CA |
| SUNCOR ENERGY INC |
| 5.1% |
| 4.8% |
| 8.0% |
| 0 |
| 2020 |
| ENB:CA |
| ENBRIDGE INC |
| 5.0% |
| 6.7% |
| 11.8% |
| 27 |
| No Div Cut |
| CNQ:CA |
| CANADIAN NATURAL RESOURCES LTD |
| 4.9% |
| 4.5% |
| 22.1% |
| 22 |
| No Div Cut |
| RY:CA |
| ROYAL BANK OF CANADA |
| 4.9% |
| 4.1% |
| 8.1% |
| 2 |
| No Div Cut |
| T:CA |
| TELUS CORP |
| 4.8% |
| 5.4% |
| 8.3% |
| 19 |
| 2002 |
| BCE:CA |
| BCE INC |
| 4.8% |
| 6.2% |
| 5.2% |
| 14 |
| 2008 |
| TD:CA |
| TORONTO DOMINION |
| 4.8% |
| 4.4% |
| 9.4% |
| 2 |
| No Div Cut |
| TRP:CA |
| TC ENERGY CORP |
| 4.8% |
| 6.7% |
| 7.4% |
| 22 |
| 2000 |
| BMO:CA |
| BANK OF MONTREAL |
| 4.7% |
| 4.7% |
| 6.8% |
| 2 |
| No Div Cut |
| BNS:CA |
| BANK OF NOVA SCOTIA |
| 4.2% |
| 6.2% |
| 6.4% |
| 2 |
| No Div Cut |
| PPL:CA |
| PEMBINA PIPELINE CORP |
| 4.1% |
| 5.7% |
| 4.7% |
| 1 |
| No Div Cut |
| FTS:CA |
| FORTIS INC |
| 3.5% |
| 4.2% |
| 6.1% |
| 49 |
| No Div Cut |
| BIP.UN:CA |
| BROOKFIELD INFR. PARTNERS |
| 2.8% |
| 4.6% |
| 9.1% |
| 15 |
| No Div Cut |
| CM:CA |
| CANADIAN IMPERIAL BANK OF COMMERCE |
| 2.7% |
| 6.2% |
| 6.1% |
| 2 |
| No Div Cut |
| MFC:CA |
| MANULIFE FINANCIAL CORP |
| 2.4% |
| 5.5% |
| 9.8% |
| 9 |
| 2009 |
| SLF:CA |
| SUN LIFE FINANCIAL INC |
| 1.9% |
| 4.6% |
| 6.7% |
| 8 |
| No Div Cut |
| EMA:CA |
| EMERA INC |
| 1.9% |
| 5.3% |
| 7.0% |
| 16 |
| No Div Cut |
| NA:CA |
| NATIONAL BANK OF CANADA |
| 1.7% |
| 4.3% |
| 8.8% |
| 2 |
| 1993 |
| CTC.A:CA |
| CANADIAN TIRE LTD CLASS A |
| 1.1% |
| 4.9% |
| 17.2% |
| 12 |
| No Div Cut |
| Average |
| 5.1% |
| 10.5% |
| 11.6 Years |
Alternatives
Other ETF providers including BMO Global Asset Management and Vanguard offer dividend funds with similar yields. The BMO Canadian Dividend ETF (ZDV:CA) and the Vanguard FTSE Canadian High Dividend Yield Index ETF (VDY:CA) have assets of approximately $1B and $2B respectively. These funds are also both more concentrated with approximately 50 stocks versus XEI:CA's 75 holdings. Both of these funds also have very high exposure to the financial services sector, at 40% and 55%, compared to the 30% cap for XEI:CA.
With a TTM yield of 4.52%, XEI is one of the higher yielding Canadian equity funds offered by iShares. There are some higher yielding dividend income ETFs, however none as well diversified as XIE:CA. The iShares Canadian Select Dividend Index ETF (XDV:CA) has a similar yield, but is much more concentrated with only 30 holdings and almost 60% weighting in financials. Another high yielding mostly equity ETF offered by BlackRock is iShares Canadian Financial Monthly Income ETF (FIE:CA). FIE:CA has a TTM yield of 6.9%, however, its portfolio concentration puts it at over 77% banks, insurers and other financials.
There are numerous other dividend income ETFs that use covered call strategies or leverage to generate income. XEI:CA is the only fund in Canada that seeks to replicate the S&P/TSX Composite High Dividend Index.
Risk Considerations
Dividend paying stocks can be less volatile than the wider market as dividends are a strong signal that the company expects its business model to continue supporting distributable cash flow. XEI:CA is an all-equity portfolio that has a heavy concentration in the energy and financial industries. A commodity price downturn or a shock to the financial system would negatively impact this fund. While the fund has 75 constituents and is reasonably diversified across the Canadian economy, all investors should consider diversifying geographically. As with most dividend paying, companies, higher interest rates make dividend yields on stocks less attractive to fixed income.
Bottom Line
Unlike many high yielding ETFs, XEI:CA does not employ a covered call strategy that mutes capital appreciation in bull markets. Neither does the fund take on the additional risk of employing leverage to enhance yield. This fund is a simple and reasonably diversified collection of above-average yielding stocks.
The underlying holdings offer considerable dividend safety and growth, with only 2 out of the top twenty holdings experiencing in a dividend cut in the last 10 years. XEI:CA's top twenty holdings have an average dividend growth streak of over 11 years and a forward yield of over 5%, indicating potential for continued dividend growth. With an MER of 0.22%, XEI:CA is a great solution for adding diversified and growing dividend income to your portfolio.
For further details see:
XEI:CA No Options, No Leverage, Just High Yield