XHE - XHE: Earnings Surprise Edge Do The Health Care Quants Have It Wrong?
2023-09-25 22:57:10 ET
Summary
- Seeking Alpha's Quant System downgraded the SPDR S&P Health Care Equipment ETF from Hold to Sell in July. What followed was a 21% decline, 18% worse than the broader sector.
- An evaluation of XHE's Rating History reveals weakening price momentum was the driving factor behind the downgrade. All price metrics, from one-month to five-year price returns, are negative.
- However, readers might be surprised that XHE's constituents delivered substantially better sales and earnings surprises than the broader Health Care market last quarter. Wall Street is more bullish, too.
- I expect XHE's price to soon reflect these strong results. While I have reservations about it as a long-term hold due to relatively weak quality, it looks like a nice short-term trade today for Health Care ETF investors.
Investment Thesis
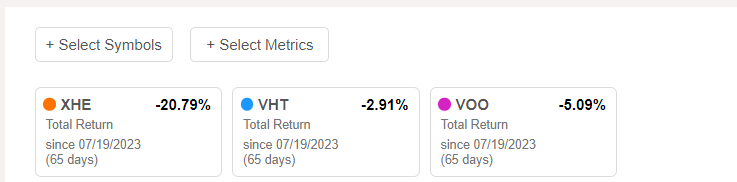
On July 20, 2023, Seeking Alpha's Quant System changed its grade on the SPDR S&P Health Care Equipment ETF ( XHE ) from Hold to Sell. A further downgrade to a Strong Sell occurred two weeks later on August 2, 2023, and over that entire period, the ETF declined by 20.79% compared to 2.91% and 5.09% losses for the Vanguard Health Care ETF ( VHT ) and the Vanguard S&P 500 ETF ( VOO ). It's an impressive result for a Quant System that, although it is too challenging to copy in real-time, can still red flag investments for greater scrutiny.
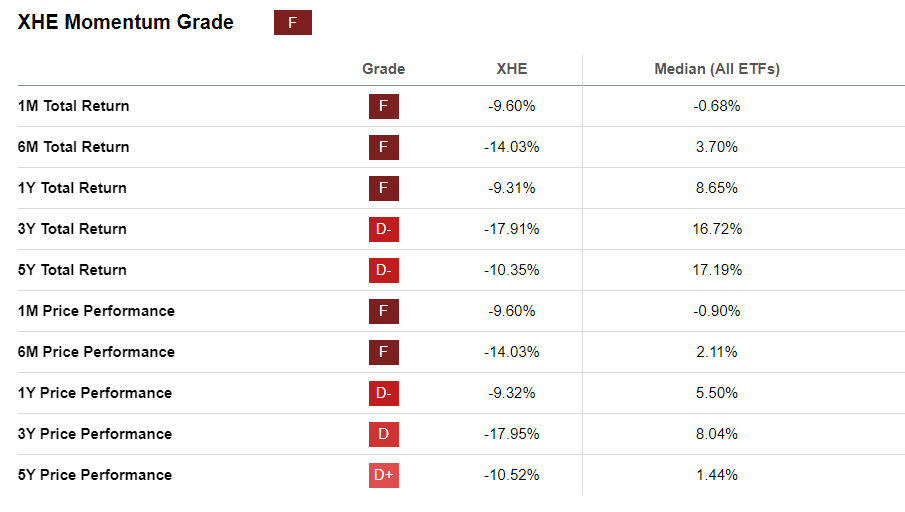
So, what exactly did the system identify that others might have missed? Based on the history , it was all momentum-related. Previously a buy as of June 29, 2023, XHE's Momentum Grade fell from "B+" to "B," then "C" in July, "D-" in August, and finally, "F" today. The ETF crossed some momentum threshold, and the system has effectively warned investors about trying to catch this falling knife. As shown, all short-term performance metrics are rated poorly.
It's an ugly picture, but there is one key reason why a turnaround could happen: these price momentum figures are inconsistent with the ETF's earnings momentum. Briefly, XHE's constituents delivered 4.06% and 13.38% sales and earnings surprises last quarter, compared to 2.68% and 5.33% for VHT. In addition, XHE beats VHT on EPS Revisions: 6.07/10 to 4.95/10. As a result, XHE presents an excellent buy-the-dip opportunity for Health Care ETF investors, and I look forward to taking you through the numbers in greater detail below.
XHE Overview
Strategy and Key Exposures
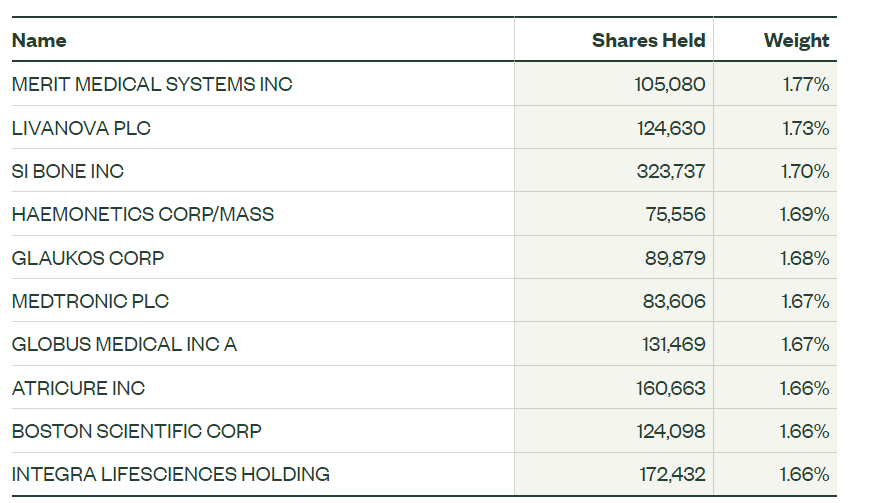
XHE tracks the S&P Health Care Equipment Select Industry Index, selecting U.S. stocks in the S&P Total Market Index classified in the Health Care Equipment and Health Care Supplies sub-industries according to Global Industry Classification Standards. The Index rebalances quarterly, and its 71 constituents are mostly equally weighted. I've listed the top 10 below, led by small-caps Merit Medical Systems ( MMSI ), LivaNova ( LIVN ), and SI-BONE ( SIBN ). Medtronic ( MDT ) and Boston Scientific ( BSX ) are better-known names with market caps of $107 and $79 billion, respectively.
Performance
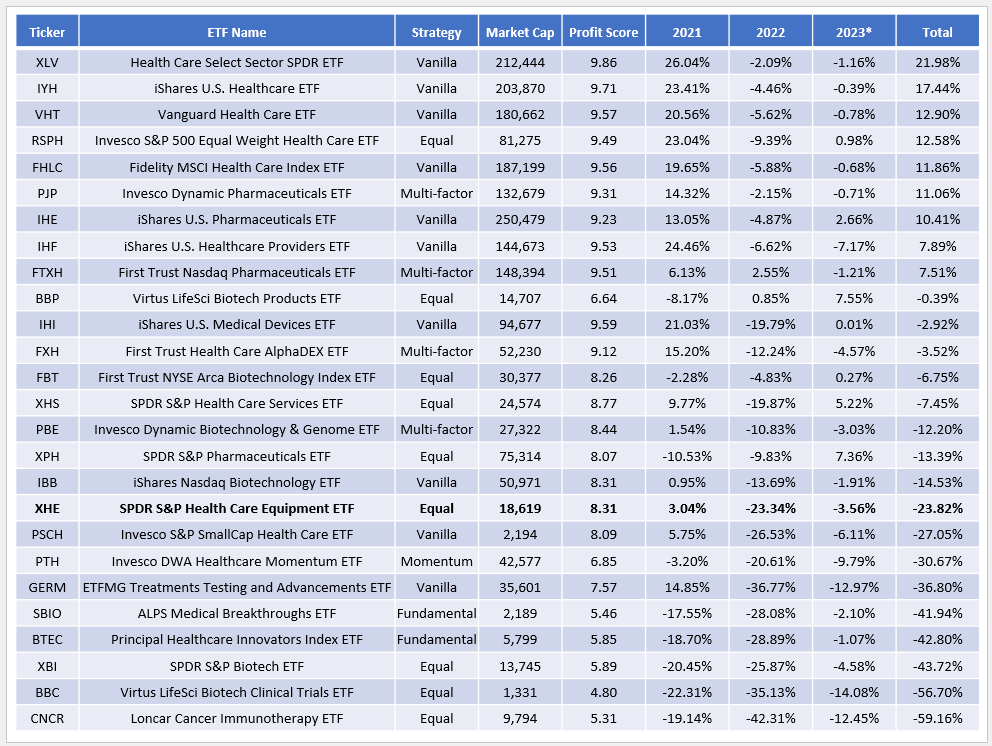
Between January 2021 and August 2023, XHE declined by 23.82%, the eighth-worst in a peer group of 26. I've listed the returns for each Health Care ETF in descending order in the table below and some other useful statistics that help explain these returns.
The trend favors large-cap Health Care ETFs with a market-cap-weighting scheme. The Health Care Select Sector SPDR ETF ( XLV ) was the top performer, followed by the iShares U.S. Healthcare ETF ( IYH ) and VHT. In contrast, small-cap equal-weighted funds like XBI and XHE struggled.
Another factor I consider is each ETF's Profit Score, which I calculated using Seeking Alpha Profitability Grades. The takeaway is obvious: ETFs with more significant weightings toward highly profitable stocks performed better. XHE's 8.32/10 score isn't bad, but since it's below the threshold of what I consider a high-quality ETF, substantial declines will happen from time to time. The main question is if XLE's drawdown is overdone, so let's look at the fundamentals in more detail next.
XHE Fundamentals
Risk, Growth, Valuation, and Profitability
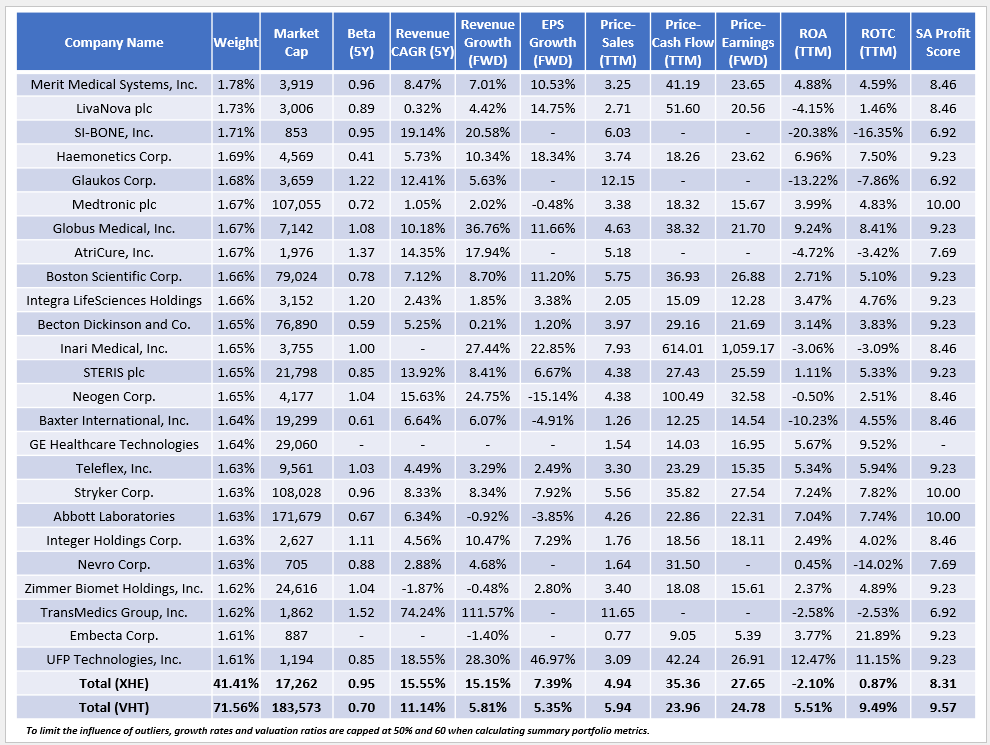
The following table highlights selected fundamental metrics for XHE's top 25 holdings, totaling 41% of the portfolio. I've also included the metrics for VHT as a comparison.
I want to make a few observations:
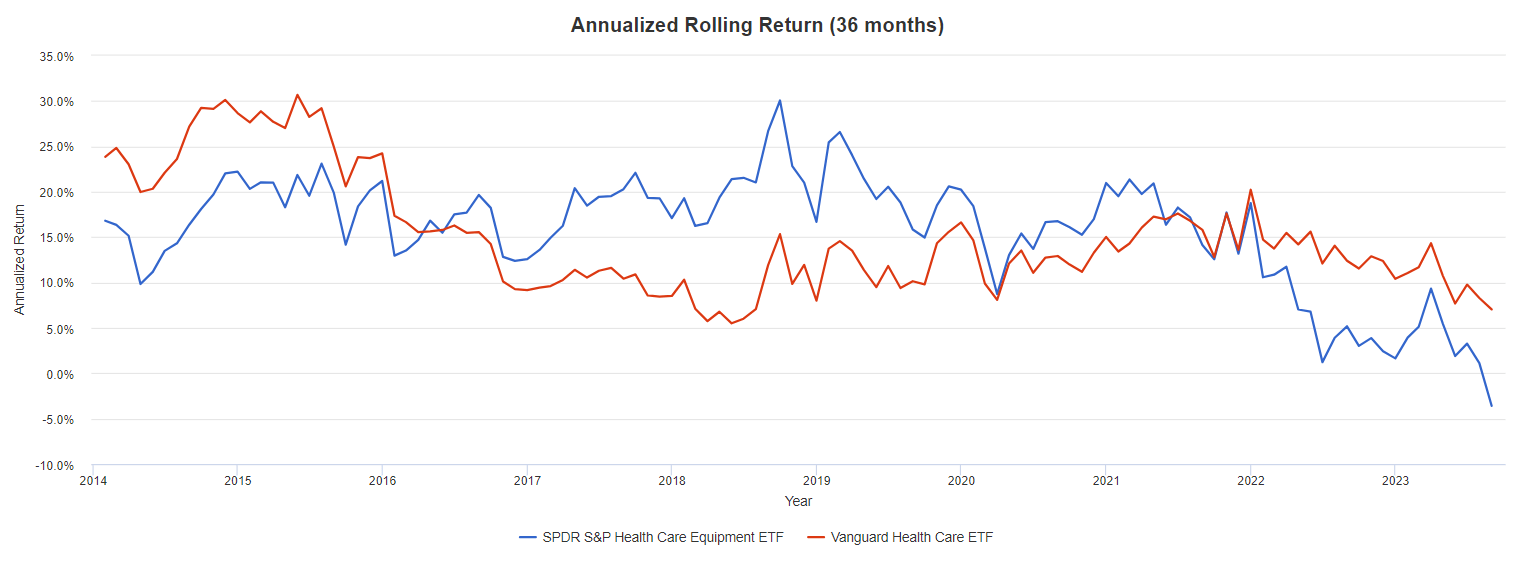
1. XHE's 0.95 five-year beta is not what you might expect and suggests little downside protection in market downturns, as opposed to VHT. The reason is the equal-weighting scheme and the inclusion of stocks from all size segments. For example, the Invesco S&P SmallCap Health Care ETF ( PSCH ) has a 0.99 five-year beta, while many Pharmaceutical ETFs like PJP, IHE, and FTXH that favor large-cap stocks have betas around 0.60. Effectively, XHE investors are trading safety for diversification, and that's not necessarily a flawed approach. As shown in the three-year rolling returns chart below, there were many times when XHE outperformed VHT. For example, annualized returns were 15% better (30.05% vs. 15.33%) for the period ending September 2018. However, it's a different story now. XHE's three-year annualized returns through August 2023 are -3.59% vs. 7.03% for VHT.
2. Besides better size diversification, XHE investors gain access to high-growth companies. The ETF's weighted average estimated sales growth rate is 15.15% vs. 5.81% for VHT. It also has a slightly better estimated EPS growth rate (7.39% vs. 5.35%). Still, those figures are only partially accurate, as many companies are not yet profitable, and thus, we can't calculate an earnings growth rate. Examples include SI-BONE, Glaukos ( GKOS ), and AtriCure ( ATRC ).
3. Non-profitable stocks also impact valuation ratios. By excluding them, I've calculated that XHE trades at 27.65x forward earnings, three points more than VHT. However, 24/71 stocks have incalculable P/E's, so the ratio isn't reliable. Instead, I want to emphasize how XHE trades at 35.36x trailing cash flow, 11.4 points more than VHT. These metrics point to how expensive XHE is, which likely explains its poor recent performance.
4. As mentioned, XHE's 8.31/10 Profit Score is problematic. Seeking Alpha's system is proprietary, but we can easily see the reason for the lower score by evaluating its constituents' return on assets and total capital ratios, which are 7-9% worse than VHT.
Overall, XHE holds many riskier-than-average stocks that are of lesser quality. While the ETF has greater growth potential than a plain vanilla fund like VHT, it trades at an elevated valuation. It is incredible that XHE still trades at 35.36x trailing cash flow despite declining by 24% between January 2021 and August 2023. Indeed, it feels a lot like trying to catch a falling knife.
Price vs. Earnings Momentum
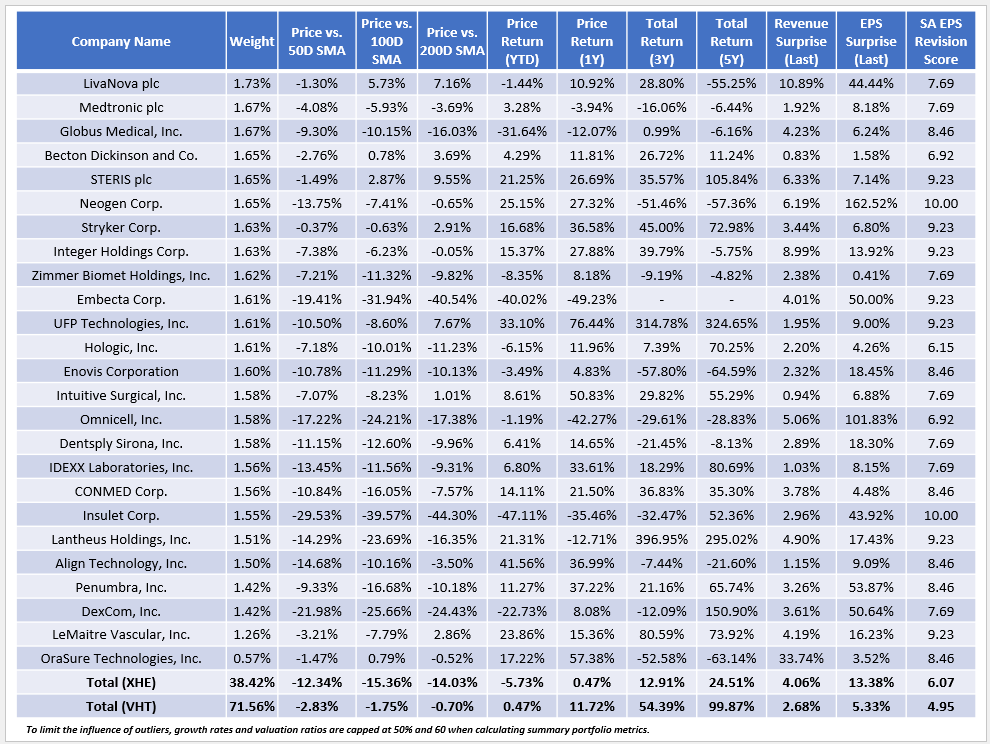
Despite XHE's poor price momentum, there is a sign of hope: strong earnings momentum. Consider the sales surprise, earnings surprise, and EPS Revision Scores for 25 of XHE's holdings below, totaling 38.42% of the fund. In all cases, constituents are trading below their 50-day moving average prices but delivered positive sales and earnings surprises last quarter. They also have a Seeking Alpha EPS Grade of "B-" or better (6.15/10 score).
Several stocks are well off their 50-day moving average prices despite a strong showing last quarter. Globus Medical ( GMED ), a manufacturer of musculoskeletal devices, plunged 22% immediately after missing Q1 2023 sales expectations and lowering guidance for the remainder of the year. The stock has yet to recover despite reporting substantially better results for Q2 2023 . Embecta ( EMBC ), a recent spinoff of Becton, Dickinson ( BDX ), is trading 40.54% below its 200-day moving average price but beat by 50% on earnings last quarter.
On a weighted average basis, XHE trades at 12.34% below its constituents' 50-day moving average price compared to 2.83% for VHT. There's also a 13% gap on the 100- and 200-day moving average price statistics. In contrast, XHE's constituents had a better last quarter sales surprise (4.06% vs. 2.68%) and earnings surprise (13.38% vs. 5.33%) than VHT and have a better EPS Revision Score (6.07/10 vs. 4.95). The price and earnings momentum statistics don't line up, presenting a unique short-term trading opportunity.
Investment Recommendation
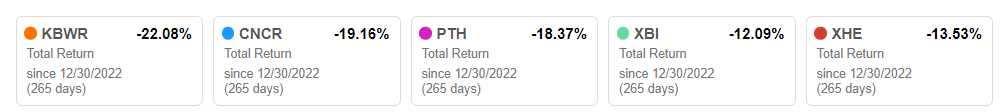
Seeking Alpha's Quant System forecasted XHE's sharp decline in July, underperforming VHT by approximately 18%. After evaluating each of the individual ratings that go into the system's Quant Score, it's clear a change in momentum was the key reason for the downgrade. However, my analysis reveals how XHE's constituents' price momentum and earnings momentum statistics do not align, and there's a good chance the ETF is oversold. Furthermore, please also consider how only about 10% of the U.S. Equity ETFs in my database (86/910) have weighted average last quarter sales surprises above 3.50%. 72/86 were positive for the year through August, with XHE among the five worst performers.
KBWR is a Regional Banking ETF, and I'm sure we're all familiar by now with the crisis that started with the collapse of Silicon Valley Bank. CNCR , PTH , and XBI are three other Health Care ETFs, but as listed earlier in the article, their profit scores are only 5.31/10, 6.85/10, and 5.89/10. While not ideal, XHE's 8.31/10 score is far superior, suggesting it's the most prudent choice today for deep-value ETF investors. Therefore, I've rated XHE a "buy," and I look forward to continuing the discussion in the comments below.
For further details see:
XHE: Earnings Surprise Edge, Do The Health Care Quants Have It Wrong?