LIN - XLB: Materials Stocks Near Resistance After A Massive Rally
Summary
- Materials stocks, dominated by Chemicals names, have surged in the last two months.
- There could be near-term selling due to a confluence of technical factors.
- Still, with a low valuation and sensitivity to rebounding cyclical themes, XLB could be a good place for longer-term investors.
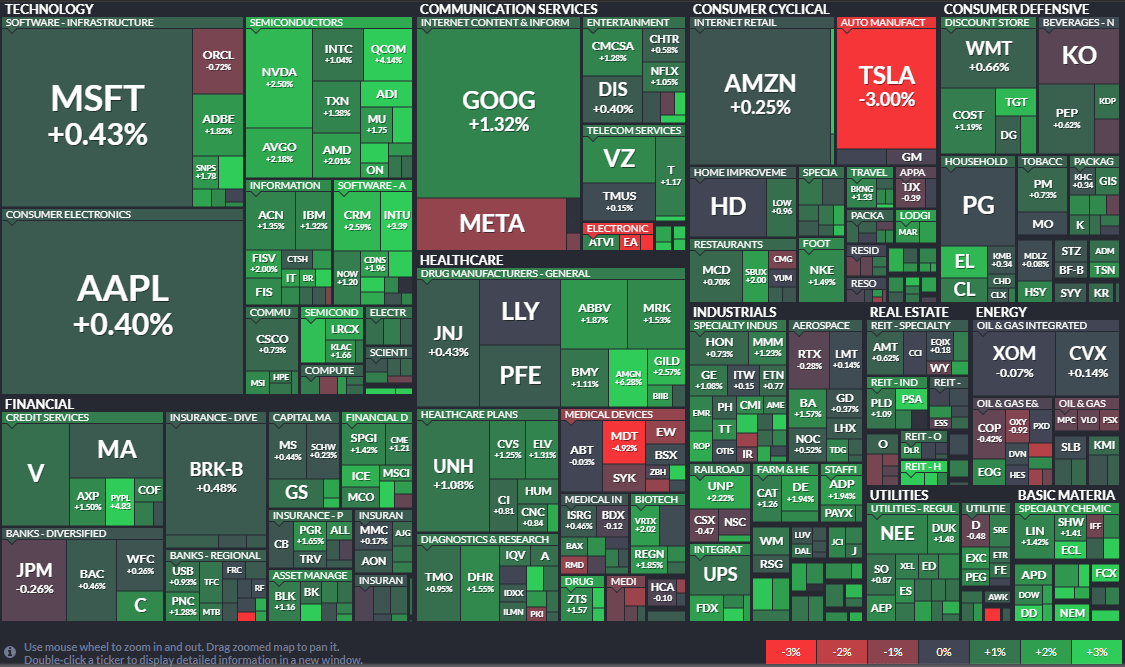
The Materials sector led the way for stocks on Tuesday ahead of the key U.S. midterm elections. Positive price action out of shares of DuPont (DD), Newmont Mining (NEM), Albemarle (ALB), and Mosaic (MOS) all helped lift the resource group to its highest level since mid-September.
Is there more upside to come in the Materials sector? And what's an effective way to play it?
Materials Lead SPX Ahead of the Pivotal Midterms
According to SSGA Funds, the Materials Select Sector SPDR Fund (XLB) provides effective exposure to an index that has a representation of the materials sector of the S&P 500 Index. XLB seeks to provide precise exposure to companies in the chemical, construction material, containers and packaging, metals and mining, and paper and forest products industries.
With an expense ratio of just 0.10% and with more than $5 billion in AUM, the fund has solid intraday liquidity for traders and favorable tax benefits by way of the ETF wrapper for long-term investors. It is a concentrated fund, though, with nearly a fifth of XLB invested in Linde plc (LIN).
Investors can consider owning the Invesco S&P 500 Equal Weight Materials ETF (RTM), although that product has underperformed XLB in the last month.
XLB: A Concentrated Sector ETF
SSGA Funds
XLB has a forward price-to-earnings ratio of just 13.9 , well below the S&P 500's earnings multiple. With sensitivity to the U.S. dollar and general value and cyclical trends, it's an inexpensive way to diversify away from growth areas. SSGA also reported that the average 3-5 year EPS growth rate of the portfolio is a solid 7.66%, making for a low PEG ratio under 2.
The Technical Take
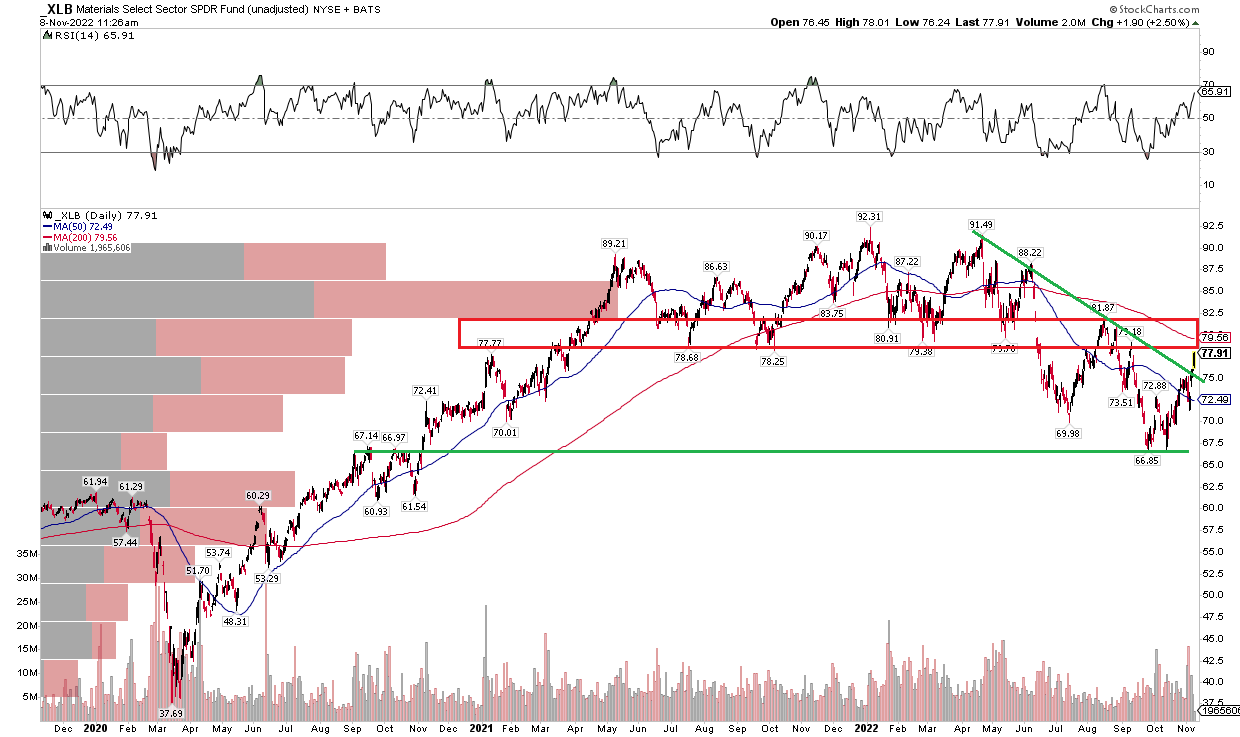
With a good valuation, what does the chart say? XLB appears to have rallied into key resistance.
I see the potential for sellers to enter the picture near current price levels, so taking profits could be a prudent move here. Also notice that the falling 200-day moving average, which was resistance in August, comes into play near $79 - just about 3% above the last trade.
Moreover, I see significant volume-by-price (as indicated on the left of the chart) starting near $82. So that is another layer of bearish supply potential.
What I like, though, is solid apparent support in the $66 to $68 range. Thus, while there is bearish resistance in play, long-term support looks good. Another arrow in the bulls' quiver is a downtrend resistance line that was broken above on big volume earlier this month. Is that enough evidence to power XLB through resistance? Possibly, but I think there are more bearish than bullish risks here.
Buying on a pullback to the low $70s - around the 50-day moving average - is a good strategy.
XLB: Bounces Off Support, Rallies Above A Resistance Line, Back At Key Resistance
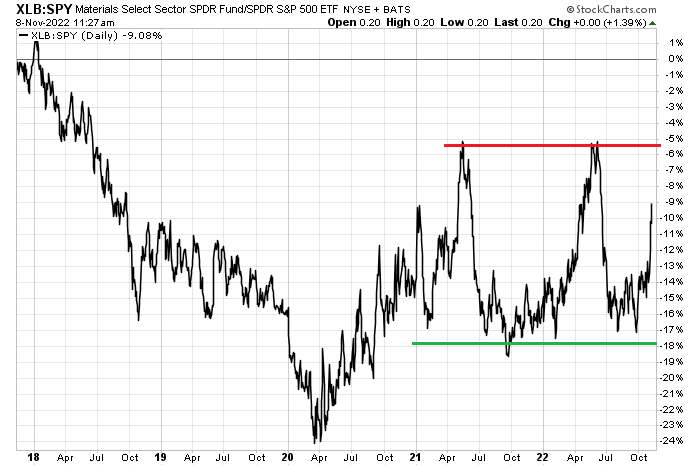
Here is a bonus technical chart: the relative performance of XLB to the S&P 500 ETF (SPY). The sector fund could have eyes on retesting its comparative peaks from last year and during the middle of 2022. Another interesting play could be to go long XLB, short SPY through a pairs trade under that thesis.
XLB Vs SPY: Bullish Momentum
The Bottom Line
XLB looks better in the long term than in the short run right now. I would take profits on XLB after a big rally in the last two months. Look to buy the dip in the low $70 around the 50-day moving average.
For further details see:
XLB: Materials Stocks Near Resistance After A Massive Rally