XLG - XLG: Richly-Priced Megacap ETF Buy A Dip For A Better Q3 Risk/Reward Strategy
2023-07-05 15:54:41 ET
Summary
- The first half of 2023 saw the narrowest breadth in history, with just 25% of stocks outperforming the S&P 500, according to Bank of America Global Research.
- The Invesco S&P 500 Top 50 ETF is considered a hold as Q3 ensues, with a high price-to-earnings ratio of 20.2 and net assets under management summing to $2.3 billion.
- XLG's valuation is not compelling despite strong earnings growth, and concentration is a key risk, with the top pair.
- I highlight key price levels to watch as the risks of a Q3 correction grow.
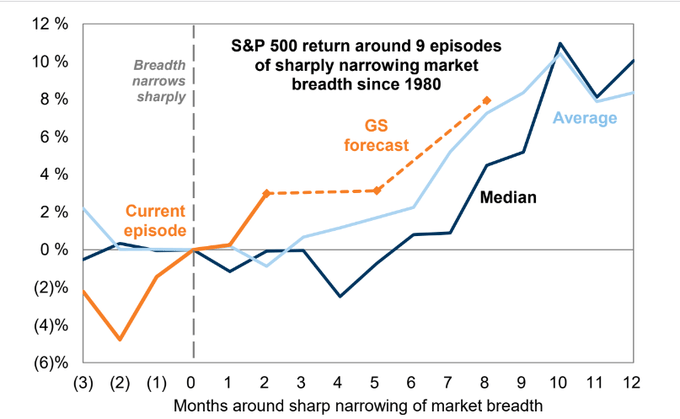
According to Bank of America Global Research, the first six months of 2023 marked the narrowest first-half breadth in history, with just 25% of stocks outperforming the S&P 500, and the equal-weighted index underperformed by 10ppt (+6.9% YTD). US large caps typically trade sideways after sharp declines in breadth, before rallying, so say analysts at Goldman Sachs.
So, what can we expect from the biggest of the big US companies? Let's dive into why I assert the Invesco S&P 500 Top 50 ETF ( XLG ) is a hold as Q3 ensues.
Weak Breadth Often Means Smaller Name Play Catch-Up
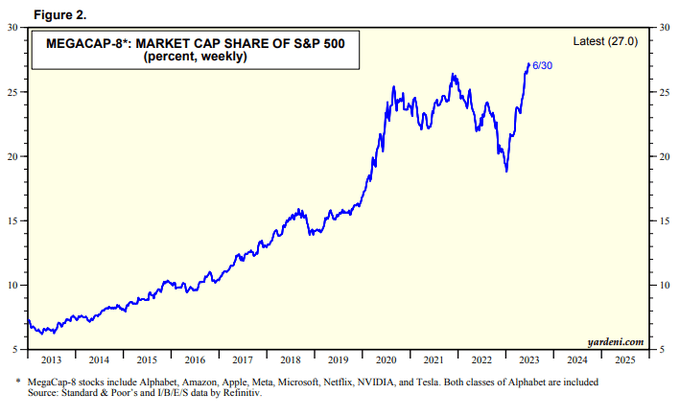
Megacaps Growing As A Percentage of the S&P 500
According to the issuer , XLG is based on the S&P 500 Top 50 Index and the fund will invest at least 90% of its total assets in securities that comprise that index. The index is composed of 50 of the largest companies in the S&P 500. The ETF and the index are rebalanced annually.
XLG features a very low 1.1% dividend yield and net assets under management sum to $2.3 billion, so it is a large ETF, though 30-day average trading volume is modest at just 57,480 shares as of July 2, 2023. Holding 53 total individual equities, Invesco states that the 30-day median bid/ask spread is quite narrow at just three basis points, so tradeability is strong despite low volume.
XLG has a high price-to-earnings ratio of 20.2 (operating, forward) while its last-12-month non-GAAP P/E is 21.0. The average market cap of the holdings in the fund is $953 billion, so the one-trillion-dollar club really drives XLG's performance. In terms of expenses, the annual cost to own XLG is rather low at 20 basis points, but broader index funds are more than 0.1 percentage points cheaper.
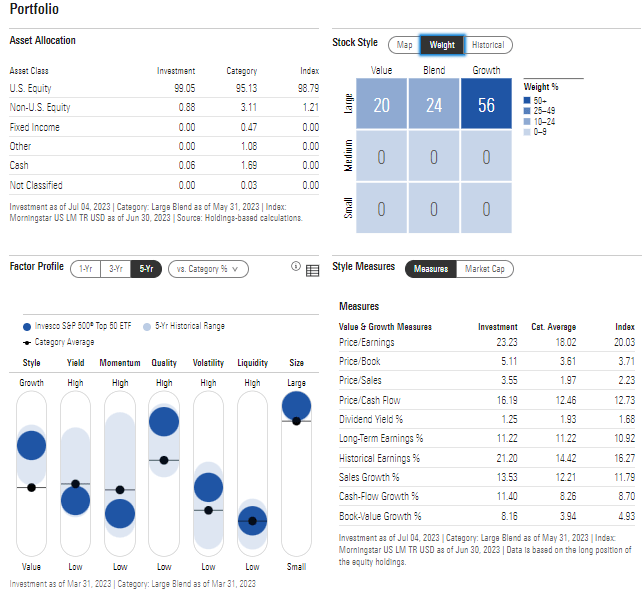
Digging into the portfolio, data from Morningstar confirm just how large the fund is in terms of what it holds. Of course, the entire allocation is large-cap, but if we were to include a "mega-cap" row on the Style Box, it would plot on the upper end of even that range. XLG is also a growth fund since 56% of net assets are in that style whereas just 20% is value oriented. Earnings quality is high and momentum has been strong this year. With a P/E north of 20 now, I assert the valuation is not compelling even though earnings growth is strong.
XLG: Portfolio & Factor Profiles
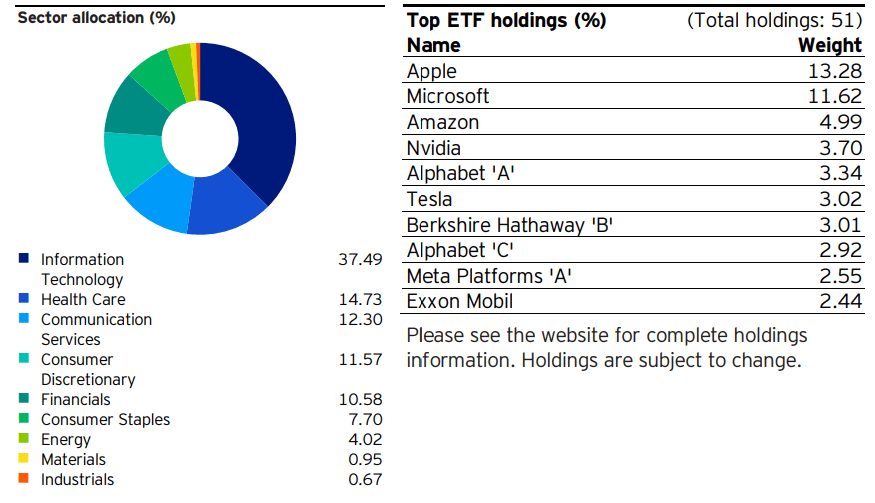
Along with the lofty valuation, concentration is a key risk prospective investors must consider. We see below that the top pair of holdings account for nearly one-quarter of the XLG. So, if you own significant amounts of XLG, you should track the goings on with Apple ( AAPL ) and Microsoft ( MSFT ). Moreover, growth-heavy sectors such as Information Technology, Communication Services, and Consumer Discretionary comprise more than 60% of the portfolio.
XLG: Very Heavy in TMT Industries, AAPL & MSFT Key To Watch
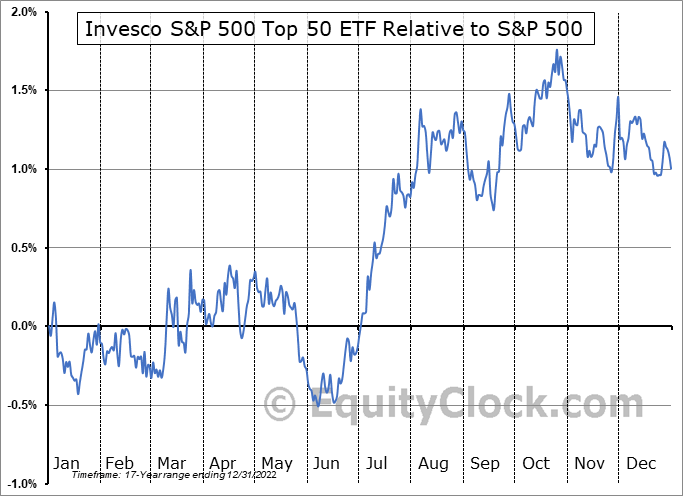
Most investors know that stocks tend to do well in pre-election years while Q3 can sometimes be a bit volatile, particularly in September. With this seasonal look on XLG (care of data from Equity Clock ), the mega-caps often outperform the S&P 500 from early June through early August, with softer alpha commonly generated through October. So, going overweight the biggest of big US stocks could be a prudent play over the coming months.
XLG vs. SPX: Bullish July Through October Trends
The Technical Take
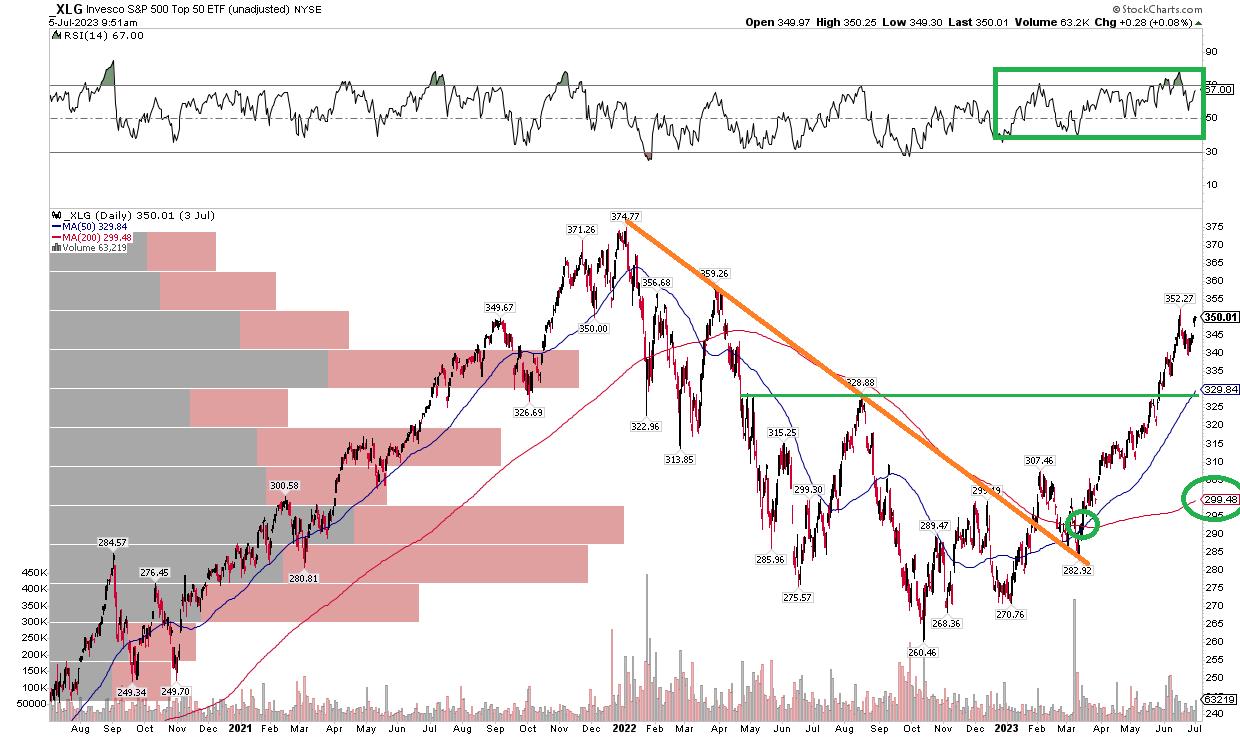
While the valuation is turning stretched on XLG, technical momentum is robust. Notice in the chart below that shares are up a whopping 35% from the October 2022 low. Just since the March nadir, XLG is higher by 24%. As a result, the RSI momentum indicator at the top of the chart has been in the bullish 40 to 90 zone for all of this year.
What could go wrong, though? Notice the monster gap between the rising long-term 200-day moving average and the sharply inclined 50-day moving average. That is a bigger gap than was seen during the entire late 2020 through 2021 bull market. I would not be surprised to see XLG drop in Q3 and test support at the prior resistance near $330 - that's the August 2022 peak as well as where the 50dma comes into play right now. I assert that would be a more favorable entry point on XLG.
Overall, the rising 200-day moving average suggests the bulls are in control but buying on a dip to $330 looks better to me versus establishing a long position here.
XLG: Strong RSI Momentum, Sharp Uptrend Susceptible To Correction Risk
The Bottom Line
My hold rating on XLG is based on its 20+ forward operating P/E ratio and stretched technical situation. Buying on a dip to $330 appears to be a better risk management strategy than buying today.
For further details see:
XLG: Richly-Priced Megacap ETF, Buy A Dip For A Better Q3 Risk/Reward Strategy