XLG - XLG: The Bigger They Are The Harder They'll Fall
2023-09-18 17:02:08 ET
Summary
- Large and mega-cap stocks have underperformed over the long term due to slower earnings growth, making their current valuation premium concerning.
- Invesco S&P 500® Top 50 ETF is heavily skewed towards expensive technology stocks, with a 38% weighting compared to 28% for the S&P500.
- The rise in retail investors, particularly in options markets, has driven the anomaly in mega-cap relative valuations, but this may not be sustainable in the next bear market.
The Invesco S&P 500® Top 50 ETF ( XLG ) tracks the performance of the S&P 500 Top 50 Index, which is composed of 50 of the largest companies in the S&P500. It may surprise many to know that large and mega-cap stocks have underperformed over the long term due to slower earnings growth than the broader market. This makes their current valuation premium particularly concerning. While the past two major equity bear markets in 2008-09 and 2020 saw mega caps outperform, the next downturn is likely to see the XLG underperform.
The XLG is even more heavily skewed towards expensive Technology stocks than the overall market, with a 38% weighting compared to 28% for the S&P500. The fund charges an expense fee of 0.2% resulting in a net dividend yield of 1.0%. The top 50 S&P500 stocks now make up a record 57% of the overall S&P500, and 84% of the S&P100.
S&P500 Top 50 Index Market Cap, % of S&P500 and S&P100 (Bloomberg)
The Mega Cap Premium Is Not Normal
While I only have fundamental data on the S&P 500 Top 50 Index going back to 2017, it is safe to say that its current valuation premium is not normal. The following chart shows the P/E ratios of the U.S. markets by size, from the S&P500 Top 50 to the S&P100 to the Equal Weighted S&P500 to the S&P400 Mid-Caps to the S&P600 Small Caps.
PE Ratios (Bloomberg)
For most of the past two decades outside of the post-Covid bubble, larger U.S. stocks have traded at a discount to smaller ones due to their slower growth potential, which is a function of market size. Since the Covid crash, there has been a major reversal in performance and valuations, with investors paying up for the perceived safety and growth of the largest stocks in the country. The S&P500 Top 50 Index now trades at a P/E ratio of 26x, compared to 18x for the median S&P500 stocks and just 16x for small and mid-cap stocks.
This mega cap valuation premium is even more unusual when we consider that profit margins are also considerably higher than their peers. With operating margins at over 18%, double the Equal Weighted S&P500, the high P/E ratio is clearly not the result of temporary declines in profitability.
Operating Profit Margins (Bloomberg)
Retail Traders Amplify Busts As Well As Booms
The rise in appetite for mega caps stocks may be explained by the rise in retail investors as a share of the market. The proliferation of retail traders since the Covid lockdowns, particularly in the options markets, seems to have been a key driver of this anomaly in mega cap relative valuations. Retail investors tend to pick stocks based on name recognition, and so naturally this would benefit mega cap stocks. These investors tend to be driven by historical performance, chase markets that have already risen thus increasing their outperformance, but by the same token they are more likely to sell on weakness. As we saw in the late-1990s, retail investors drove up tech stocks way beyond their fundamentals and then panic sold them as the Nasdaq 100 fell 83% from its peak.
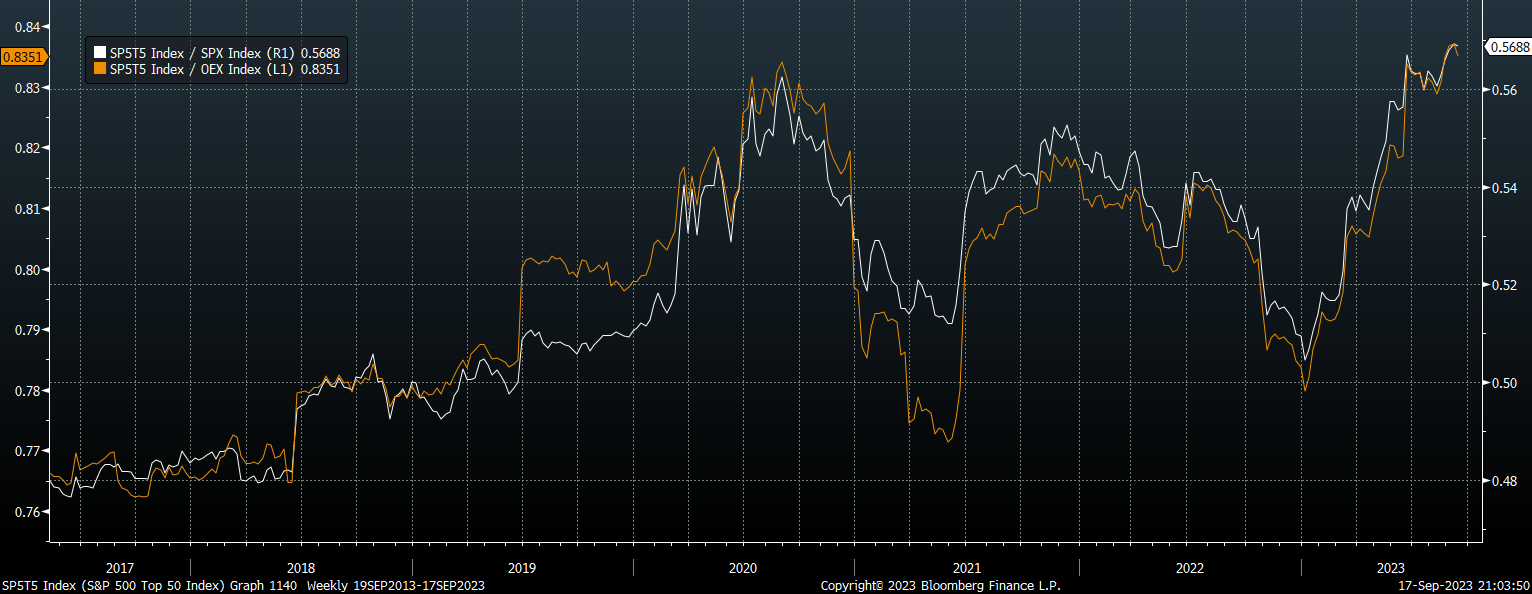
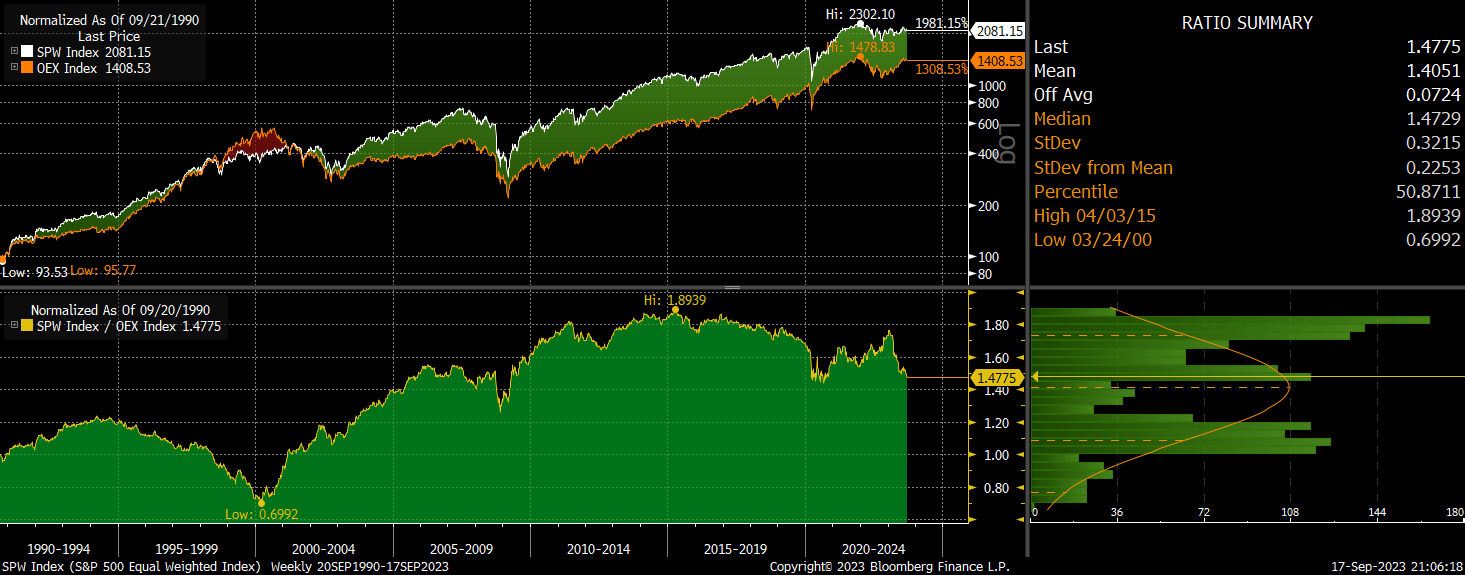
While the largest S&P 500 stocks have tended to outperform during recessions, the current bear market, which began in January 2022, is likely to be particularly harsh to these widely loved stocks. Higher profit margins and stronger balance sheets have tended to allow mega cap stocks to outperform the broader U.S. market during times of recession and financial crisis, as seen in 2008/09 and 2020. While these are still factors that should support mega caps in another bear market, their extreme valuation premium driven by retail investors will make outperformance very difficult. As we saw in the early-2000s bear market, the average S&P 500 stock outperformed the S&P 100 by over 60% as the famous names crashed while the average stock managed to perform reasonably well.
A Lot Has To Go Right For XLG To Outperform
With the top 50 trading at a P/E ratio of 26x versus 18x for the lower 450, this means that investors in the XLG require earnings to rise by almost 50% on a relative basis to justify the current valuation premium. With inequality an increasingly hot political issue, even more of the country's scarce savings in the hands of a few large companies and their shareholders is likely to increase calls for redistributive policies targeting major companies. It would also raise the risk of an increase in protectionist policies aimed at supporting blue collar workers. We are also likely to see increased pushback against AI driven automation and its impact on less skilled workers, while governments will likely use such technology to tighten their grip on society globally, retarding the productivity benefits of AI. While this does not mean that mega cap stocks and the XLG cannot continue their outperformance, it does mean that a lot will have to go right for this to occur.
For further details see:
XLG: The Bigger They Are The Harder They'll Fall