FUTY - XLU And NextEra Energy: Still Too Early To Buy The Utilities Sector
2023-06-19 09:30:00 ET
Summary
- XLU is a low-cost way to invest in 30 large-cap Utilities. With $16 billion in assets under management and a 25-year track record, XLU is a great diversifier.
- XLU yields 3.09%, but investors shouldn't base their investment decision on how it compares with Treasuries. Instead, I recommend following authorized ROEs from Public Utility Commissions and quarterly earnings surprises.
- These metrics explain why XLU is the second-worst-performing sector this year. Wall Street analysts aren't budging, either. Sentiment for Utility stocks is negative.
- Until this changes and we see better earnings, I don't recommend trying to time the bottom. There's likely a long-term value play here, but there's no rush to buy XLU.
Investment Thesis
The Utilities Select Sector SPDR ETF ( XLU ) is getting hammered this year, with investors showing little interest in this traditionally-defensive sector. XLU is down by 3.84% YTD. Meanwhile, the SPDR S&P 500 ETF ( SPY ) has surged 15.79% due to a strong Q1 earnings season and renewed confidence in the Technology sector. Now trading at just 18.86x forward earnings, an eight-point discount to SPY, you might wonder if it's reasonable to initiate a position now and capture XLU's solid 3.09% dividend yield.
However, I think it's too early to buy. Downward trends in inflation and interest rates could mean lower ROEs authorized by Public Utility Commissions. Wall Street is also downbeat on Utilities, and the sector was the only one to miss earnings expectations in aggregate last quarter. Things may stabilize shortly, but for now, I prefer to remain on the sidelines, and I look forward to explaining why in more detail below.
XLU Overview
Strategy and Performance
XLU holds 30 large-cap Utility stocks in the S&P 500 Index and weights by free-float market capitalization. Its expense ratio is 0.10%, tied for second-cheapest with the Vanguard Utilities ETF ( VPU ) but two basis points behind the Fidelity MSCI Utilities Index ETF ( FUTY ). Most of the fund is Electric Utilities (62%) and Multi-Utilities (29%), but a few smaller holdings operate in the Independent Power Producers, Water Utilities, and Gas Utilities industries. XLU has $16.19 billion in assets under management and was launched on December 16, 1998.
Since then, XLU has delivered an annualized 6.95% return compared to 7.24% for SPY. It's a good result, but risk-adjusted returns (Sharpe and Sortino Ratios) aren't superior like you might expect.
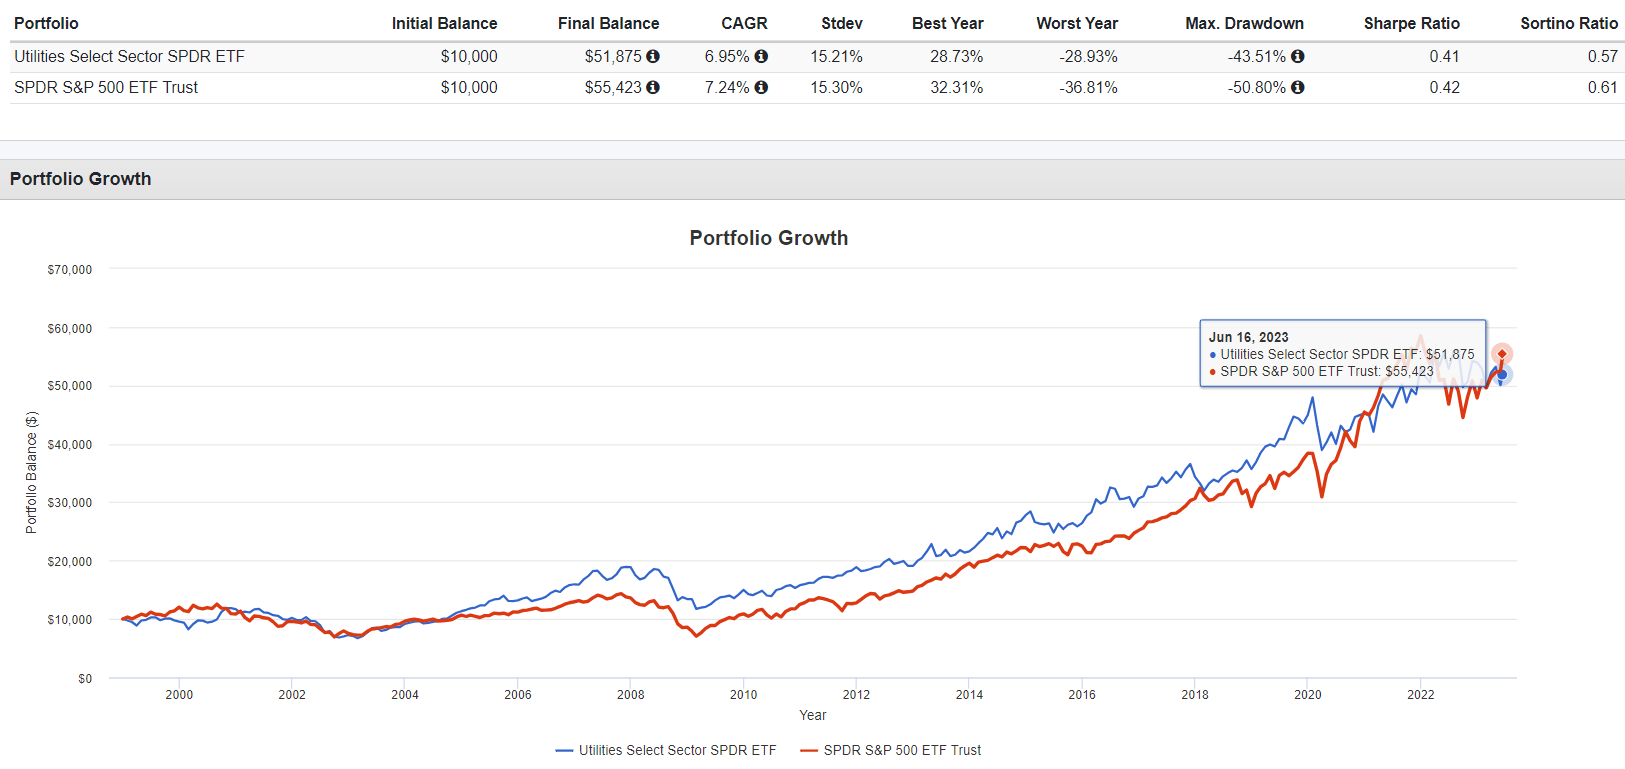
From 1999-2022, XLU outperformed SPY 11/24 times; in those years, the average beat was 13.45%. In contrast, when XLU underperformed, it did so by 11.04% on average. So you can see how important the decision to invest in XLU is, especially if you're using it for a specific purpose (e.g., recession protection). Get it right, like in 2022, when XLU outperformed by 19.59%, and the benefit is substantial. But by not recognizing the changing market landscape, your gains can quickly erode, causing you to wonder why you even made the tactical move in the first place. This year is one example: XLU has lagged SPY by 19.63%.
Factors in Focus: Yield, ROE Authorizations, Earnings
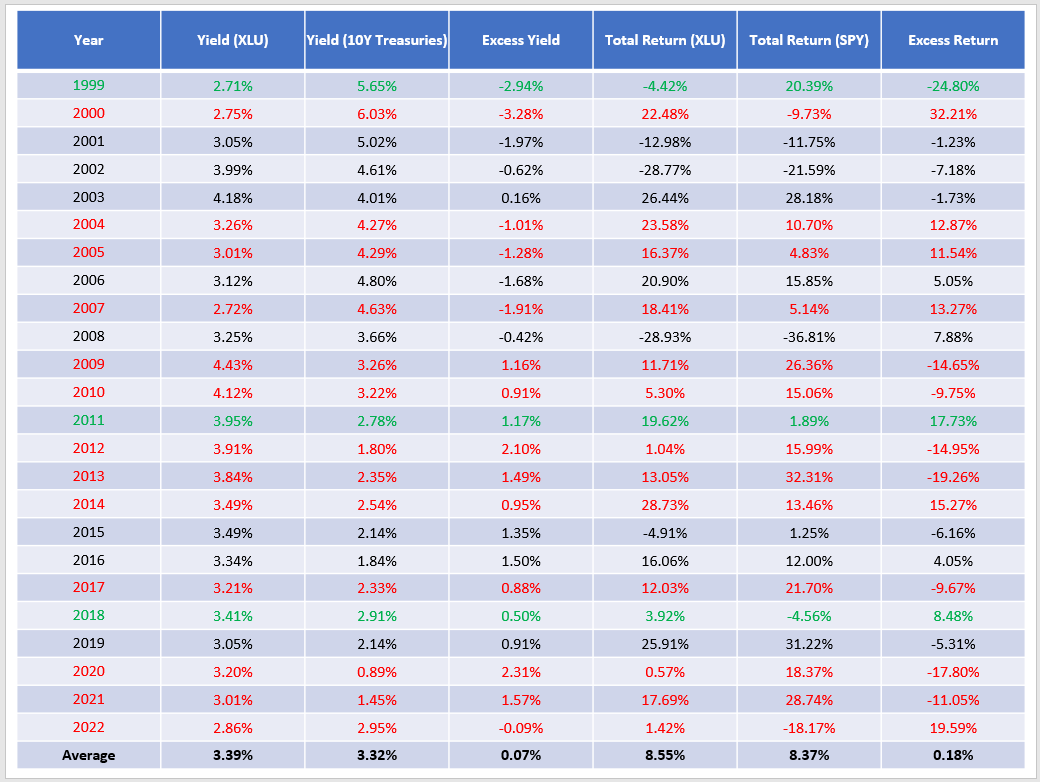
Some investors use XLU as a bond proxy, selecting it when its dividend yield is above long-term Treasury yields, such as the 10Y yield. The logic is that these assets compete for investor dollars, and to an extent, that's true. Investors buy the higher-yielding asset, and a value play is also embedded in the strategy. XLU's price is low when its yield is high, which should provide some downside risk protection. Unfortunately, the data on this strategy is not convincing. To illustrate, I've charted two metrics:
- The excess yield between XLU's average annual dividend yield and the average 10Y U.S. Treasury Yield between 1999-2022
- The excess annual return between XLU and SPY between 1999-2022
As shown, there is no positive correlation between XLU's excess yield over 10Y Treasuries and its performance relative to SPY. I've highlighted in green the three years, where there's a positive correlation between XLU's excess return and its excess yield. However, there were 13 years with an inverse correlation.
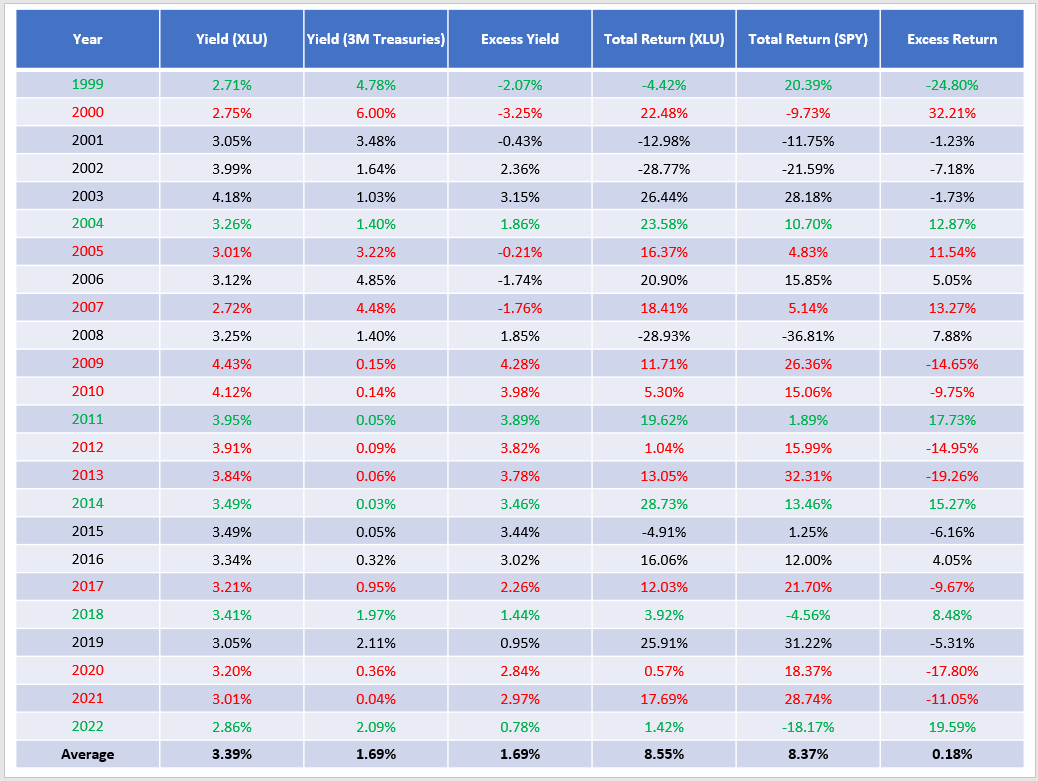
We see more correlation between XLU's excess yield and the shorter-term three-month Treasury Yield. The correlation was positive in six years, compared to ten years with an inverse correlation.
Even in high-yielding years like 2009 and 2010, XLU lagged by 14.65% and 9.75%. Therefore, yield doesn't have much predictive value, and I recommend readers consider other factors instead. For example, consider that Utilities mainly operate on a cost-of-service model that guarantees a return on equity. Public Utility Commissions authorize a rate of return based on the cost of all assets used to provide a service to customers, and these rates typically correspond to interest rates. As researchers at S&P Global write:
U.S. investor-owned utilities requested rate increases totaling a combined $16.89 billion in 2022, up about 14% from a record-setting 2021, as tracked by Regulatory Research Associates.
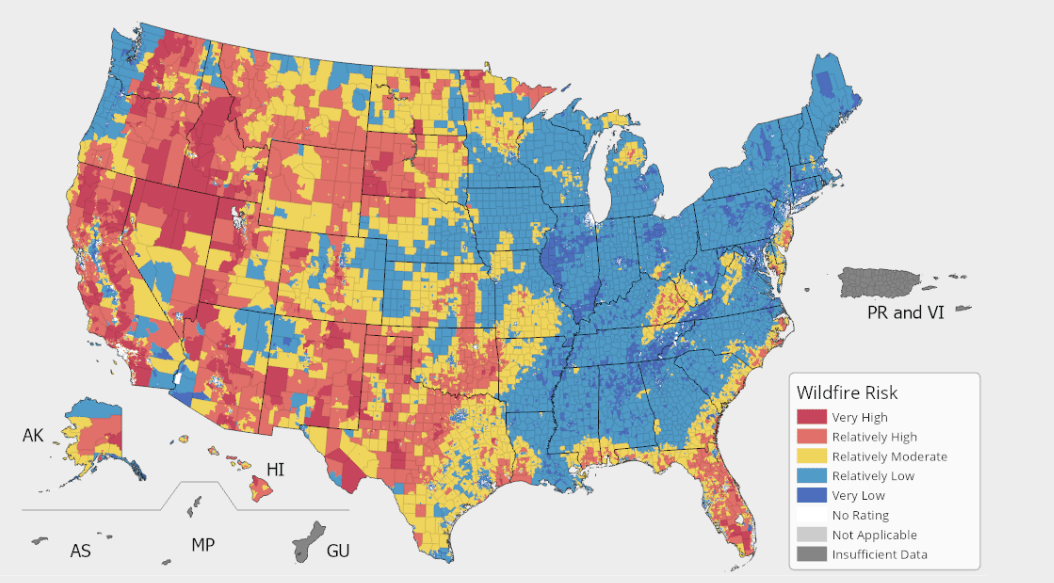
With a cost-of-service model, Utilities recover costs through rate adjustments that might account for rising inflation, clean energy goals, and stabilizing electric grids. The same researchers note how a December 2022 application filed on behalf of Pacific Gas & Electric ( PCG ) requested recovery of costs related to wildfire mitigation, a problem common to Western states. Meanwhile, states like Florida and Texas are prone to hurricanes, and these events lead not only to higher rates, but more risk to investors.
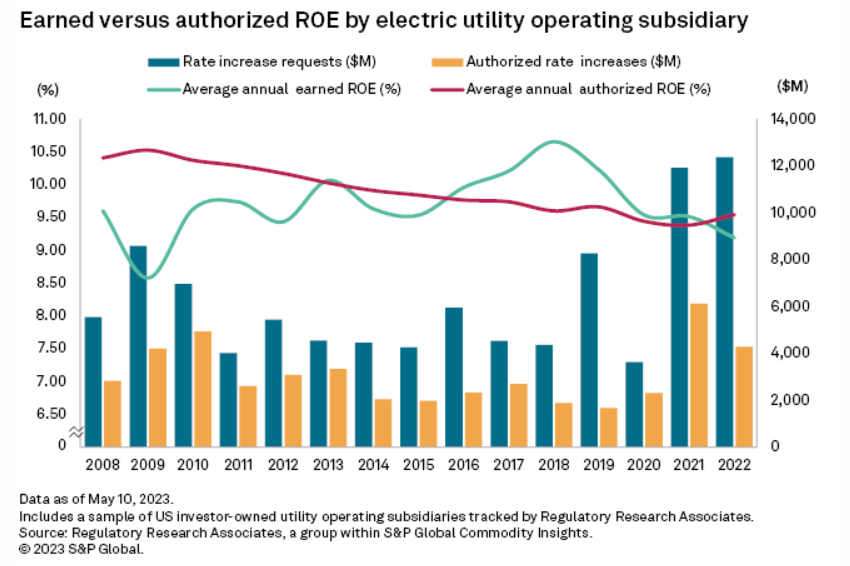
We've also seen a downward trend in average annual ROE authorizations between 2008-2021 and more of a bumpy ride between average annual earned ROEs. Notice how earned ROEs plummeted from around 10.50% in 2018 to about 9.25% in 2021. From 2019-2021, XLU underperformed SPY by 5.31%, 17.80%, and 11.05%, respectively. Data for 2022 is not included.
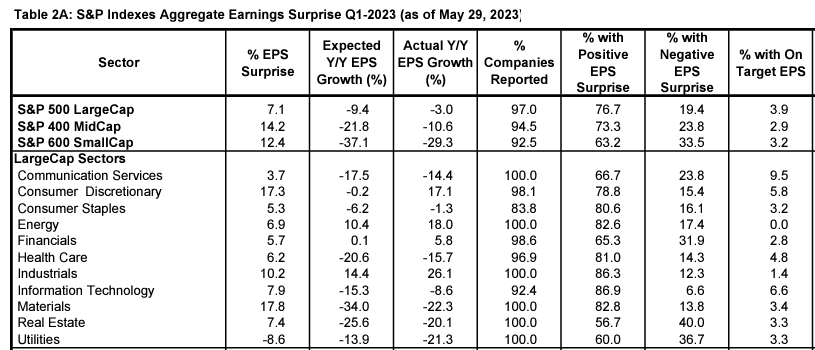
Earnings surprises and Wall Street consensus earnings estimates drive sentiment. Not everyone noticed it, but aggregate S&P 500 earnings surprises started a significant downward trend in the second half of 2021, according to Yardeni Research . That was a signal to become more defensive, and as it turned out, Utilities was the second-best-performing sector in 2022 behind Energy. The opposite scenario played out in 2008-2009 when XLU first beat by 7.88% and then lagged by 14.65%. In Q1 2023, the Utilities sector disappointed the most, delivering a -8.6% earnings surprise compared to +7.1% for the S&P 500 Index. It was the only sector to miss expectations.
As a result, the performance order was reversed. Energy and Utilities are the first- and second-worst-performing sectors this year, according to State Street's SPDR Sector Tracker .
XLU Analysis
Fundamentals
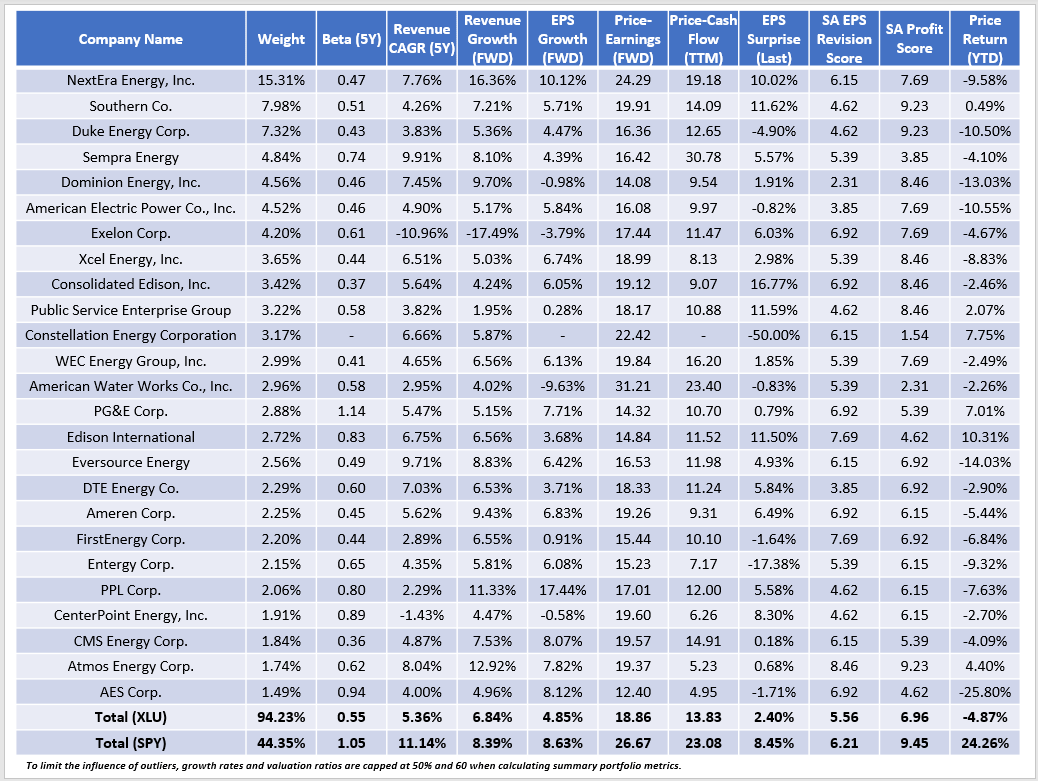
The following table highlights selected fundamental metrics for XLU's top 25 holdings, totaling 94% of the portfolio. Notice the 0.55 five-year beta, the lowest for any sector. However, as we saw earlier, that won't always translate to less variability. Instead, XLU is more likely to just produce a different set of returns than SPY.
XLU's growth prospects are lower, which isn't a surprise because its constituents largely depend on ROE authorizations. NextEra Energy ( NEE ) is a key growth exception and is XLU's largest holding with a 15.31% weighting. On valuation, XLU trades at a relatively cheap 18.86x forward earnings and 13.83x trailing cash flow due to poor recent performance. For perspective, that's 3-4 points cheaper than June 2022.
The downside is that these lower prices are at least partially justified by the weak earnings surprise figures discussed earlier. Furthermore, XLU has a 5.56/10 EPS Revision Score, which measures recent changes in analyst earnings estimates. For XLU to reverse its fortunes, I believe this metric must improve, which won't occur until we get better news on the earnings front.
XLU's Top Holding: NextEra Energy
Still, NextEra Energy's 9.58% YTD price decline could be overblown. The company beat earnings expectations by 10% last quarter and is poised to grow faster than any other Utility, mainly due to Florida's fast-growing population and the company's focus on solar energy, which management believes is the most cost-effective solution for its customers. Representing just 5% of Florida Power & Light's delivered energy, the company has taken steps to shore up the solar panel supply chain. As stated on the latest earnings call :
On the supply -- solar supply chain front, we continue to take constructive steps to mitigate potential future disruption. Nearly every one of our suppliers has repositioned their supply chains to manufacture solar panels in Southeast Asia using wafers and cells produced outside of China, and all our suppliers are expected to meet the criteria established in the Commerce Department's preliminary determination in the 2022 circumvention case by the end of 2023.
Risks include consensus estimates through 2026 that are virtually identical to the top-end of management guidance. It's no accident, as management consistently communicates "disappointment" should they not deliver near the top end of their adjusted EPS expectations, including in their latest monthly investor presentation . Furthermore, the transition to renewables is painfully slow for any Utility, including NEE. Before writing exclusively on ETFs, I covered the stock in December 2020 and noted a few headwinds, including how fossil fuels still comprised nearly half its generation portfolio.
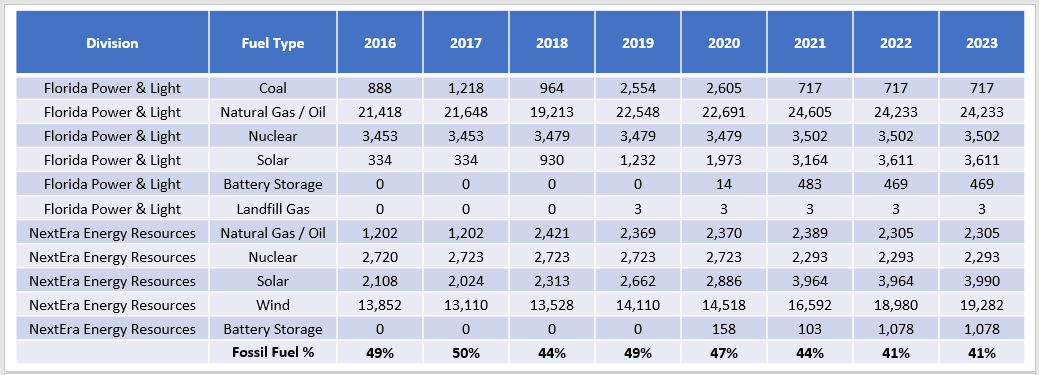
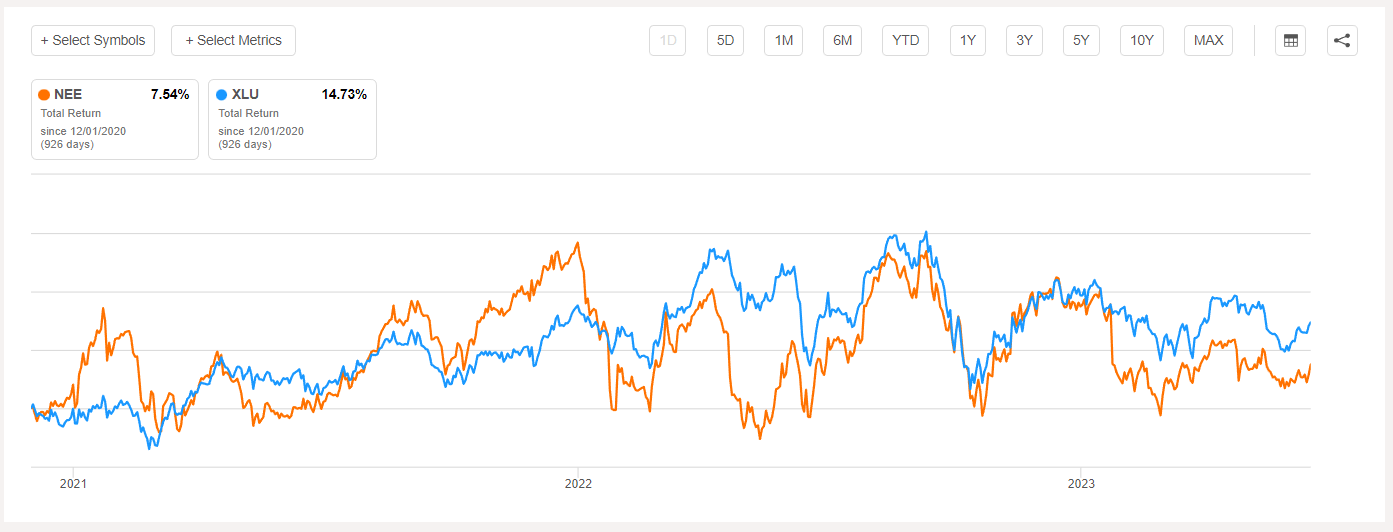
As shown above, fossil fuels (coal, natural gas, oil) currently account for 41% of NEE's total portfolio and 77% at Florida Power & Light. Unfortunately, it's not economical to decommission these units or sell them off at an acceptable price. As much as NEE is moving in the right direction on clean energy, it's still a high-priced stock and has been a drag on XLU since my review.
Investment Recommendation
A buy rating on XLU is tempting, given its poor recent performance and big eight-point discount on forward earnings relative to SPY. However, price weakness is at least partially justified. Inflation and interest rates are declining, which may lead to lower future ROE authorizations from Public Utility Commissions. Earnings surprises were negative last quarter, and it might be hard to top expectations moving forward, given how NEE, XLU's top holding, consistently guides analysts toward the top end of the company's earnings ranges. Finally, Wall Street is not bullish yet, as indicated by XLU's poor 5.56/10 EPS Revision Score. This may change soon, and I will update if it does. But for now, I prefer to remain on the sidelines and not try to time the bottom. Therefore, I've rated XLU as a hold, and I look forward to discussing this further in the comments section below. Thank you for reading.
For further details see:
XLU And NextEra Energy: Still Too Early To Buy The Utilities Sector