RTH - XRT ETF: Not The Best Bet
2024-01-04 20:46:57 ET
Summary
- The SPDR S&P Retail ETF focuses on 77 stocks from the retail sector, including apparel, specialty stores, and automotive.
- We touch upon some of the underlying conditions in the retail sector.
- Retailers offer good value compared to the broader consumer discretionary sector, but XRT may not be a good buy due to its riskier portfolio and unappealing risk-reward.
ETF Snapshot
The SPDR S&P Retail ETF ( XRT ) is a $365m sized ETF that focuses on 77 stocks from the retail segment; stocks here include those primarily from the apparel sub-segment (~23% of all holdings), specialty stores (~22%), and the automotive sub-segment (~21%). Besides these key sub-segments, you also get exposure to retailers involved in computers & electronics, food & drug retail, department stores, and consumer staple merchandisers.
Retail Sector Commentary
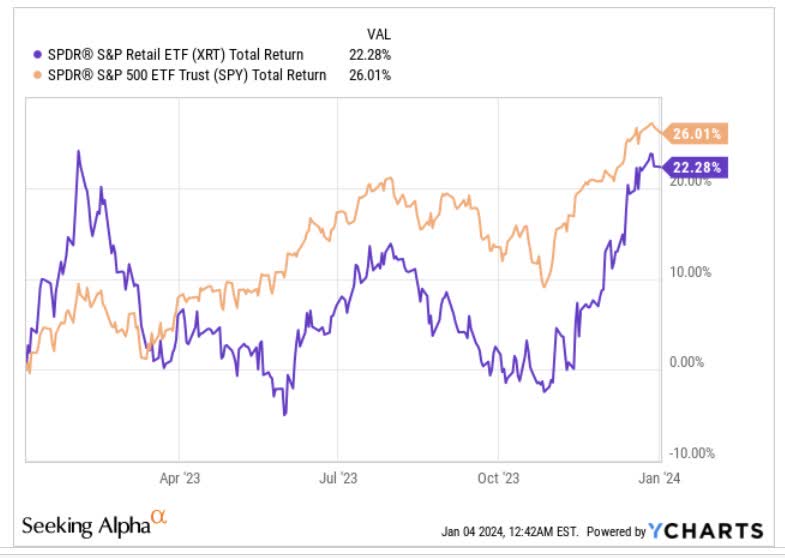
Retailers have enjoyed a fairly resolute 2023; XRT may have underperformed the benchmark index by a few percentage points, but yet still, 22% returns over the past year are nothing to be scoffed at.
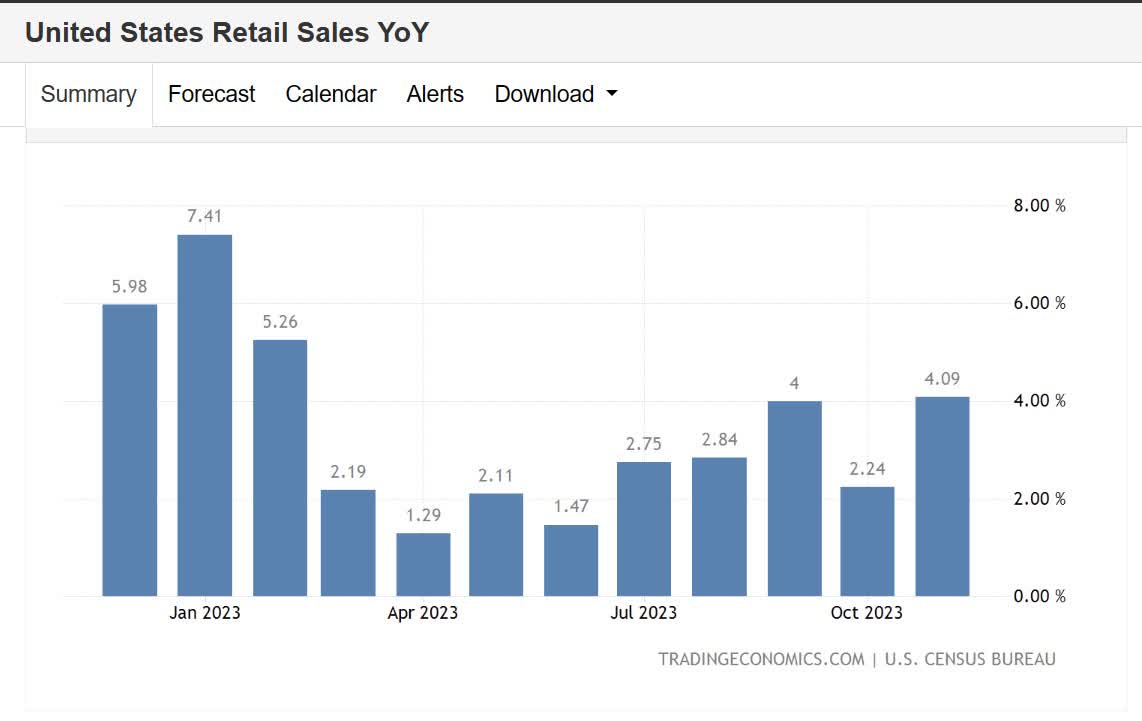
As things stand, underlying conditions for the retailers look fairly encouraging although there is still scope for further improvement. Despite an environment characterized by elevated interest rates, and a general tilt towards services-oriented discretionary spending, as opposed to goods-related spending, it’s worth noting that in 2 out of the 3 latest reports, US retail sales have grown at an annual pace of over 4%, picking up from the 1-3% YoY run rate that has dominated proceedings since March this year.
In fact the latest November report of 4.1% growth was the best reading since Feb-2023. Having said all that, this segment is still not operating at full tilt, given that the current sales runrate is still below the 30-year YoY average of 4.82%.
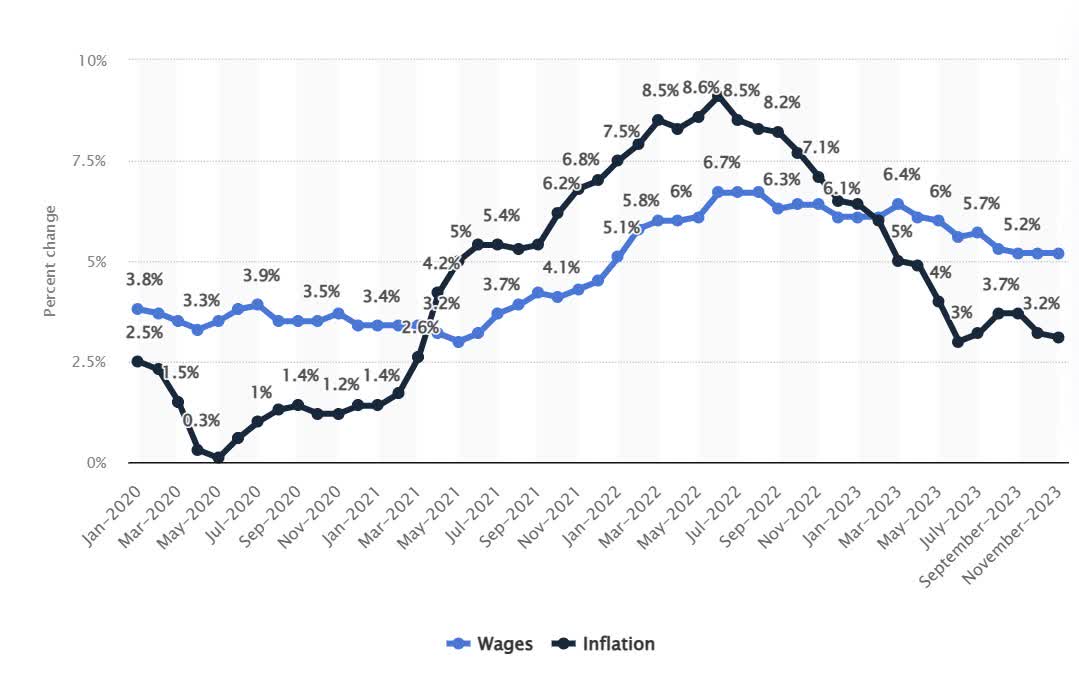
However, with the Fed on course to cut rates by 25bps on six separate occasions next year, household budgets should be in a better spot to engage in discretionary purchases. Crucially, with inflation coming off at a rapid pace, real wages are not in a particularly shabby pace, even if the pace of growth may be easing here as well.
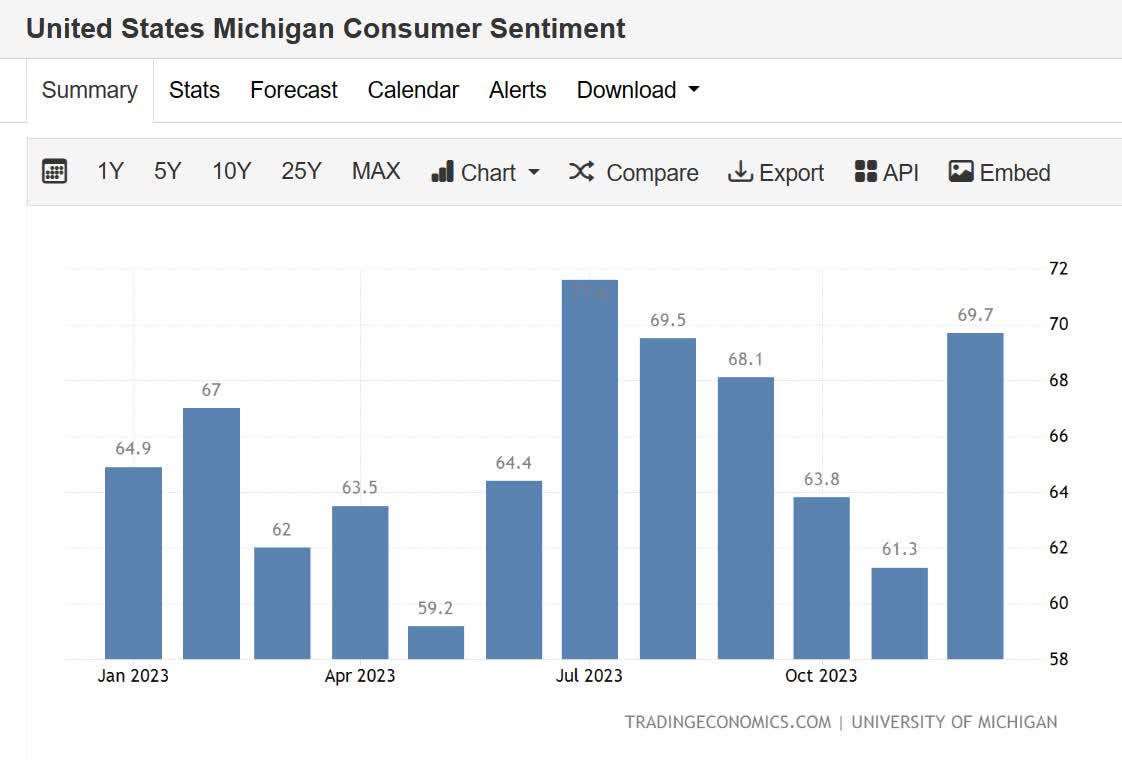
In light of these developments, it is little wonder that the forward-looking consumer confidence readings recently hit 5-month highs of nearly 70.
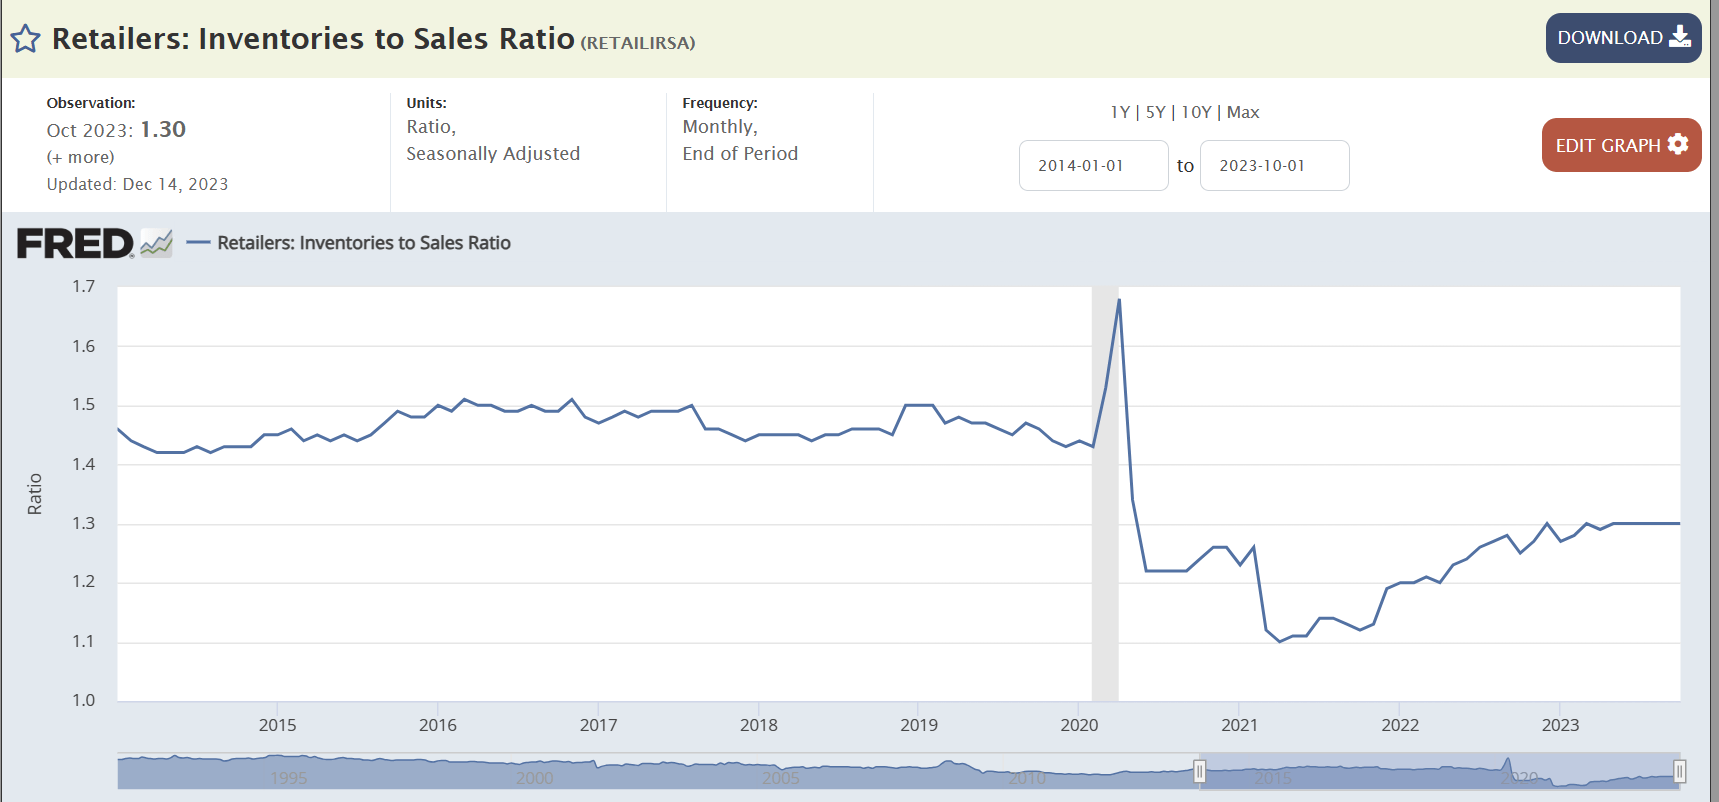
The other thing to also note is that retailers appear to be running a tight ship when it comes to inventories, thus resulting in lower carrying costs and better sales efficiency.
Note that during the pre-pandemic era, the average inventory-to-sales ratio used to consistently hover between the 1.4-1.5 levels, but in recent periods note that this has been flattening out at the 1.3 levels, even though one should have seen a spike in Sep/Oct/Nov, given the onset of the holiday shopping season.
A much smaller inventory base could also be a corollary of the growing incidence of organized retail theft, which has accounted for two-thirds of retailers' shrink. A growing shrink rate can be very damaging for the bottomline and reportedly accounted for over $112bn of losses in FY22. However, we’ve been encouraged to note that the Federal authorities have been taking steps to address this with the passage of the INFORM ACT last year, and now a greater thrust towards the potential passage of the CORCA Act (Combating Organized Retail Crime Act).
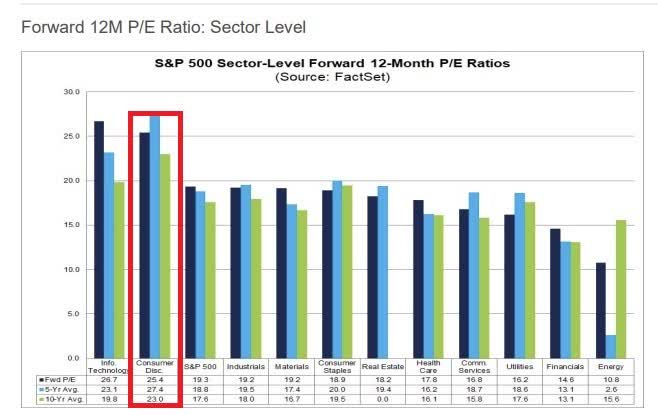
We also think retailers offer pretty good value compared to the broader consumer discretionary sector which currently accounts for one of the most expensive components of the broader market. At a forward P/E of 25x, the discretionary sector is second only to tech stocks, whereas retailers (as represented by our focus ETF- XRT) are priced at a massive 43% discount of 14.2x forward P/E.
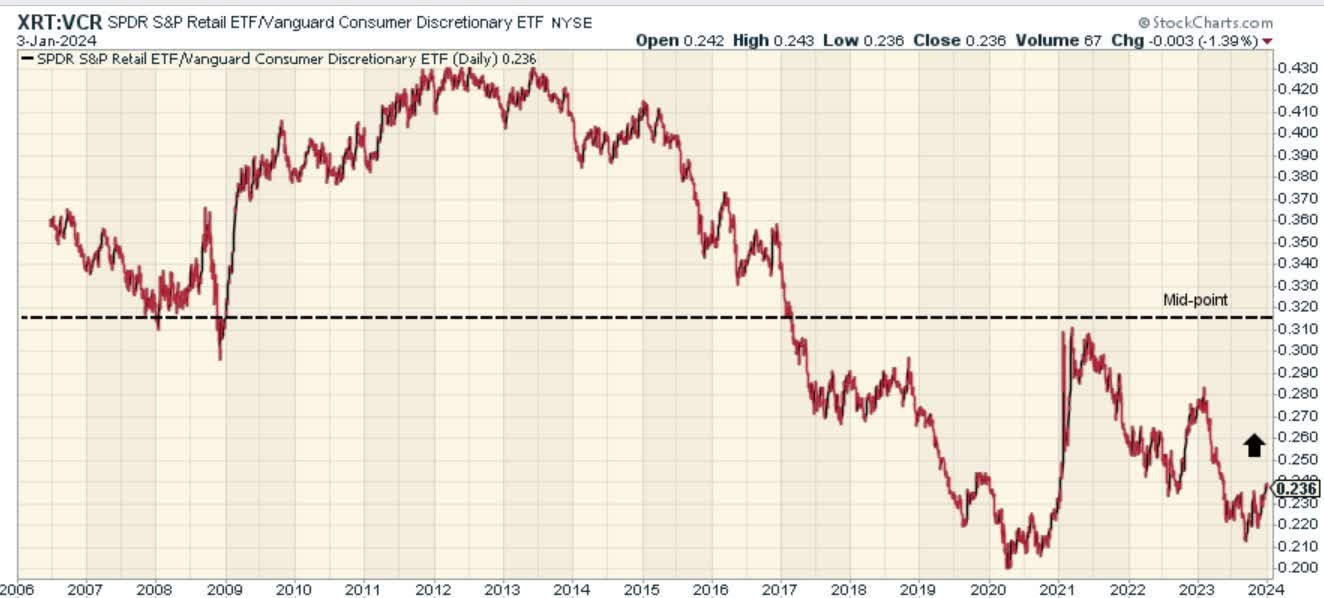
This is reiterated even on the relative strength charts measuring how retailers are positioned versus the broader discretionary sector. If you’re looking for a mean-reversion opportunity within the discretionary universe, it looks like these retailers wouldn’t be a bad shot as the current relative strength ratio is around 25% off the mid-point of its long-term range
Closing Thoughts- Is XRT A Good Buy?
Whilst underlying conditions in the retail sector support a long thesis, we are not convinced that XRT would make a good buy.
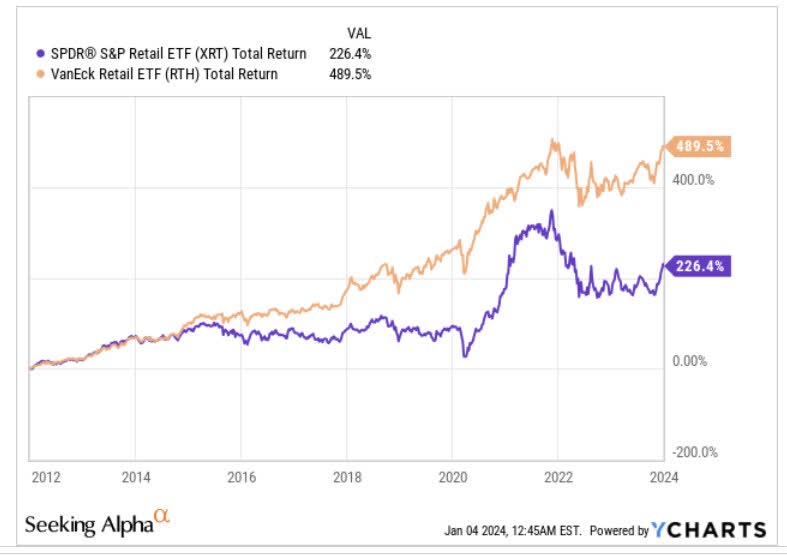
Firstly, there are question marks over whether pursuing a broad-based portfolio of retailers across the entire market ( XRT ) is preferable to just pursuing a smaller cohort of large-caps (we’re referring to the VanEck Vectors Retail ETF- RTH, the other major option in this space)
Well, if you want to take a cue from the historical trends, note that the much-focused portfolio- RTH with only 25 stocks has outperformed XRT quite handsomely since its inception in 2011 (XRT came to the bourses 5 years before that).
Given that RTH tracks a market-cap weighted index, it can also come across as quite top-heavy, and tilting more towards large-caps. This is exemplified by the fact that RTH’s top 10 stocks account for 72% of the total portfolio, and it largely only covers large-caps (78% of the portfolio), with no exposure whatsoever to small or micro-caps.
XRT on the other hand offers exposure to all caps but large-caps account for the lowest share (only 8%), and given that it follows an equal-weighted index- The S&P Retail Select Industry Index, its top 10 weightage is rather low at 16%.
Morningstar
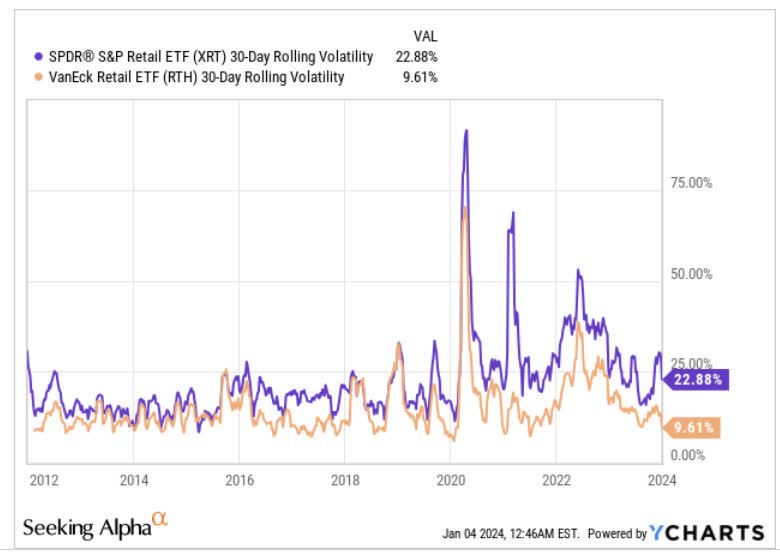
Note that XRT’s heightened exposure to the more volatile components of the market (small and micro-caps account for 59% of the total portfolio) also mean that this is inherently a riskier portfolio. This is mirrored in the drastic differential of the volatility profiles of the two retail-focused ETFs, where XRT’s monthly rolling volatility is 2.38x that of RTH’s figure.
Also consider that even though both ETFs are available at a similar expense ratio of 0.35%, RTH comes across as more efficient from a tax angle as only 20% of its holdings get pruned every year, as opposed to 40% for XRT.
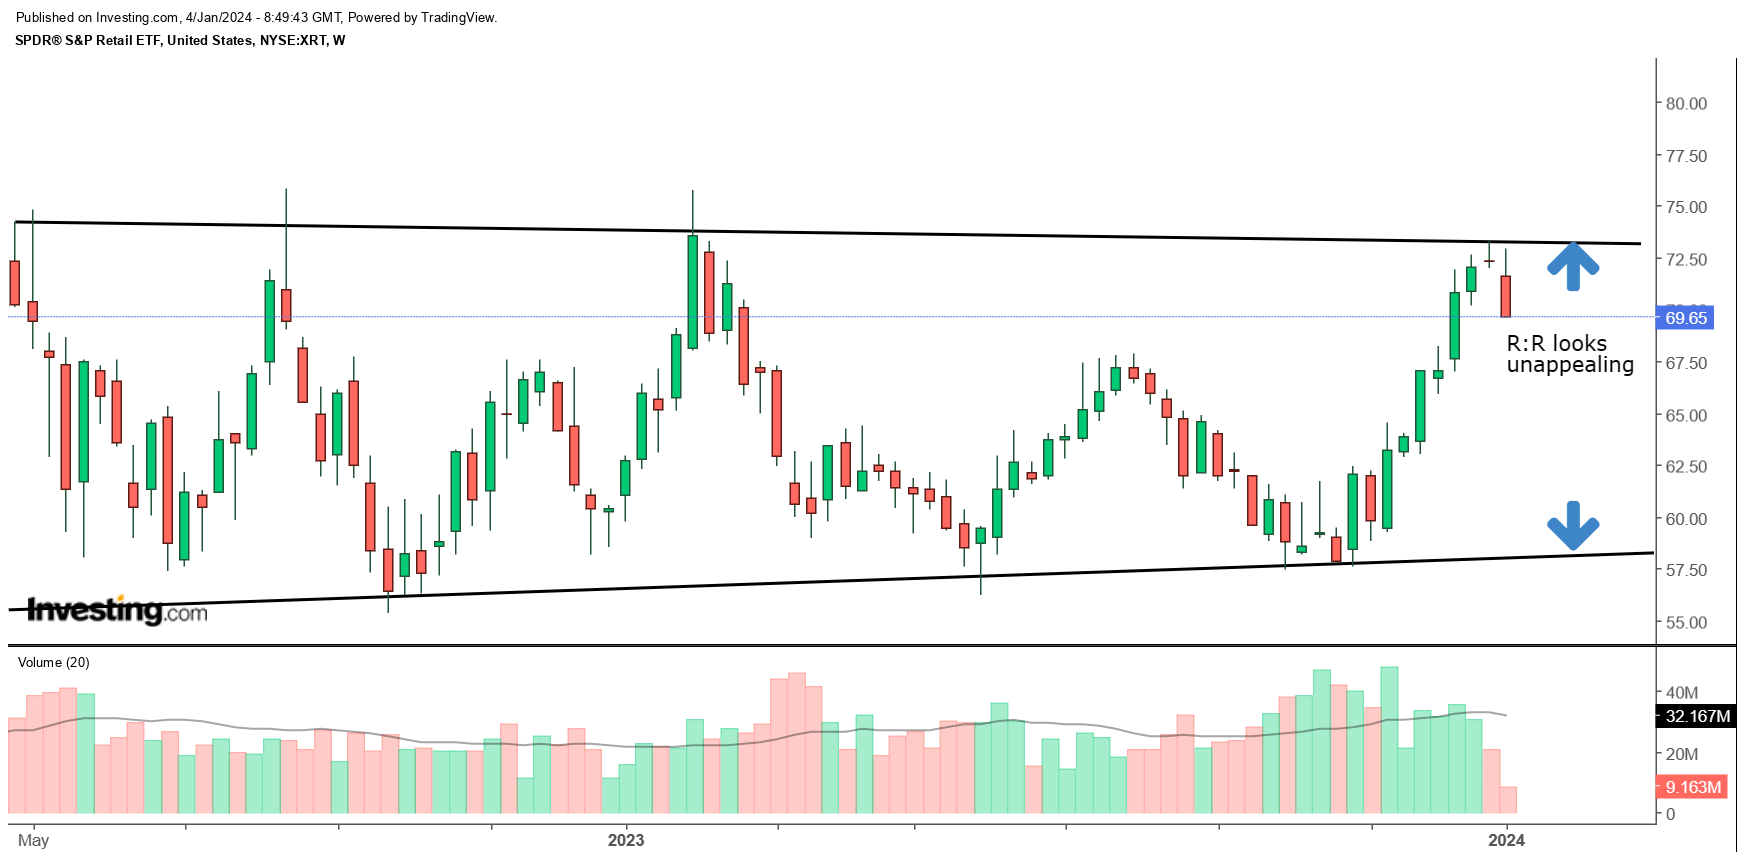
Finally, if one looks at XRT’s weekly chart, we can see that over the last 20-odd months, this product has established a certain trading range. The upper boundary is between the $72-75 levels, and the lower boundary is between the $55-$60 levels. Whenever the ETF hits these pivot points, we see a sharp recoil from there. We saw that happen last week (with a continuation this week) and given how close the ETF is to the upper boundary, we don't think the risk-reward is appropriate for a long play now.
For further details see:
XRT ETF: Not The Best Bet