XYLD - XYLD: 13% Yield Monthly Payer Vs. S&P Alternatives
Summary
- The XYLD ETF uses Covered Calls on the S&P 500 to generate monthly income and offers some downside protection to investors.
- Its trailing yield is 12.96%, and it pays a variable distribution.
- We compare XYLD's performance, yield, and valuation to other S&P-based covered call funds.
The S&P 500 has started out 2023 with a bang, rising over 7%, but do you think that positive trend will continue?
If you want to hedge your bet, and derive some high yield income from the S&P, the Global X S&P 500 Covered Call ETF ( XYLD ) is one way to do that.
Fund Profile:
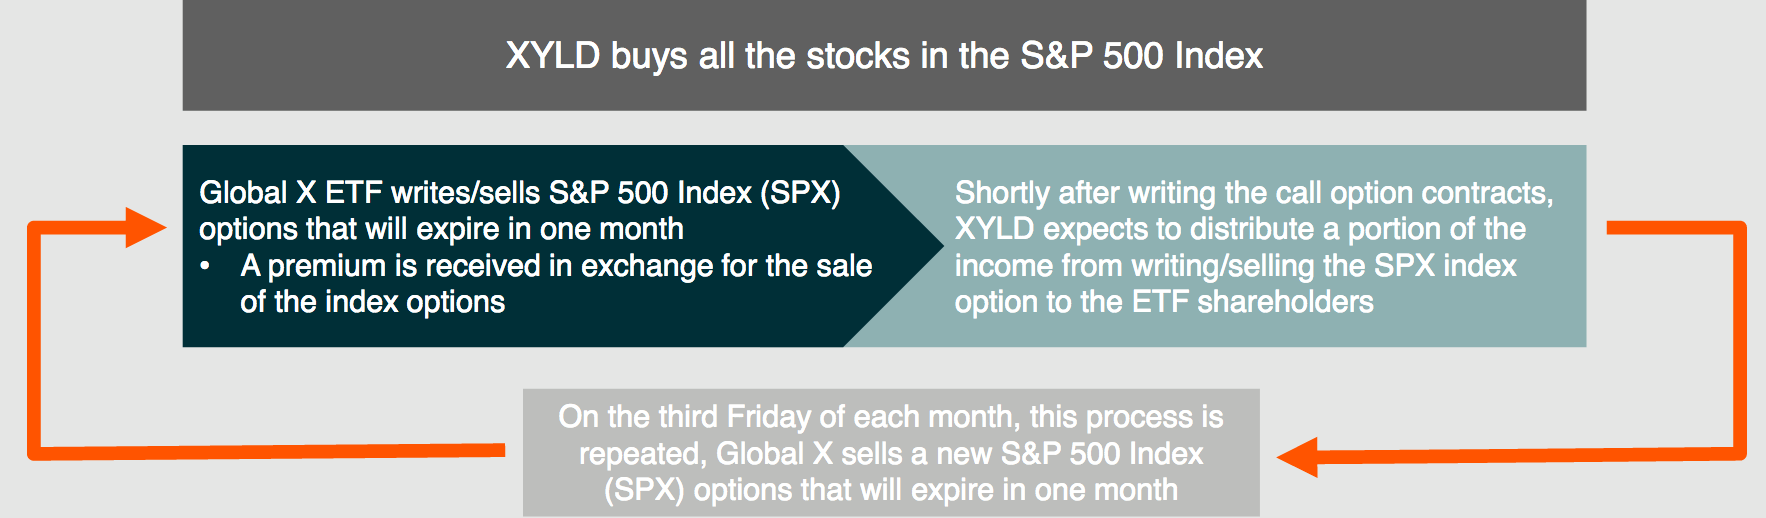
XYLD seeks to provide investment results that correspond generally to the price and yield performance, before fees and expenses, of the Cboe S&P 500 BuyWrite Index. It follows a "covered call" or "buy-write" strategy, in which the Fund buys the stocks in the S&P 500 Index and "writes" or "sells" corresponding call options on the same index. The fund has a 0.60% expense ratio.
XYLD's monthly distribution is capped at the lower of: a) half the call premiums received, and b) 1% of the net asset value NAV. The excess of options premiums received, if applicable, is reinvested into the fund. (XYLD site)
The process is to buy all of the S&P 500 stocks, then sell one-month options on the S&P 500 index, then distribute a portion of this option income. This process is repeated monthly.
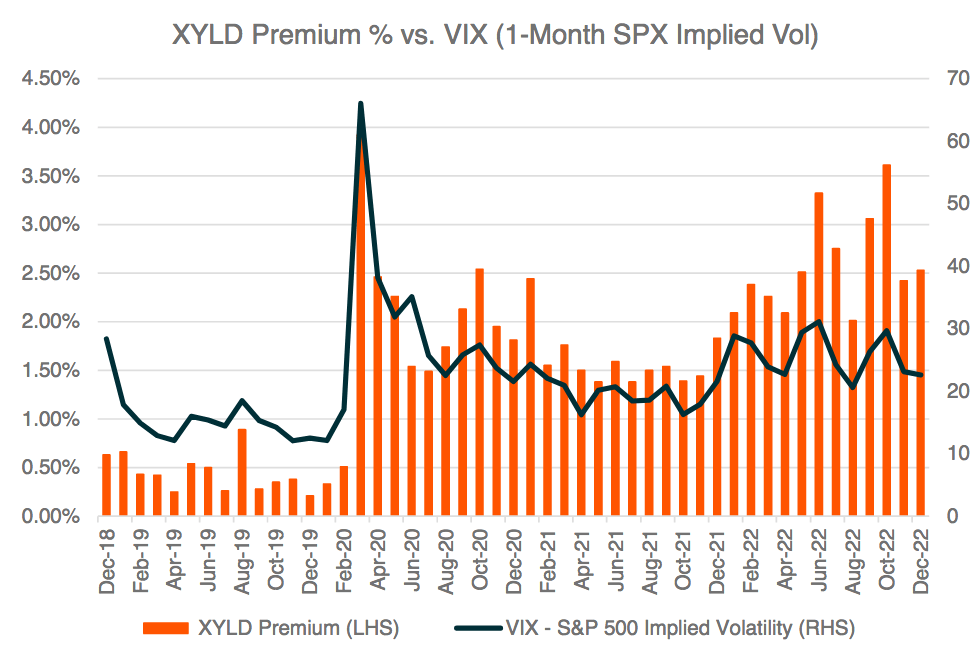
Call Option Premiums:
The value of the call option premiums is tied to implied volatility - as the VIX rises or falls, so does the amount of money that call option sellers like XYLD receive:
This, in turn, increases or decreases XYLD's monthly distributions.
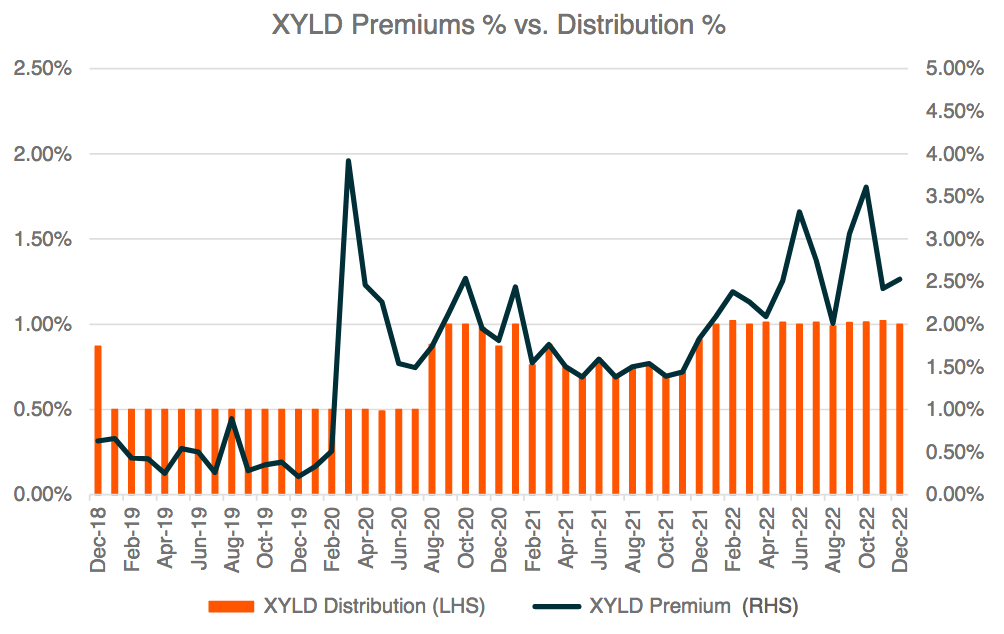
On Aug. 20, 2020, XYLD changed its tracking index from the Cboe S&P 500 2% OTM Buy Write Index to the Cboe S&P 500 Buy Write Index, which helped its distributions to align better with its current call option premiums. However, as seen in the figures below, spikes and declines in the XYLD's option premiums weren't reflected by big changes in its monthly distributions in 2022:
In the three market scenarios, rising, falling, and flat, XYLD's strategy should outperform in a falling and flat/choppy market , but underperform in a rising market, as the upside potential is limited by the sold options' strike price level.
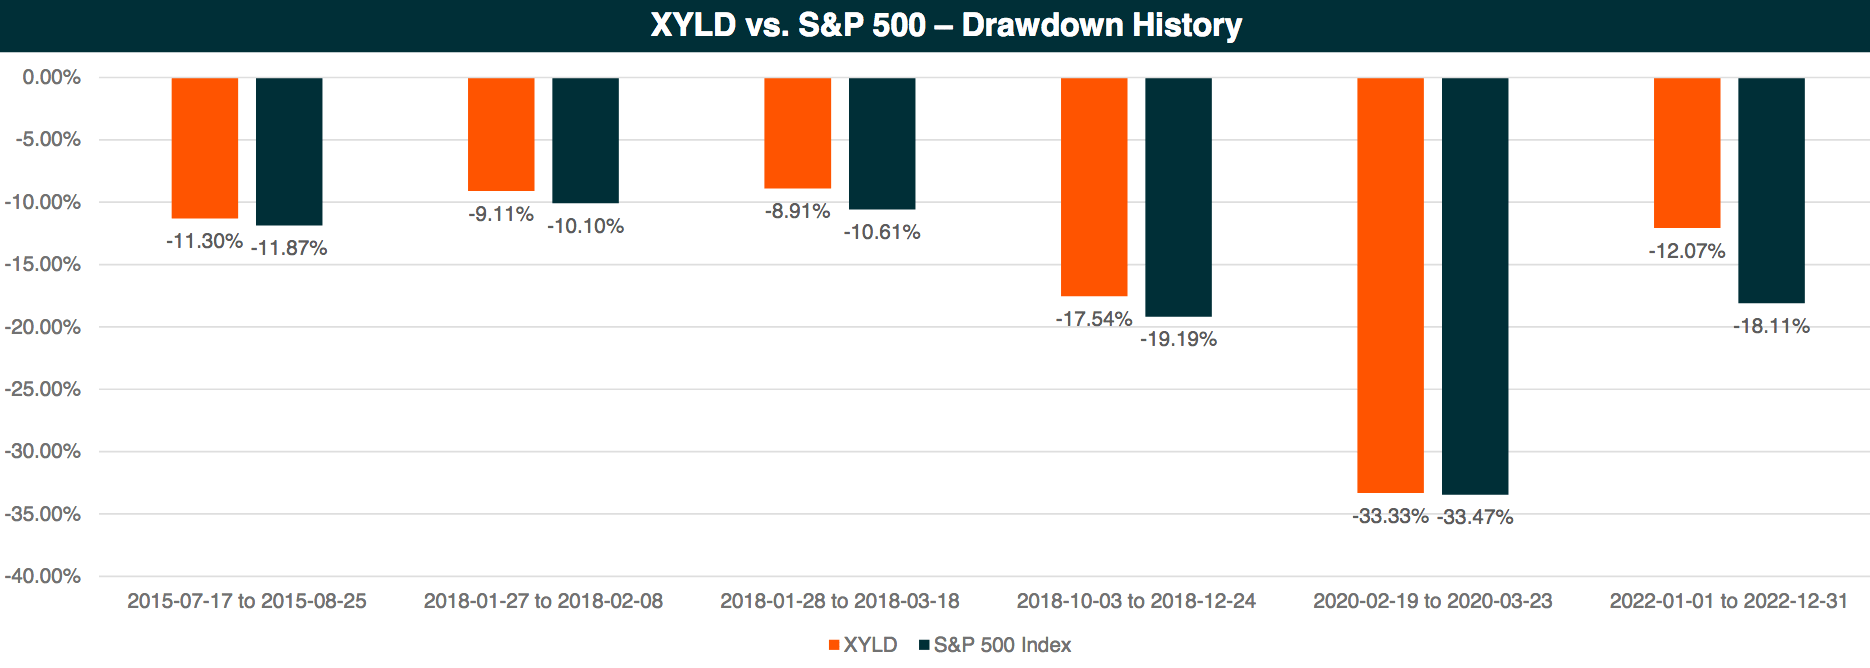
Drawdowns:
One of the values of this strategy is that it can limit your downside during market pullbacks, as shown in five of these six examples, in which XYLD's drawdowns weren't as severe as the S&P's. The exception was the COVID Crash of March 2020, during which XYLD fell -33.33%, similar to the -33.47% S&P decline that month:
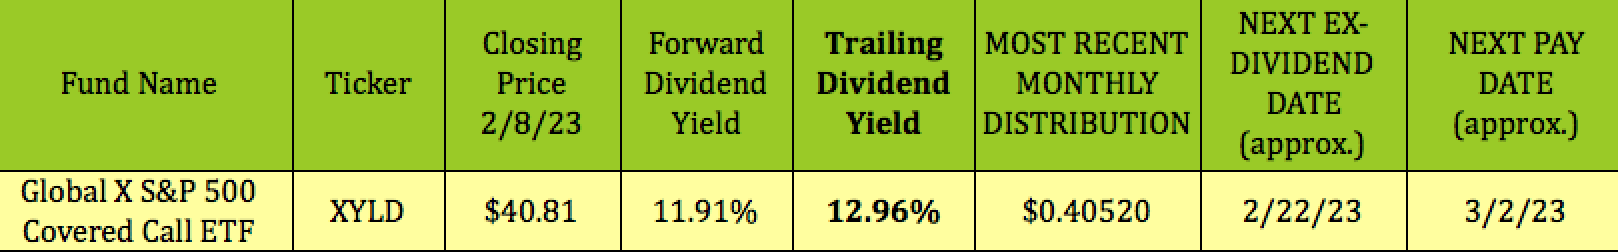
Dividends:
As XYLD pays a variable distribution, it's impossible to calculate an accurate forward yield. For example, its most recent monthly payout was $0.4052, which, if that were to be repeated each month, would indicate a forward yield of 11.91%, but, given XYLD's methodology, that's unlikely to happen.
XYLD's trailing yield is 12.96% - it should go ex-dividend next on ~2/22/23, with a ~3/2/23 pay date:
Alternative Funds:
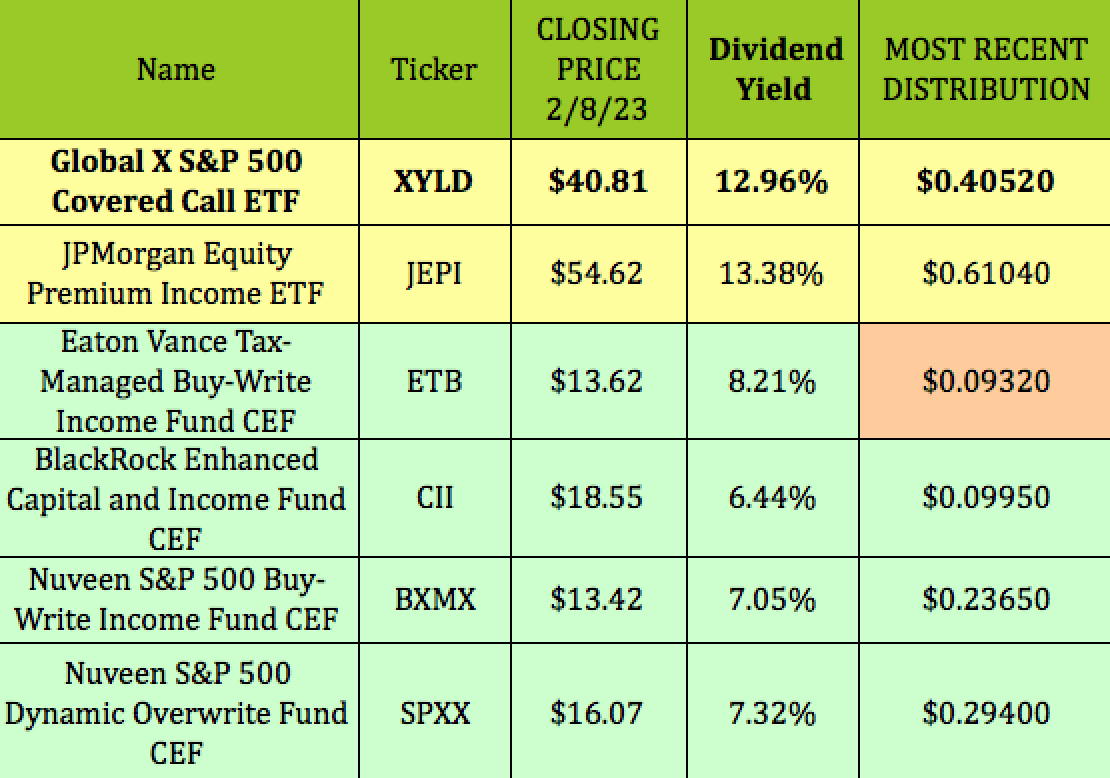
There are several other ETFs and CEFs which also employ a covered call strategy on the S&P 500, in order to generate income. Among them is another ETF, the JPMorgan Equity Premium Income ETF ( JEPI ), and four closed-end funds: Eaton Vance Tax-Managed Buy-Write Income Fund ( ETB ), Nuveen S&P 500 Buy-Write Income Fund ( BXMX ), Nuveen S&P 500 Dynamic Overwrite Fund ( SPXX ), and BlackRock Enhanced Capital&Income Fund ( CII ).
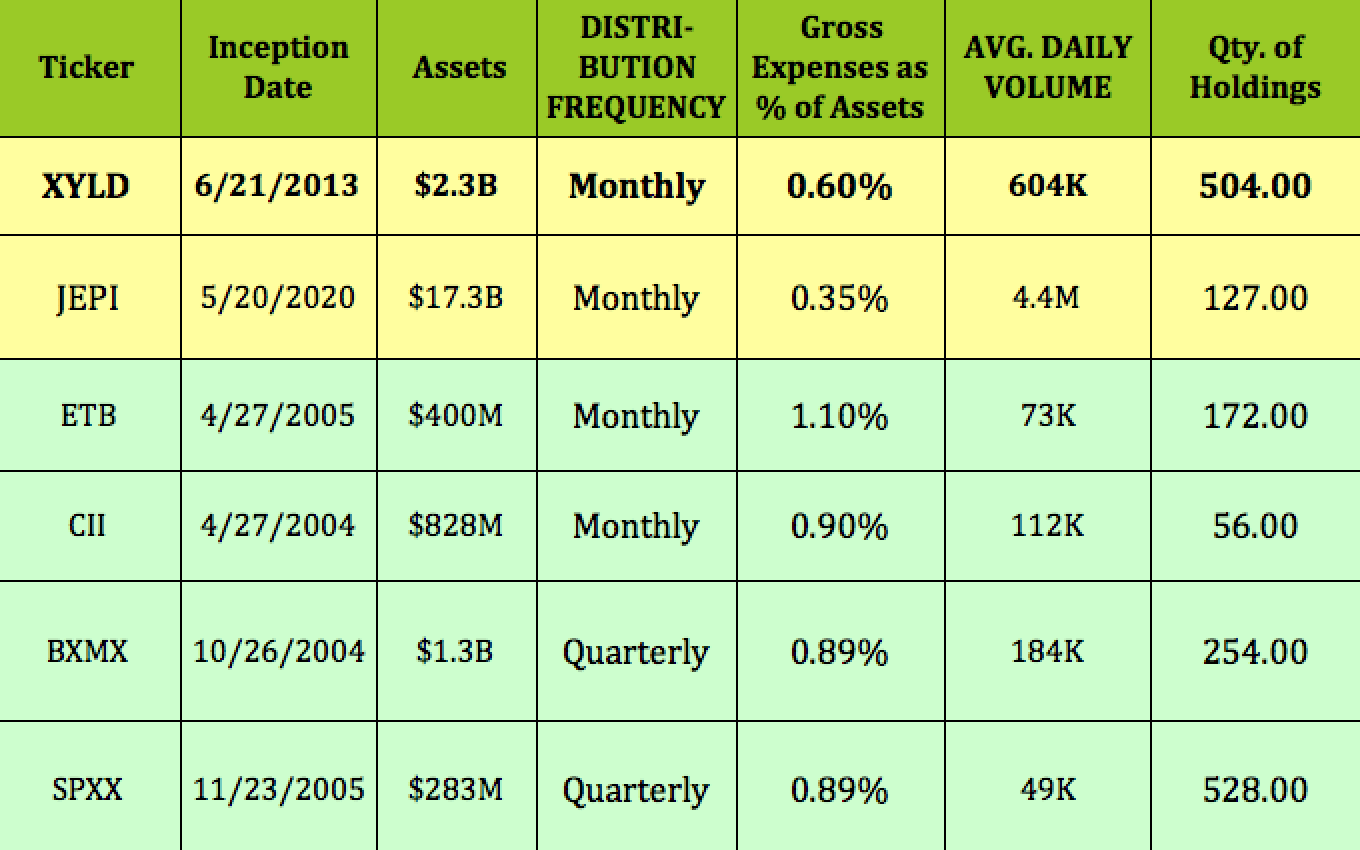
XYLD is the second-largest fund in this group, at ~$2B - it pays monthly, has 504 holdings, a low 0.60% expense ratio, and daily average volume of 604K shares. JEPI is the newest and largest of these funds, with a 5/20/20 inception date, assets of $17B, and the highest daily average volume in this group, at 4.4M shares. JEPI also has the lowest expense ratio in the group, at 0.35%.
The BXMX CEF is the third-largest fund, with $1.3B in assets, 254 holdings, and 184K in daily average volume. CII holds $828M in assets, with just 56 holdings, and 112K in average volume, followed by ETB, with $400M in assets, and 73K in volume, 172 holdings, and a 1.1% expense ratio. SPXX is the smallest fund in the group, with $283M in assets, a .89% expense ratio, 528 holdings, and 49K in average volume. BXMX and SPXX pay quarterly, while the other four funds pay monthly:
XYLD and JEPI have similar yields, with XYLD at 12.96%, and JEPI at 13.38%, both of which are much higher than the four CEF yields, which range from 6.44% for CII, to 8.21% for ETB. ETB decreased its monthly payout from $.1080 to $.0932 in November 2022:
XYLD Holdings:
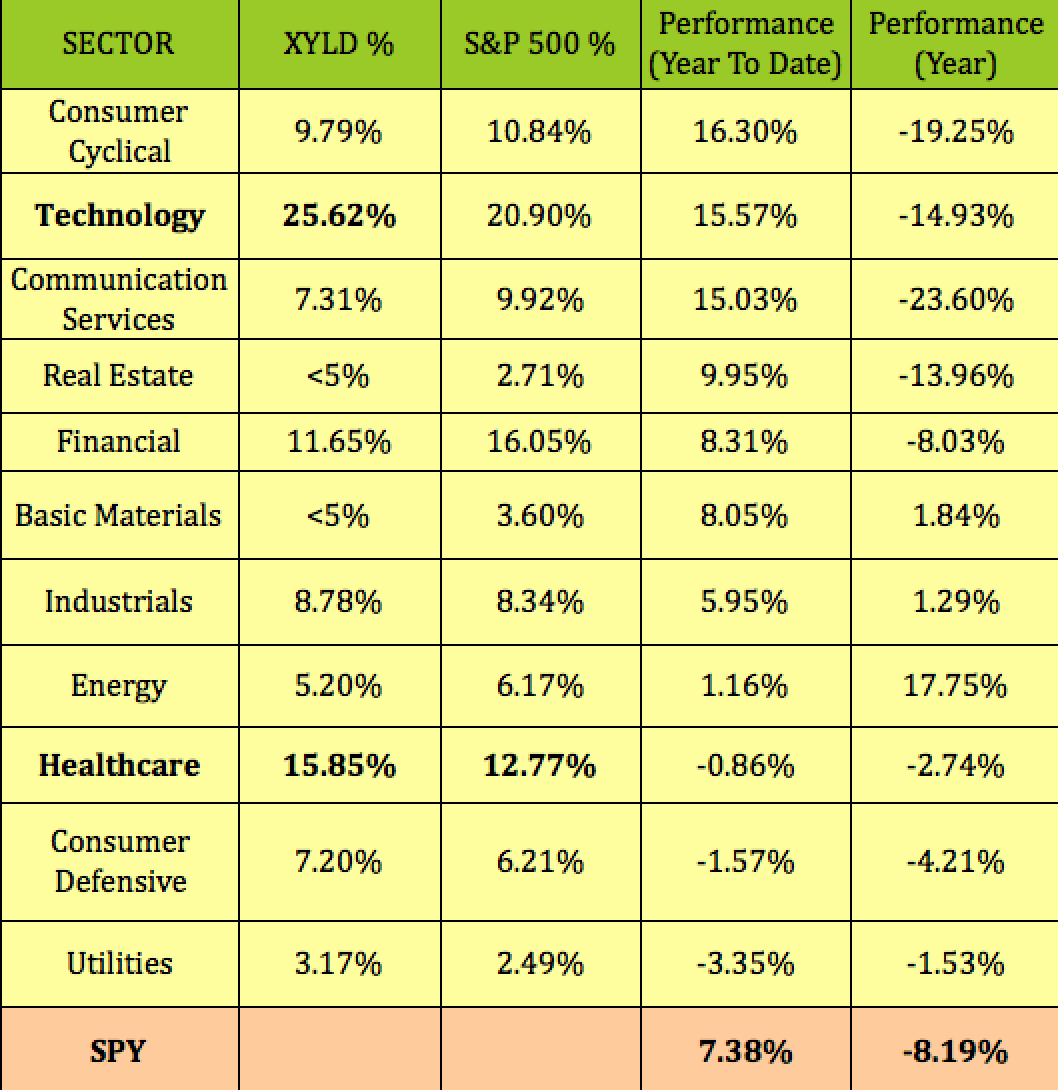
We compared XYLD's sector holdings to those of the S&P 500. Its two notable overweights are in Tech, at 25.6%, vs. ~21% for the S&P, and Healthcare, at ~16%, vs. 12.77% for the S&P.
XYLD's overweight position in Tech has helped it in 2023, with Tech up 15.5%, but detracted over the past year, with Tech down -14.93%, vs. -8.19% for the S&P.
Conversely, its overweight position in Healthcare was a positive over the past year, with Healthcare only down -2.74%; but this sector has lagged so far in 2023 - it's down -0.86%, vs. a 7.4% gain for the S&P.
Notable underweight positions are Financials and Communications Services, with the latter being one of the best performing sectors so far in 2023:
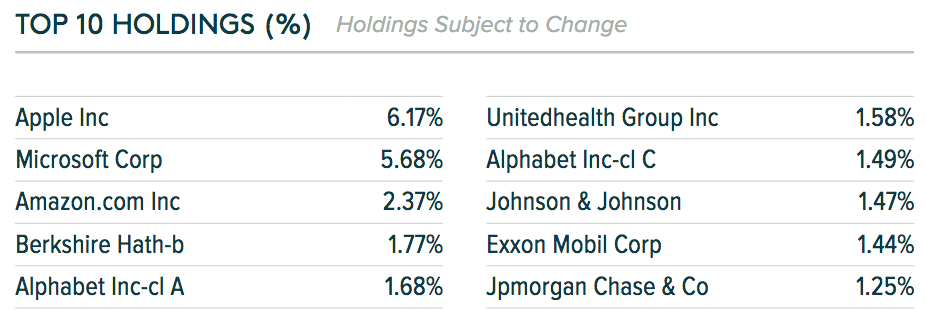
XYLD's top 10 holdings account for ~25% of its portfolio, and are topped by Apple, at 6.17%, and Microsoft, at 5.68%:
Performance:
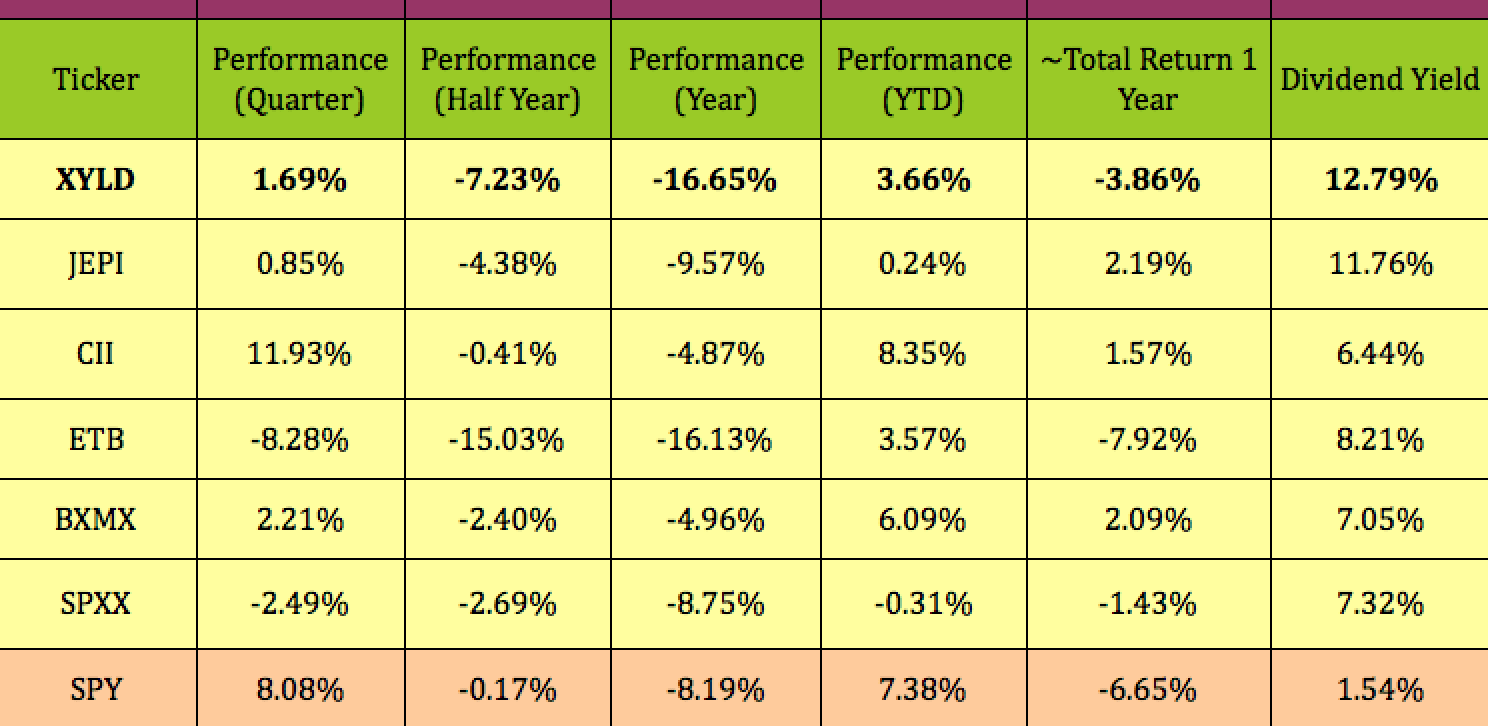
XYLD's price performance over the past year is the worst in this group, while its 1-year ~total return of -3.86% outperformed the S&P's -6.65%, but is the second-worst return in the group.
Recently, XYLD has been the third-best performer in the group, rising 1.69% over the past quarter, and 3.66% so far in 2023. However, as noted above, XYLD will underperform the S&P in a rising market, and such is the case so far in 2023.
JEPI had the best total one-year return in the group, at 2.19%, closely followed by BXMX, at 2.09%. CII was the only other fund to have a positive one-year return, at 1.57%. CII also outpaced all the other funds so far in 2023, with an 8.35% gain, followed by BXMX, at 6.09%.
Valuations:
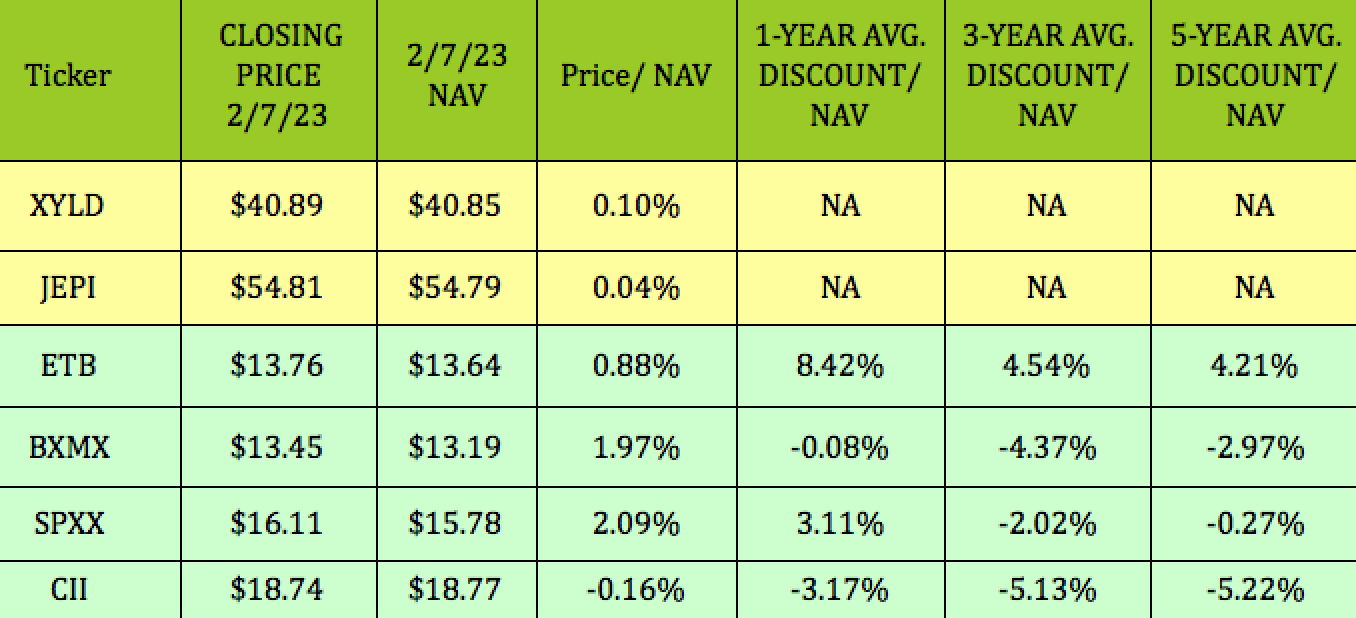
As seen below, unlike CEFs, ETF prices tend to closely track their NAVs.
Since CEFs can sell at wide discounts or premiums over the years, it can be a useful strategy to compare their current Price/NAV vs. their historical averages. Although it had a 0.88% premium to NAV on 2/7/23, ETB has the cheapest valuation in the group, with small premium much lower than its one-, three-, and five-year premiums of 8.42%, 4.54%, and 4.21%, respectively:
Parting Thoughts:
If you think that the S&P 500 is going to continue to rise in 2023, now may not be the best time to buy XYLD, as its price performance will lag the market. On the flip side, if you're outlook is bearish, XYLD can offer you some downside protection.
All tables furnished by Hidden Dividend Stocks Plus, unless otherwise noted.
For further details see:
XYLD: 13% Yield, Monthly Payer Vs. S&P Alternatives